- Reading – Obama campaign turns attention to Santorum (Sandhya Somashekhar) http://t.co/qxCrQNOu #
- Reading – Apple-requested Foxconn factory inspection revealing 'tons of issues,' FLA boss says (Chris Ziegler) http://t.co/bvzygOHa #
- Watching – Keck in Motion (Andrew Cooper) http://t.co/uogwn2kT #
- Reading – Who Mysteries: Jack’s Lost Memories (Doctor Who TV) http://t.co/s0aedxBk #
- Reading – Santorum's Surge Holds Steady So Far (Nate Silver) http://t.co/uiqGGAsn #
- Reading – The Fundamentals Now Favor Obama (Nate Silver) http://t.co/BC9CJCvb #
- Reading – Do We Really Want A Hedgehog-In-Chief? (Andrew Sullivan) http://t.co/XnABl3UI #
- Reading – Super-predatory humans (Matt Walker) http://t.co/5dwbUrrA #
- Reading – A Very Rough Estimate of the Republican Delegate Math Ahead, Part One (Josh Putnam) http://t.co/FWZjC0QC #
- Reading – Rick Santorum Wonders If Obama Is A Real Christian (Doug Mataconis) http://t.co/7WU7GF6M #
- Reading – Romney vs. Santorum: Class warfare in the GOP (Brad Knickerbocker) http://t.co/hYUpbod8 #
|
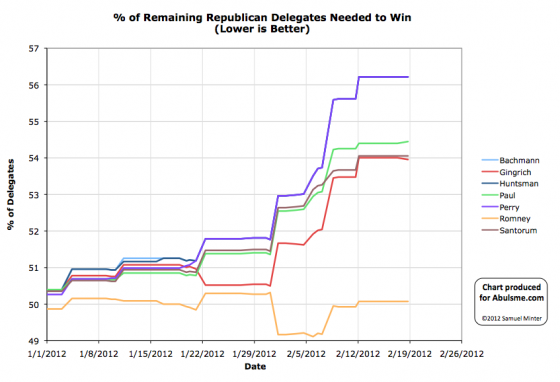
Chart from the Abulsme.com 2012 Republican Delegate Count Graphs page. When a candidate gets down to 0%, they have cinched the nomination. If they get up past 100%, they have been mathematically eliminated. A small change today. Maine revised its preference poll numbers to add some precincts whose results got lost in a spam folder (really). The result from this is that the delegate estimates give one less delegate to Paul, and one more to Gingrich. So Gingrich wins the day today. But Maine’s results will change again. First, there are still more precincts who haven’t done their votes yet (or are doing them today). So there may well be more straw poll Maine updates to come. More importantly though, these are only estimates based on the straw polls, in fact, no delegates have been selected at all yet. In fact, delegates to the state convention were selected, who in turn will select delegates to the national convention. That won’t happen until MAY. Estimates of what will happen in May really should be based on asking each of the delegates to the next level of the process who they intend to support. But nobody seems to be doing that sort of things, so instead we (well, Green Papers) base estimates on the straw polls. But the real results may be very different. You may have someone like Paul out organizing and getting an outsized number of delegates compared to the star poll (the Paul campaign claims they are on track to do this), or, you may have the nominee being a done deal by May, and get all delegates allocated to the obvious winner, regardless of what happened in February. Anyway, with the best estimate we have as of when I pulled the numbers a couple hours ago, today Gingrich gains a delegate and Paul loses one. Edit 2012 Feb 18 23:10 – Minor wording change
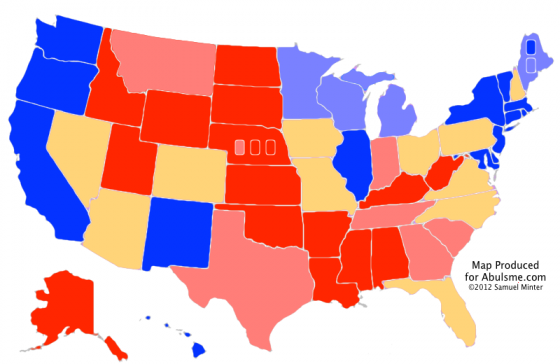
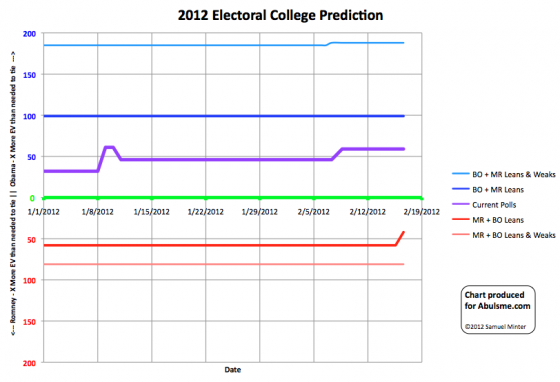
Map from the Abulsme.com 2012 Electoral College Prediction page. I’ve switched the color of the swing states to gold to make them stand out more. Also note this analysis is strictly Obama vs Romney. If some other candidate takes the delegate lead on the Republican side, I’ll start an analysis for them too, but not before. The big change today is that a new poll moves my five poll average for Michigan to a greater than 5% lead for Obama. This takes it out of my “Lean Obama” swing state category and into the “Weak Obama” category, meaning that Obama has a nice lead in the state, but not so large he can take it for granted. In terms of the range of outcomes that seem possible (again, if the election were held today, which it won’t be, and a lot will happen before November), we consider as the extremes of what is likely all the swing states going one way or the other. This is a highly unlikely outcome in and of itself, but it serves to bound the range of possible outcomes. With Michigan slipping out of the swing state category, this means Romney’s best case scenario is now Romney 311 – Obama 227. To achieve this he would need to win all the states where he is currently ahead in polling, and also pull Florida, Pennsylvania, Ohio, Virginia, Colorado, Iowa and Nevada away from Obama. The situation if everybody wins the states they are currently ahead in remains Obama 328 – Romney 210. Chart from the Abulsme.com 2012 Electoral College Prediction page. Lines represent how many more electoral votes a candidate has than is needed to tie under several different scenarios.
|
||||


