- Reading – Who To Blame If Obamacare Goes Down? Um, Obama? (Robert Wright) http://t.co/HFCLKQQ9 #
- Reading – Six-Legged Giant Finds Secret Hideaway, Hides For 80 Years (Robert Krulwich) http://t.co/EUbixjls #
- Reading – Does the Color Pink Exist? Scientists Aren't Sure (Melissa Locker) http://t.co/WF9Umul0 #
- @ppppolls Thanks for including the CD split in the NE poll! #
- Reading – Mega Millions frenzy: Can you ever beat the lottery's long odds? (Brad Plumer) http://t.co/XRyqtpfo #
|
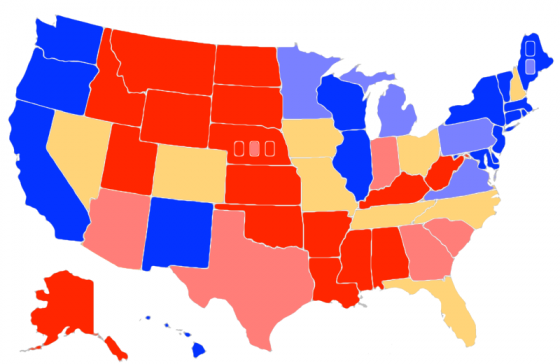
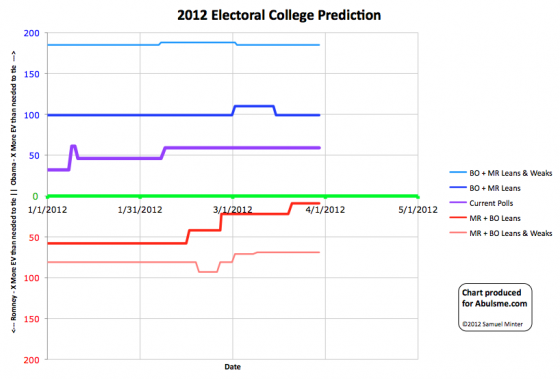
Map and chart from the Abulsme.com 2012 Electoral College Prediction page. Both assume Obama vs Romney with no third party strong enough to win states. Lines on the chart represent how many more electoral votes a candidate has than is needed to tie under several different scenarios. Up is good for Obama, Down is good for Romney. So my update today included a new PPP poll in Nebraska. This poll included a breakdown by congressional district, which is useful because Nebraska is one of two states (the other is Maine) which currently have the potential of splitting their electoral college vote. Both states do this with 2 electoral votes going to the statewide winner, then 1 electoral vote for the winner of each congressional district. Thanks PPP for actually doing the CD split!! Anyway, as I was adding the new data points for Nebraska at large and each of the three congressional districts, I noticed the previous data for the 1st and 2nd congressional districts included some errors. (Specifically the 2008 Republican and Democratic results were reversed… I use the 2004 and 2008 elections to seed the numbers for states that have had less than five actual Obama vs Romney polls.) The end result of this was that the 1st district had been classified as Weak Romney when it should have been Strong Romney, and the 2nd district was classified as Strong Romney when it should have been Weak Romney. I corrected this and the new poll results didn’t change the classifications again. The net result of this is just that on the map I had the wrong one of the three boxes in Nebraska light red. It should have been the 2nd box instead of the 1st. This has now been corrected. Since both districts are one electoral vote and the changes balanced each other, the lines on the graph do not change at all. The summary remains:
Note 2012 May 23 10:43 UTC: Due to an error in my spreadsheet, a change in status for Wisconsin from Weak Obama to Strong Obama that should have been noted on this update on March 30th, was prematurely made on March 2nd. The corrected time series chart can be seen starting with the May 23rd update. Thanks to Darryl at HorsesAss for finding the mistake. Note 2012 Jun 16 21:22 UTC: Actually, with more information, the Wisconsin transition should have happened on March 31st. See the correction on the June 19th update. |
||||||||||||||


