This is the website of Abulsme Noibatno Itramne (also known as Sam Minter). Posts here are rare these days. For current stuff, follow me on Mastodon

Categories

Calendar

February 2016
S M T W T F S
 123456
78910111213
14151617181920
21222324252627
2829  

Republicans: Three Way Race out of Iowa

Unlike the Democrats, the Republicans didn’t have years of superdelegates endorsing one candidate or another, so Iowa really was a clean slate. The very first delegates earned in the race for the 2016 Republican nomination. The headlines are of course that Trump underperformed the poll-based expectations letting Cruz slide to a win, while Rubio outperformed his expectations, coming in a close third. This is all true.

But it is also true that only a tiny fraction of the delegates have been allocated so far. None of the candidates got a majority in Iowa either. So nobody is actually yet on a track to overall victory. Cruz may be slightly ahead, but Trump and Rubio are right at his heels. Cruz is not in a dominating position. It really is a three person race.

Looking at the raw delegate graph quickly…

chart-29

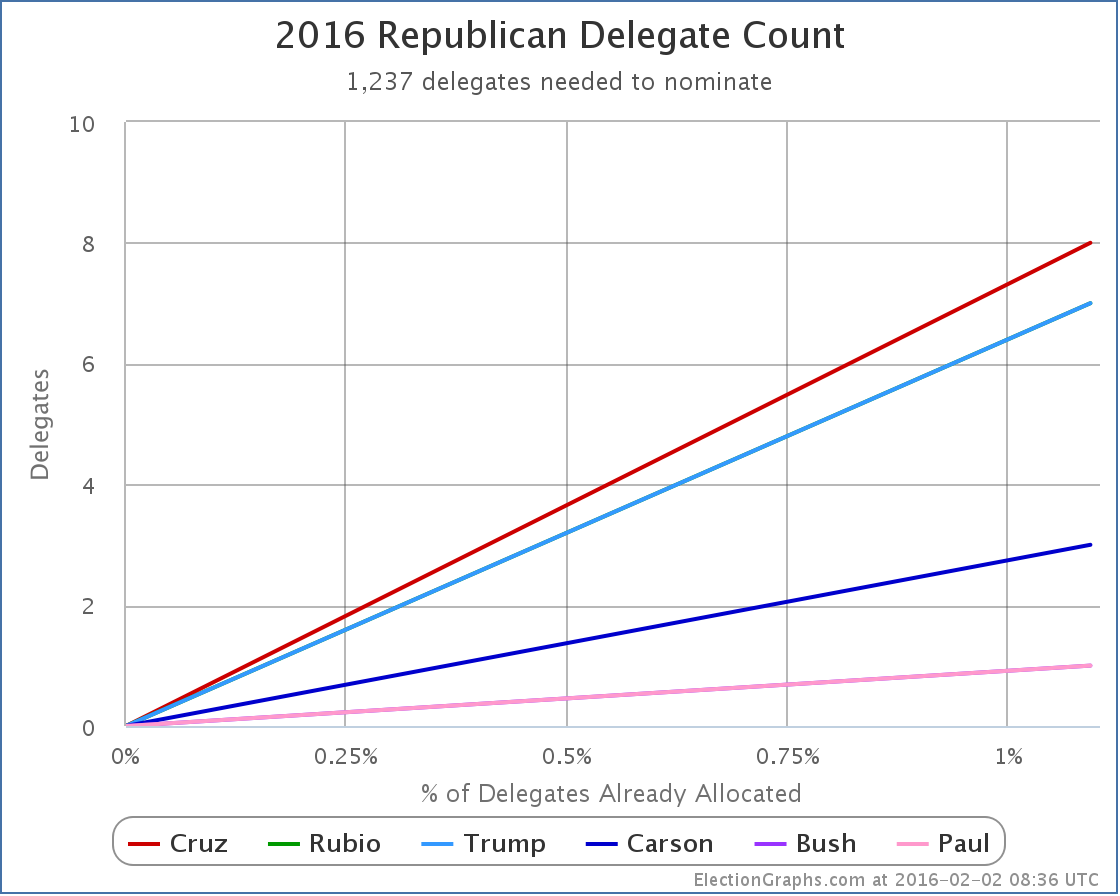
…you immediately notice that we just have a really boring graph with a few straight lines. And Rubio’s line and Trump’s line completely overlap too. As do Bush and Paul’s lines. That’s because this is our first real data point after everyone was just at zero.

All of the graphs are like this. So just this once, lets skip the graphs and look at the summary table instead:

Screen Shot 2016-02-02 at 09.55.24606

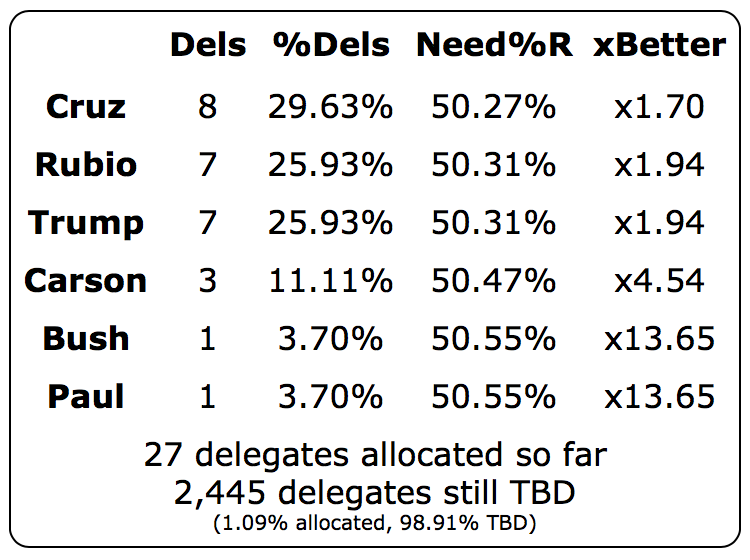
I’ll note here that Green Papers has slightly different numbers. But the New York Times, Washington Post, and CNN all agree with the estimates above, so for the moment that is what we’ll go with here.

It is clear that Cruz/Rubio/Trump are in a separate class here than Carson/Bush/Paul. But even these three would need to nearly double their performance to actually be on a track to win, because, well, you have to be getting more than half of the delegates to win outright. 25% to 30% won’t get you there. So at some point, somebody has to start going over the 50% mark if there is going to be a winner.

There is plenty of time for that of course. Nobody is predicting a contested convention quite yet, as much fun as that would be.

We probably won’t see anyone over 50% after New Hampshire either, but how close we get may depend on the viability thresholds. In New Hampshire on the Republican side you need to get 10% of the popular vote to be eligible for delegates. Although this will definitely change in response to the Iowa results, at the moment RCP has Trump at 33.2%, Cruz at 11.5%, Kasich at 11.5%, Bush at 10.3%, and Rubio at 9.5%. The rest are pretty far from 10%. But that is four candidates all within a couple percent of 10%.

Depending on which of those ends up right above or right below the 10% threshold, you could see very different delegate results coming out of New Hampshire. Most likely, we’ll have three or four candidates over 10% and a mix of delegates, but in the extreme case, if all but Trump drops under 10%, then Trump gets all the delegates. So a wide range of things is possible based on really small movements from the current positions in the polls.

Final points here though to the people saying Iowa proves that Trump is done…

  • Trump was pretty close in Iowa. A one delegate difference means almost nothing.
  • Although the Iowa results may diminish it, Trump starts with a big lead in New Hampshire.
  • Only 1.09% of the Republican delegates have been determined so far.

We have a three way race right now. It is not inconceivable that a 4th candidate could do well enough in New Hampshire to join that group. Things are just as up in the air and chaotic on the Republican side as they were before Iowa. Anything could still happen.

Stay tuned.

Note: This post is an update based on the data on ElectionGraphs.com. Election Graphs tracks both a poll based estimate of the Electoral College and a numbers based look at the Delegate Races. All of the charts and graphs seen in this post are from that site. Additional graphs, charts and raw data can be found there. All charts above are clickable to go to the current version of the detail page the chart is from, which may contain more up to date information than the snapshots on this page, which were current as of the time of this post. Follow @ElectionGraphs on Twitter or like Election Graphs on Facebook to see announcements of updates or to join the conversation. For those interested in individual general election poll updates, follow @ElecCollPolls on Twitter for all the polls as they are added.

Democrats: Sanders Iowa Tie is a Clinton Win

The Iowa caucuses have finally come and gone, and we have the first “earned” delegate results of the nomination race. Sorta. No actual Democratic delegates were actually determined. It was just the first step in a multi stage process. But as of now, estimates can be made. The estimates as per The Green Papers are 23 delegates for Clinton and 21 for Sanders. There were also 4 Iowa superdelegates already for Clinton.

So the Iowa totals as of this post are: 27 Clinton, 21 Sanders, 4 superdelegates TBD.

Even if all 4 remaining superdelegates went for Sanders, which is unlikely, Clinton still wins Iowa 27 to 25.

This despite the predominant reporting of tonight’s results as a tie or near-tie for Sanders.

In addition, since my last post on the Democrats in other states there have been 3 additional super delegates who came out for Clinton, and 2 who came out for Sanders.

So, where does that put us? First, the raw delegate totals:

chart-27

You can see the “kink” in the chart that is the result of Clinton getting a much smaller percentage of the Iowa delegates than her absolute domination in the superdelegate race. This of course means her percentage of the delegates so far takes a bit of a swoon:

chart-28

Clinton is down to only 91.55% of the delegates allocated so far! That’s the lowest she has been so far!

OK, that is down, but actually it is still pretty dominant.

But what does all this do to the critical “% of remaining delegates needed to win”?

chart-26

When I made the last blog update, Sanders needed 54.22% of remaining delegates to win. Right before tonight’s new Iowa results, that had moved to 54.23%. Adding in the Iowa results it is now… 54.30%. So up a little, but really not by much. Sanders did not do well enough to bring this percentage down. It has to actually go down for Sanders to be on a pace to catch up and win. But he at least did well enough to keep it from getting very much worse than it was.

Looking at the New Hampshire polling, Sanders is currently at 55.5% in the RCP average and 55.2% in the Pollster average. Either way, that is a smidgen above 54.30%. So even if he gets no boost in New Hampshire from his near tie with Clinton in Iowa, Sanders may meet the bar he needs in order to improve his numbers on this metric. He doesn’t have much leeway though. If he drops at all, then he essentially will fall even further behind after New Hampshire.

The states beyond New Hampshire of course look more hostile to Sanders based on early polling. To make any real race out of this, something would need to happen that would cause Clinton to not just do a little worse, but a lot worse. Otherwise, the rest of this Democratic race is just going to be a process of Clinton mopping up, no matter what sort of media hubbub results after a potential Sanders win in New Hampshire.

Note: This post is an update based on the data on ElectionGraphs.com. Election Graphs tracks both a poll based estimate of the Electoral College and a numbers based look at the Delegate Races. All of the charts and graphs seen in this post are from that site. Additional graphs, charts and raw data can be found there. All charts above are clickable to go to the current version of the detail page the chart is from, which may contain more up to date information than the snapshots on this page, which were current as of the time of this post. Follow @ElectionGraphs on Twitter or like Election Graphs on Facebook to see announcements of updates or to join the conversation. For those interested in individual general election poll updates, follow @ElecCollPolls on Twitter for all the polls as they are added.

@ElectionGraphs tweets from 2016-02-01 (UTC)

@ElecCollPolls tweets from 2016-02-01 (UTC)

  • 15:07:24 A few new superdels since my delegates post. I’m not making new post 4 that tho. If you want to see the info, look over at @ElectionGraphs.

@abulsme tweets from 2016-02-01 (UTC)