This is the website of Abulsme Noibatno Itramne (also known as Sam Minter). Posts here are rare these days. For current stuff, follow me on Mastodon

Categories

Calendar

February 2016
S M T W T F S
 123456
78910111213
14151617181920
21222324252627
2829  

Republicans: Trump dominating delegate race

To be on a pace to win, Trump needed 26 of the 50 delegates in South Carolina. Instead, he got all 50 of them. Just as this site pointed out was very likely on the 10th and again on the 11th. I’ve seen some surprise at this result in some of the commentary, but absent the polls being way off, this was predictable weeks ago.

Delegate rules matter. The popular vote is only relevant in terms of how it determines the delegates.

So Trump jumps way up in the delegate race:

chart-44

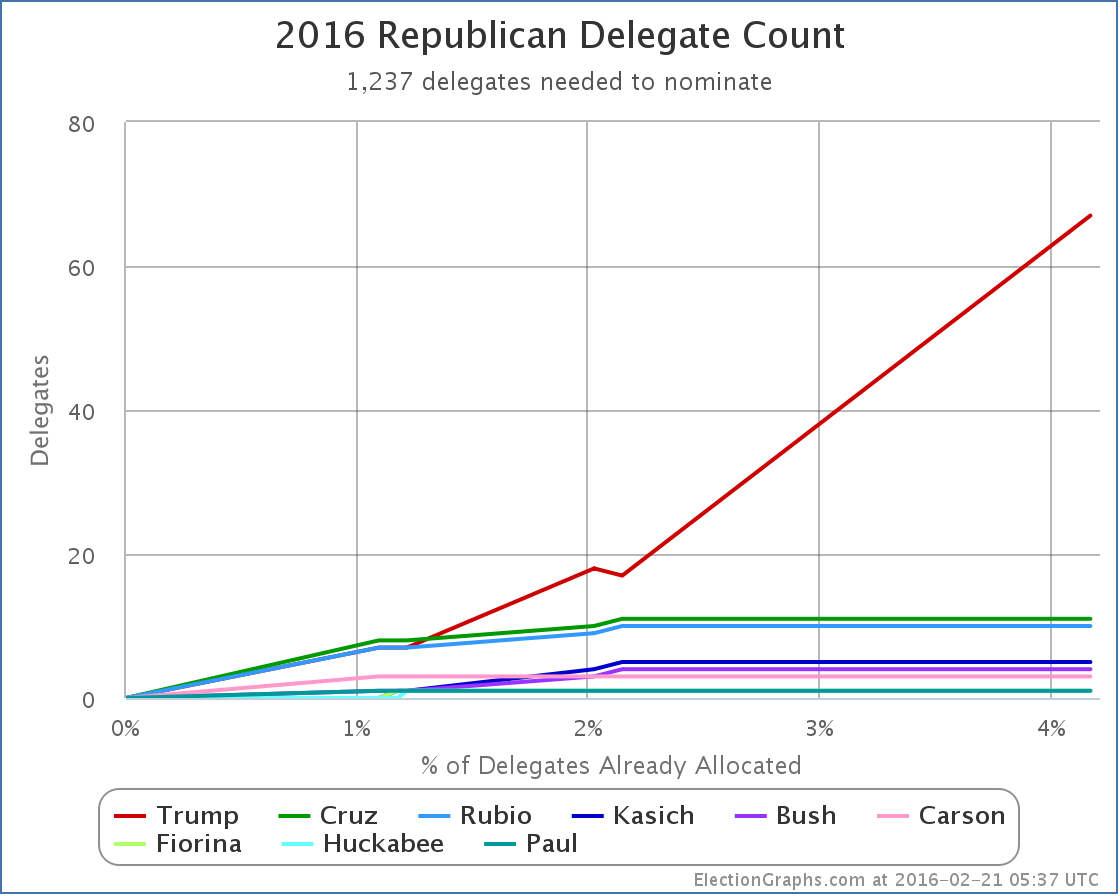
So… 67 Trump, 11 Cruz, 10 Rubio, 5 Kasich, 3 Carson, and 7 for people who have dropped out.

Lets look at this in percentage terms:

chart-45

Trump now has more than 50% of the delegates allocated so far. About 65% of them. That is just under 2/3 of the delegates.

Now, we’re only 4.2% of the way through the delegates, but at this point Trump is dominating.

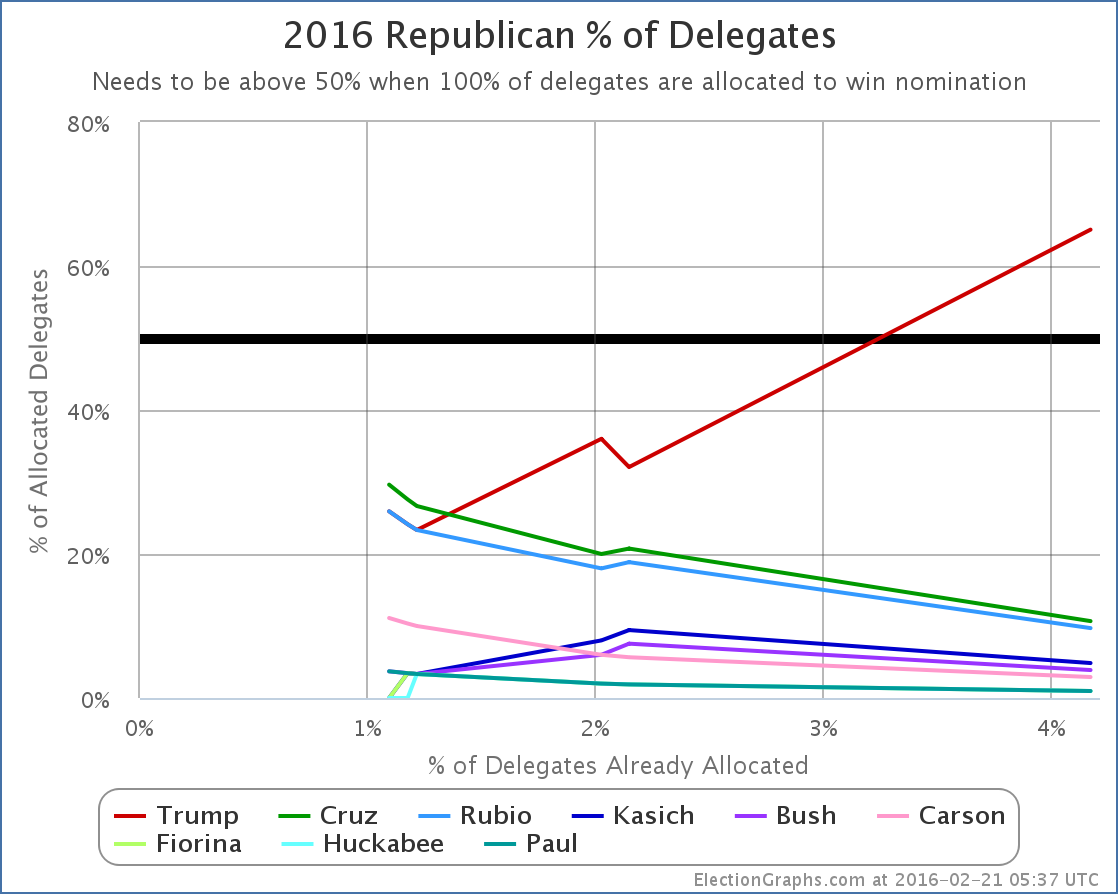
How about “% of remaining delegates needed to win”?

chart-46

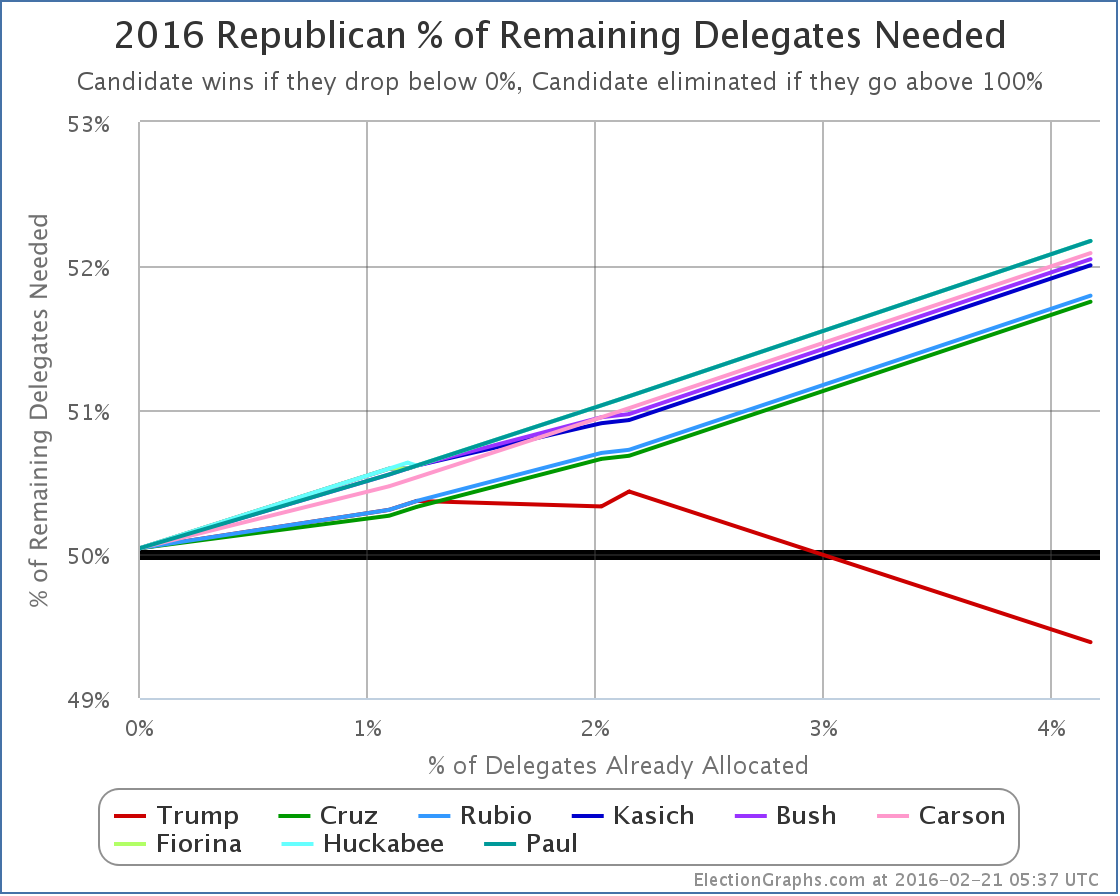
Now that he has a majority, Trump’s line dives down. (Down is good on this graph.) He now only needs 49.39% of the remaining delegates to win.

More importantly though, because of how the delegates split between his opponents, they are all just racing upward. Cruz is second right now, and he now needs 51.75% of the remaining delegates in order to win. Now, this still isn’t a crazy number, although obviously Cruz hasn’t come close to it in any contest yet. But… time is running out.

We are down to five candidates after South Carolina. It is possible we will lose more after Nevada in a couple days. But most polling and modeling I have seen says Trump wins in a five way race, in a four way race, and even in a three way race. It takes bringing it down to a two person race before the non-Trump starts winning. The question is if that happens fast enough to “Stop Trump”.

With the number of delegates determined between March 1st and March 15th, if such a move is going to happen, it has to happen very quickly. Still having 3+ candidates when the March 1st votes happen puts Trump in a very strong position. If we’re not down to 3 before March 15th, Trump may just be wrapping things up.

Or something dramatic could happen that changes everything. You never know.

For now though, polls in Nevada and the March 1st states look good for Trump, and we still have five people in the race.

Trump is on a path to victory.

Nevada is up next on Tuesday.

Note: This post is an update based on the data on ElectionGraphs.com. Election Graphs tracks both a poll based estimate of the Electoral College and a numbers based look at the Delegate Races. All of the charts and graphs seen in this post are from that site. Additional graphs, charts and raw data can be found there. All charts above are clickable to go to the current version of the detail page the chart is from, which may contain more up to date information than the snapshots on this page, which were current as of the time of this post. Follow @ElectionGraphs on Twitter or like Election Graphs on Facebook to see announcements of updates or to join the conversation. For those interested in individual general election poll updates, follow @ElecCollPolls on Twitter for all the polls as they are added.

Democrats: Clinton Wins Nevada by 20 to 15

Sanders needed to win 20 of the 35 delegates available in Nevada’s caucuses to be on a pace to catch up with Clinton and win the Democratic nomination. He did not get 20. He got 15. Clinton got 20. There was some talk from the Sanders camp about how much closer Nevada was than it looked like it would be a few weeks ago. That is true. But in the end, the result is Clinton getting 57% of the delegates while Sanders gets 42%.

So Sanders falls further behind. Lets look at the charts.

chart-42

First the straight up delegate counts. We are now at Clinton 487, Sanders 67, O’Malley 2.

In addition to the delegates from the Nevada caucuses, since my last update on the 14th when 42 superdelegates were added for Clinton there have been other updates contributing to those numbers. That includes a number of new delegates identified as being for a candidate, a couple delegates who had been identified as being for a candidate saying explicitly that they considered themselves to be neutral, a few double counting errors corrected, and even one superdelegate dying. The net result was 6 more delegates for Clinton and 2 more for Sanders. And I gave O’Malley back 2 superdelegates who despite his dropping out have not yet stated another preference. In general these changes are backdated to the date there is evidence for them, rather than being dated as of the time I find the change.

Add those all up, and since New Hampshire, Clinton’s total has increased by 68 delegates while Sanders gained 17. If you don’t count the delegates that changed before New Hampshire that I found out about after New Hampshire, it is still 30 Clinton delegates to 17 for Sanders.

Either way, Clinton continues to accumulate delegates faster than Sanders does. That is not a recipe for Sanders catching up. To catch up, Sanders needs to either be getting supermajorities of the delegates from primaries, caucuses and currently unpledged superdelegates, or he needs to be getting quite a few current Clinton superdelegates to defect. So far neither of those things have been happening.

(Note: AP and CNN have Clinton’s delegate totals even higher, presumably due to some non-public superdelegate commitments they know about but haven’t published. The above counts are mostly using superdelegate counts from Wikipedia except for a handful of cases where I have deviated for specific reasons where I believe I have a better count.)

So, how is the “% of remaining delegates needed to win” looking?

chart-43

Since Sanders has not been making his percentages, and Clinton has, Clinton’s line is slowly dropping, and Sanders’ is slowly rising. Slowly is the watchword here though. Sanders is now up to 55.03%. Right before Iowa, this was at 54.22%. (Counting the postdated delegates, 54.72%.) Sanders hasn’t done well enough that he is actually catching up with Clinton, but he has done well enough to keep the movement on this number low. He is ALMOST keeping Clinton from making progress. Almost but not quite.

As more delegates get racked up, assuming Sanders continues to collect less than 55% of the delegates, it will not only get harder and harder to catch up to Clinton, it will also get harder and harder to prevent that red line from zooming downward to zero, the point where Clinton wraps up the nomination.

For now though, while he isn’t stopping her, Sanders is clearly slowing Clinton down more than she would like.

Next up, South Carolina.

Update 2016-02-26 15:55 UTC – Completed a scan for superdelegate changes. Net result is +6 Clinton superdelegates… plus one new O’Malley superdelegate. This is not actually a NEW O’Malley superdelegate, but one that declared their support back in November but just hadn’t been logged yet, and there is not yet evidence of them stating they are now uncommitted or backing another candidate. These changes have no substantive effect on the analysis above.

Update 2016-02-28 03:24 UTC – Another scan for superdelegates in preparation for adding in South Carolina results. Net result Clinton +4, Sanders +1. This again has not substantive effect on the analysis above, but putting a note here since it is not worth a blog post of its own.

Note: This post is an update based on the data on ElectionGraphs.com. Election Graphs tracks both a poll based estimate of the Electoral College and a numbers based look at the Delegate Races. All of the charts and graphs seen in this post are from that site. Additional graphs, charts and raw data can be found there. All charts above are clickable to go to the current version of the detail page the chart is from, which may contain more up to date information than the snapshots on this page, which were current as of the time of this post. Follow @ElectionGraphs on Twitter or like Election Graphs on Facebook to see announcements of updates or to join the conversation. For those interested in individual general election poll updates, follow @ElecCollPolls on Twitter for all the polls as they are added.

Edit 17:17 UTC to add note about AP and CNN delegate counts.

@ElectionGraphs tweets from 2016-02-20 (UTC)

  • 17:21:21 [Blog Post] Electoral College: Trump takes lead from Clinton in North Carolina, Rubio even stronger https://t.co/8FggNbRZvP
  • 18:15:10 Trying to keep up with superdelegates in run up to today’s results. Added 2 more for Clinton, 1 more for Sanders.

@ElecCollPolls tweets from 2016-02-20 (UTC)

@abulsme tweets from 2016-02-20 (UTC)