This is the website of Abulsme Noibatno Itramne (also known as Sam Minter).
Posts here are rare these days. For current stuff, follow me on Mastodon
|
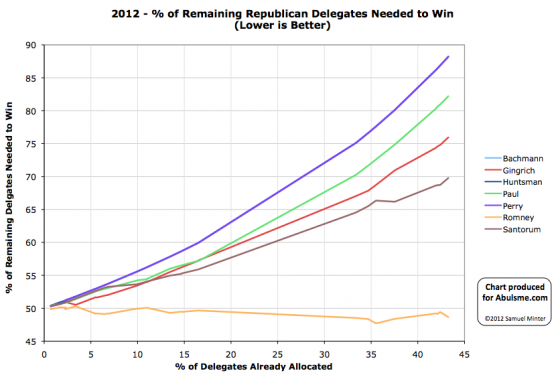
Chart from the Abulsme.com 2012 Republican Delegate Count Graphs page. When a candidate gets down to 0%, they have cinched the nomination. If they get up past 100%, they have been mathematically eliminated. Rather than the date on the x-axis, we show the “% of Delegates Already Allocated” as this better represents the progress through the race. Note that these numbers include estimates of the eventual results of multi-stage caucus processes which will be refined as the later stages occur.
So. Puerto Rico. Romney wins by a huge margin. He got more than 80% of the vote. In second place Santorum got less than 10% of the vote. 50% was the magic number though. The rules for Puerto Rico said that if the winner gets more than 50%, then the delegates are allocated winner take all. So Romney gets all 20 regular delegates from Puerto Rico. (Romney already had 2 of the 3 super delegates from Puerto Rico before tonight, with Gingrich having the remaining super delegate.)
Obviously getting 100% of today’s delegates is good for Romney, and bad for everybody else. Duh. Romney’s best position so far was still on March 10th, right after Guam and the Northern Marianas results, but before Kansas and the Virgin Islands. But he moves back toward the nomination, and away from the possibility of not getting to 1144 with this result. The others continue on their rapid path toward mathematical elimination. In terms of the magical “% of remaining delegates needed to win” number:
- Romney: 49.4% -> 48.7%
- Santorum: 68.7% -> 69.8%
- Gingrich: 74.8% -> 75.9%
- Paul: 80.9% -> 82.2%
Next up is Illinois. Romney is ahead in the polls in Illinois, but isn’t over 48.7% in those polls, and of course nobody else is close to the numbers above either. The contest there is a “Loophole Primary” which is a bit odd, but if the delegate results are even close to being proportional to the popular vote result, then we can expect Illinois to be another of the “everybody loses” states where nobody actually gets closer to the nomination in terms of being on pace to win.
Add that to Louisiana, which will almost certainly also be an “everybody loses” state and we should wrap up the March contests with basically the same situation we have right now… the 3-non Romney’s with no chance of winning, but Romney still in the zone where being blocked from 1144 is very much still within the realm of possibility.
And then we’ll have April.
One thing to watch… does Romney remain in the zone where his “% of remaining needed to win” is less than the “% of delegates so far” number. If so, then continuing at the same pace will eventually get him to 1144, just really slowly. If not, then he’ll actually not be on a winning pace, and will have to actually improve his delegate collection rate to win. (Right now Romney has 51.9% of the delegates so far, compared to needing only 48.7% of the remaining delegates to win.)
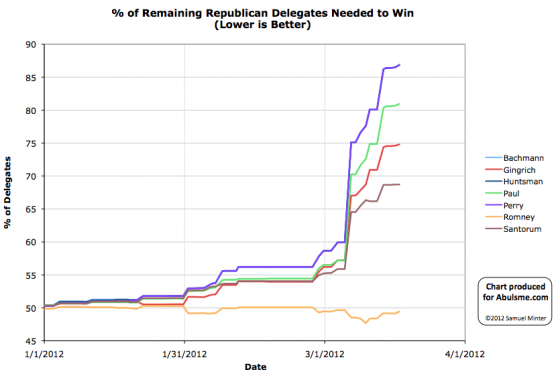
Chart from the Abulsme.com 2012 Republican Delegate Count Graphs page. When a candidate gets down to 0%, they have cinched the nomination. If they get up past 100%, they have been mathematically eliminated. Note that these numbers include estimates of the eventual results of multi-stage caucus processes which will be refined as the later stages occur.
Looks like we finally have final results for all the delegates from Alabama, and what will (maybe?) be a final update for Hawaii as well. All of this from Green Papers of course.
In Alabama we add 4 more delegates for Santorum and 2 more for Gingrich. This brings the total for non-Super delegates in Alabama to 22 Santorum, 14 Gingrich, 11 Romney. (Santorum also has one of the three superdelegates for the state, the other two haven’t endorsed yet.)
In Hawaii, the update we listed on March 15th is reversed. At that time a delegate was removed from the Paul column and given to Romney. Today that delegate appears to go back into the Paul column. This leaves Hawaii at 9 Romney, 5 Santorum, 3 Paul. So +1 Paul, -1 Romney.
So the net for today’s update: Santorum +4, Gingrich +2, Paul +1, Romney -1.
This gives changes for the “% of remaining needed to win” number as follows:
- Romney: 49.13% -> 49.43%
- Santorum: 68.71% -> 68.72%
- Gingrich: 74.60% -> 74.79%
- Paul: 80.65% -> 80.94%
Notice that everybody goes up. This is a small number of delegates of course, and pretty small changes to the numbers, but nobody here actually improved their position in terms of being able to get to 1144. Of the net 6 new delegates today, Santorum got 4. So 66.67%. Which is quite a healthy percentage. Overwhelmingly wins the day. But he would have had to have done even better to actually be on a pace to catch up with Romney. Lots of splits like this lead toward nobody getting 1144.
But this was a minor update day with a small number of delegates. We’ll see what the real contests get us over the coming week.
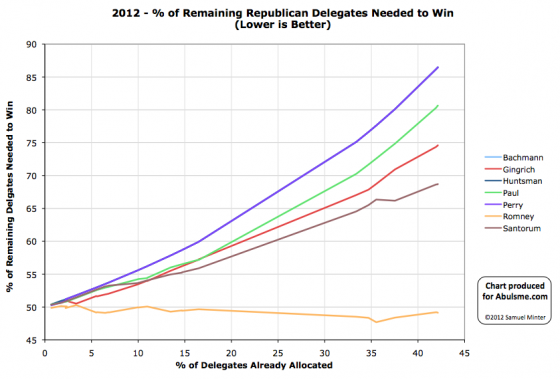
Chart from the Abulsme.com 2012 Republican Delegate Count Graphs page. When a candidate gets down to 0%, they have cinched the nomination. If they get up past 100%, they have been mathematically eliminated. Rather than the date on the x-axis, we show the “% of Delegates Already Allocated” as this better represents the progress through the race. Note that these numbers include estimates of the eventual results of multi-stage caucus processes which will be refined as the later stages occur.
Very minor update today. One new superdelegate from Indiana endorsed Romney. You can barely see the effect on the charts with a microscope. If one must look, Romney’s “% of remaining needed to win” drops from 49.17% to 49.13%. Santorum’s rises from 68.66% to 68.71%. At this stage, one delegate barely budges the numbers.
So we await Puerto Rico this weekend for the next big batch of delegates.
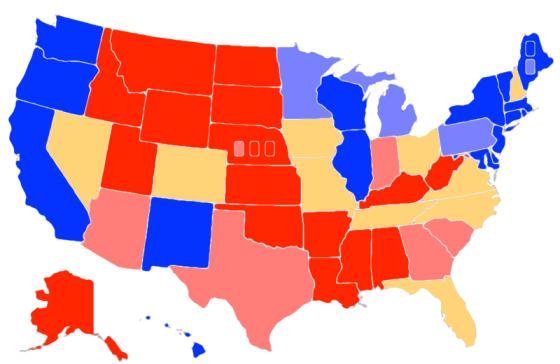
Map from the Abulsme.com 2012 Electoral College Prediction page. This map reflects Obama vs Romney. If any other candidate takes the lead in the Republican delegate race we’ll switch to making maps for them. This reflects the current state of polling, which of course will change drastically as the campaign progresses from now until November.
The latest update in my five poll averages puts Romney’s lead in Arizona over 5%, so the state moves out of the “Lean Romney” swing state status to “Weak Romney” indicating Romney’s lead is more than 5% but less than 10%. This moves Arizona out of the list of states that could easily go either way, and reduces the margin in Obama’s “Best Case” Scenario.
|
Romney |
Obama |
| Romney Best Case |
291 |
247 |
| Current Status |
210 |
328 |
| Obama Best Case |
170 |
368 |
And the trends over time…
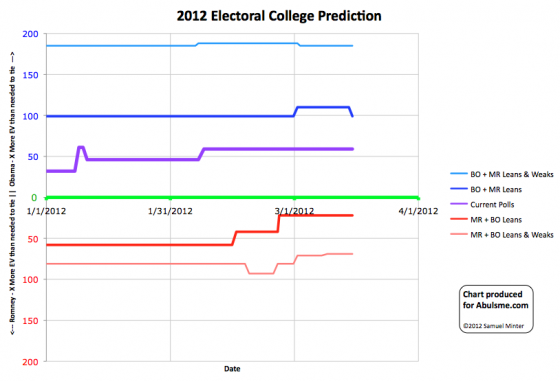
Chart from the Abulsme.com 2012 Electoral College Prediction page. Lines represent how many more electoral votes a candidate has than is needed to tie under several different scenarios. This chart reflects Obama vs Romney. Lines moving up indicate Obama’s situation improving, lines moving down indicate Romney’s situation improving. If any other candidate takes the lead in the Republican delegate race we’ll switch to making charts for them.
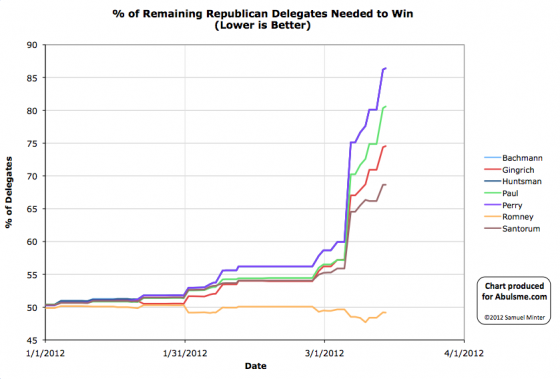
Chart from the Abulsme.com 2012 Republican Delegate Count Graphs page. When a candidate gets down to 0%, they have cinched the nomination. If they get up past 100%, they have been mathematically eliminated. Note that these numbers include estimates of the eventual results of multi-stage caucus processes which will be refined as the later stages occur.
Some minor updates today as results get finalized in the last round of states. In Alabama 3 of the 9 non-super delegates that Green Papers still had as TBD have been determined… 2 for Santorum, 1 for Romney. Meanwhile, in Hawaii the Green Papers estimate gets revised from 9 Romney, 5 Santorum, 3 Paul to 10 Romney, 5 Santorum, 2 Paul. So in Hawaii +1 for Romney, -1 for Paul.
Net for the day: +2 Romney, +2 Santorum, -1 Paul
There are still 6 non-super delegates in Alabama in the TBD category, so we haven’t heard the last from Alabama.
Since this is only a very small number of delegates, the effects are very small. In terms of “% of remaining needed to win”:
- Romney: 49.21% -> 49.17%
- Santorum: 68.65% -> 68.66%
- Gingrich: 74.38% -> 74.55%
- Paul: 80.33% -> 80.59%
Obviously this changes nothing at all about the analysis of the state of the race that was presented yesterday.
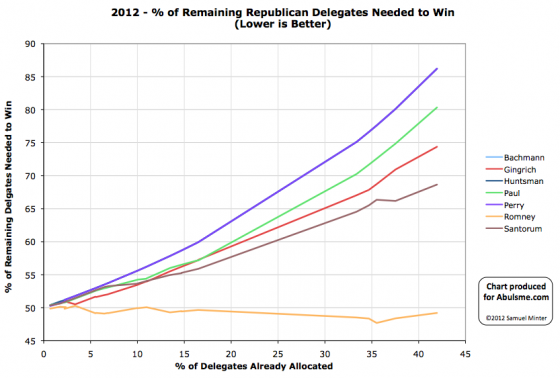
Chart from the Abulsme.com 2012 Republican Delegate Count Graphs page. When a candidate gets down to 0%, they have cinched the nomination. If they get up past 100%, they have been mathematically eliminated. Rather than the date on the x-axis, we show the “% of Delegates Already Allocated” as this better represents the progress through the race. Note that these numbers include estimates of the eventual results of multi-stage caucus processes which will be refined as the later stages occur.
OK, bottom line here… this is not the big win for Santorum that many people are crowing about this morning. He didn’t come close to the numbers he would need to be able to catch up and get to 1144. He didn’t even get the most delegates today. Romney did. But this was also not a win for Romney. As many anticipated, he did not get the percentages of delegates he needed to stay on pace for 1144 and fell back a bit, keeping the possibility of the non-Romney’s preventing Romney from getting to 1144 alive.
OK, now lets hit the details. The states with updates today:
- Alabama: +16 Santorum, +12 Gingrich, +10 Romney (9 regular delegates and 2 super delegates still TBD)
- Mississippi: +13 Santorum, +12 Romney, +12 Gingrich (2 super delegates still TBD)
- Hawaii: +9 Romney, +5 Santorum, +3 Paul (3 super delegates still TBD)
- American Samoa: +9 Romney
- Georgia: +2 Gingrich, -2 Romney (Revision to Georgia results based on updated computations)
So, total for the day: Romney +38, Santorum +34, Gingrich+26, Paul +3
Before anything else, lets just point out again… Romney got the most delegates today. Romney was ahead when this started. So Romney increased his lead today. How is this a win for Santorum? (The answer of course is the spin that gets put on things… which could in turn affect what happens in the next few states… but in the end it will come down to the cold hard numbers… )
So, for Romney going into today, to maintain his pace toward 1144, he needed to get 48.4% of the delegates. Did he manage that? 38/101 = 37.6%. No. He fell short by a significant margin. This WAS a bad day for Romney, no way to disguise it. His “% of remaining needed to win” rises to 49.2%. So far he has 51.2% of the delegates according to the count we use (GreenPapers Soft Count), so if he just continues at that pace he WILL get to 1144… eventually. But this remains in the zone where Romney is vulnerable to be stopped. So far the collective non-Romney’s have managed to get 48.8% of the delegates. They only have to up their game a little bit… such that collectively they are managing 50.8%… to be able to block Romney. This is obviously NOT where Romney would like to be. He wants to be at the point where his “% needed to win” keeps dropping toward zero. But that just isn’t happening yet, and if Santorum gains “momentum” out of his Alabama and Mississippi wins, then it may yet be awhile. If Romney slips under the mark of “50% of the delegates awarded so far” in the next few contests, expect the talk of brokered conventions to accelerate rapidly.
How about Santorum? Well, despite the positive headlines, in terms of actually winning the nomination, despite his wins in two states, today was not good for him. Coming into this round, he needed to be getting 66.2% of the delegates to be on a pace to catch up and win. He got 34/101=33.7% which is nowhere even close. As a result, his “% needed to win” rises dramatically to 68.7%. This is essentially an impossible number as long as all four candidates continue to get support. Even if Gingrich and Paul drop out, this would be an insane winning margin in a two man race. Not going to happen. The only scenarios where Santorum starts to get close are ones where Gingrich and Paul not only drop out, but their delegates en masse and unanimously jump over to Santorum. This would drop Santorum’s “% needed to win” to the 50.8% needed for the non-Romney’s mentioned above. That isn’t going to happen either though.
The situation is of course even worse for Gingrich and Paul. All three of these guys are racing toward mathematical elimination. So the only interesting scenario remains if the three of them collectively can get enough delegates to stop Romney from getting to 1144. The three candidates at this point have all but admitted this. As we have mentioned before, this scenario relies on the three of them being able to continue getting delegates… and getting them at a higher rate than they have so far… even though it is impossible for any of them to individually win. This is still in the realm of the possible though. They have to win the spin war by winning states, even if not by enough delegates to catch up, pushing things explicitly as “Stop Romney”, etc. By all reports the rest of March is still marginal for Romney. If Santorum gains some momentum from states like Alabama and Mississippi and can push hard on the “We must stop Romney” angle, wins some more states in March and then starts driving down Romney support in post-March states, then this remains very much on the table. And then of course the idea is, if it actually goes to the convention undecided, then anything can happen.
Fundamentally the basic analysis of where we are remains the same as it has been since Super Tuesday, and arguably since Florida… or even since Iowa… namely, the non-Romney’s get further away from the nomination with almost every contest (the only exceptions so far being South Carolina and Kansas). Meanwhile Romney continues to hover in the zone where if he continues exactly how he has been going he will win EVENTUALLY, but it will take a long time, and if his opponents collectively improve their performance just a LITTLE BIT, they could block him and force some convention drama.
Edit 2012 Mar 13 18:11 UTC to correct one place where I had incorrectly said Romney when I actually meant Gingrich. Thanks Paolo for pointing it out.
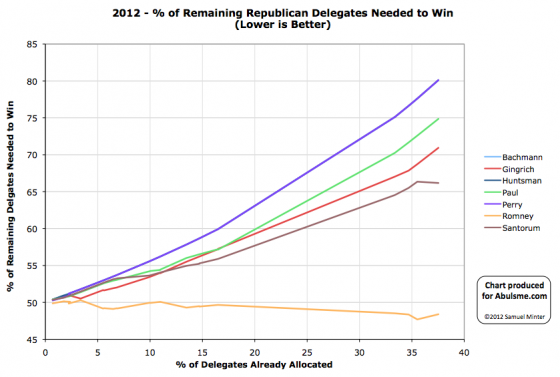
Chart from the Abulsme.com 2012 Republican Delegate Count Graphs page. When a candidate gets down to 0%, they have cinched the nomination. If they get up past 100%, they have been mathematically eliminated. Rather than the date on the x-axis, we show the “% of Delegates Already Allocated” as this better represents the progress through the race. Note that these numbers include estimates of the eventual results of multi-stage caucus processes which will be refined as the later stages occur.
For the first time since Gingrich won South Carolina, someone other than Romney ends up improving their overall position after a day with results from major contests. Yes, Santorum actually pulled one out!
In Kansas Santorum won 33 delegates to Romney’s 7. In the Virgin Islands, Romney won 4 delegates, Paul won 1. Romney also picked up one additional superdelegate from the Virgin Islands. This makes the totals for the day: Santorum 33, Romney 12, Paul 1.
In order to be on a pace to catch up and get to 1144, Santorum needed 66.4% of the delegates. With 33/46 he manages 71.7% of today’s delegates. This means his “% of remaining needed to win” drops to 66.2% for the next set of contests on Tuesday.
So not only does Santorum win the day, he wins the day by a big enough margin to be on pace to win! Well, we would be if he did this every single time there was a contest, which won’t happen, but hey, today, he did it today! (Note: If you counted the two Pacific Island contests that I gave the results of yesterday as if they were all on the same day as Kansas and the Virgin Islands, Santorum would no longer be up for the day.)
Meanwhile, all of the other candidates of course moved backwards, including Romney. Romney moves from needing 47.7% of the remaining delegates to needing 48.4% of the remaining delegates. He will be hard pressed to make this margin in Tuesday’s deep South contests, so expect that he may move backwards some more before moving toward the nomination again, but he is still in the commanding position in this race. Nobody else is even close. He is the only one with a path to 1144. (Prospects for the non-Romney’s to block remain possible however, although the non-Romney’s have to pick up the collective delegate getting pace to make that happen, rather than fading as their chances of winning individually rapidly go to zero.)
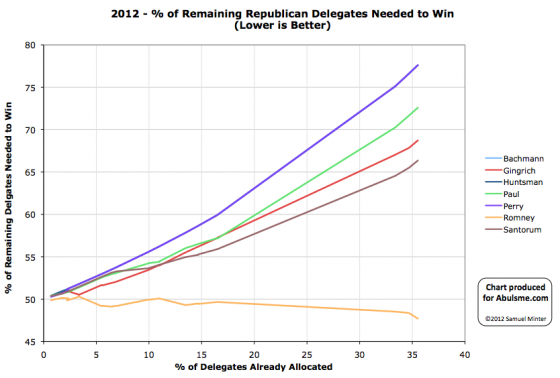
Chart from the Abulsme.com 2012 Republican Delegate Count Graphs page. When a candidate gets down to 0%, they have cinched the nomination. If they get up past 100%, they have been mathematically eliminated. Rather than the date on the x-axis, we show the “% of Delegates Already Allocated” as this better represents the progress through the race. Note that these numbers include estimates of the eventual results of multi-stage caucus processes which will be refined as the later stages occur.
This is the kind of day the not-Romneys wish wouldn’t happen. It is the kind of day that starts taking even the possibility of keeping Romney from getting to 1144 off the table. It highlights Romney’s superior organization and money by letting him get delegates somewhere the others probably hadn’t even thought of competing.
Neither Guam nor the Northern Mariana Islands were technically winner take all. There had been no polling at all. But when all was said and done, support for Romney here was overwhelming (actually unanimous in the small Guam Caucus) and it ended up effectively winner take all. Officially the delegates from these contests are supposed to be uncommitted, but in both locations, the result was made clear. Out of these two locations Romney gets 12 regular delegates. Also 6 super delegates from these locations also are now in the Romney column. Plus, one super delegate from the Virgin Islands also came out for Romney. That makes Romney’s take for the day a 19 delegate gain, while all other candidates were shut out completely.
So Romney’s “% of remaining needed to win” drops from 48.4% to 47.7%. Meanwhile Santorum as the closest competition goes from needing 65.5% to needing 66.4%. Santorum and the others continue to race toward mathematical elimination with each contest. Romney isn’t “racing” toward cinching the nomination yet, but he is making steady progress in that direction now. Some of the Southern states coming up may slow or reverse that process in the short term, but it getting increasingly hard to game out scenarios where Romney does not eventually get to 1144. It is just a question of how long it takes.
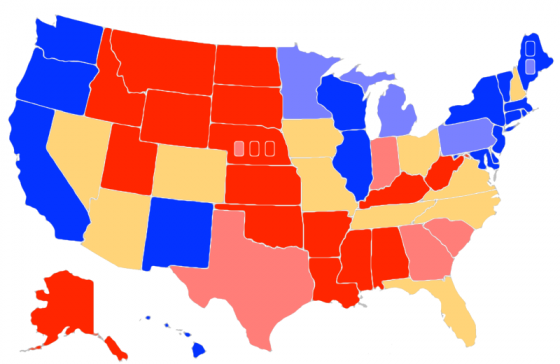
Map from the Abulsme.com 2012 Electoral College Prediction page. This map reflects Obama vs Romney. If any other candidate takes the lead in the Republican delegate race we’ll switch to making maps for them.
So the latest poll in Maine (the first since October) puts our “last five poll average” up an Obama lead of 12.1%, so the state moves from our light blue color (indicating a 5% to 10% lead) to dark blue (indicating a lead over 10%). Obama won Maine in 2008 by over 17%, so this isn’t a huge surprise.
This is for the whole state though. Maine is one of two states (the other is Nebraska) that allocate some of their electoral votes based on the state wide vote, but some of them by the winners in each congressional district. We have no polling yet for the individual congressional districts in Maine, so they are colored in by the average of the results in 2004 and 2008. So we classify ME-1 as Strong Obama (lead over 10%) and ME-2 as Weak Obama (lead between 5% and 10%).
In practice these states have almost never split their vote, but it does happen sometimes… Nebraska split its vote in 2008… so we have to allow for the possibility in our model.
Since this change does not effect a swing state, our summary remains the same:
|
Romney |
Obama |
| Romney Best Case |
291 |
247 |
| Current Status |
210 |
328 |
| Obama Best Case |
159 |
379 |
And our chart over time…
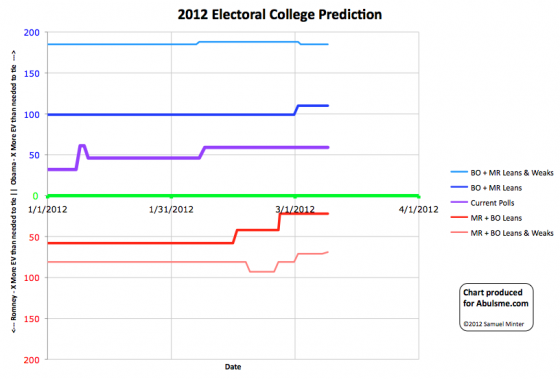
Chart from the Abulsme.com 2012 Electoral College Prediction page.
In the last month there have been 8 state category changes. 6 of them have gone in Obama’s direction. It will be awhile until the state by state polls are frequent enough and in enough states to be quickly responsive to the state of the race, but from the polling we do have, it is apparent that the continuing Republican primary battle seems to be slowly but surely weakening Romney’s hand against Obama. The expectation is that once Romney can pivot to the general election, he’ll be able to start trying to reverse that tide. But until then, he seems to just continue to lose ground.
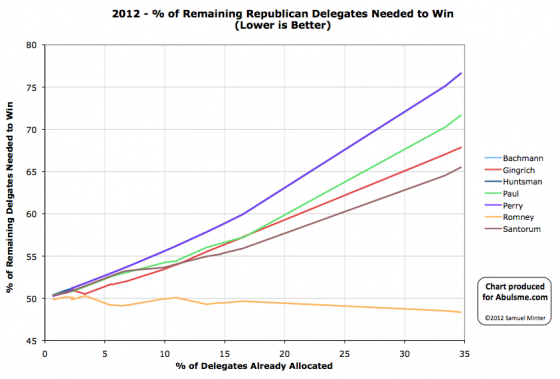
Chart from the Abulsme.com 2012 Republican Delegate Count Graphs page. When a candidate gets down to 0%, they have cinched the nomination. If they get up past 100%, they have been mathematically eliminated. Rather than the date on the x-axis, we show the “% of Delegates Already Allocated” as this better represents the progress through the race. Note that these numbers include estimates of the eventual results of multi-stage caucus processes which will be refined as the later stages occur.
So it appears that the last 34 delegates from Super Tuesday, a handful each from Georgia, Ohio and Tennessee, have been determined. 17 more to Romney, 8 more to Gingrich and 5 more to Santorum. But wait, that is only 30! Well, according to Green Papers, 4 of the 63 delegates that were up for grabs in Ohio end up officially “Uncommitted”, which (I think) means we won’t actually know which way they may go until we know which actual human beings end up being those delegates and those people say publicly who they plan on supporting (which they may or may not actually do before the convention).
All in all, today’s results are once again a win for Romney. He got 56.7% of today’s delegates, which was way more than the 48.5% he needed to continue to move closer to the nomination rather than further way. His “% of remaining needed to win” drops now to 48.4%. For the other candidates, the effect on the other side is more dramatic. Santorum is still in 2nd place, but his “% of remaining needed to win” moves up from 64.5% to 65.5%. Romney may not yet be rapidly moving toward cinching the nomination, but the non-Romneys are rapidly moving toward being mathematically eliminated.
Looking at the non-Romney’s for a minute, the next few states are expected to favor them. Perhaps Santorum will win some. Perhaps Gingrich will win some. But to actually be on a pace to win, Santorum has to not just win a state, but win by a huge margin, getting more than 65.5% of the delegates. For Gingrich it is even worse, he would need to win getting 67.8% of the delegates. (For completeness, Paul would need to get more than 71.7%.)
Even with Romney expected to not be strong in these states, with four candidates in the race, you don’t expect anybody to be able to pull that kind of level except in winner take all (or winner take almost-all) states. Of the next few coming up… in Kansas, Guam, Northern Marianas, Virgin Islands, Alabama, Mississippi, Hawaii and American Samoa there are as usual complicated delegate rules (and the territories might only select uncommitted delegates), but none of them are straight up winner takes all. (Some allow for certain situations that could lead there though.) Bottom line, 65.5% (or more) is a pretty big ask and seems unlikely.
Which means that even if Santorum or Gingrich win some states (as expected) in terms of delegates they will almost certainly still both be heading closer to mathematical elimination rather than closer to the nomination. The big thing to look at will once again be looking at how well the non-Romney’s collectively block Romney from getting the 48.4% of the delegates he needs to be closing in on the nomination himself. With strong performance by the non-Romney’s in the next few contests, they may well be able to achieve this, even if they don’t actually help themselves individually.
|
|


