On this week’s Curmudgeon’s Corner, Sam and Ivan talk about the Alabama Senate results, possible bias in the Mueller investigation, the Republican Tax Bill, Net Neutrality, Trump’s judicial nominations, and the Patreon fee structure misfire. Plus Ivan makes fun of Sam’s speech, and Sam’s son Alex pipes up a few times.
Click below to listen and subscribe!
1-Click Subscribe in iTunes View Podcast in iTunes View Raw Podcast Feed Download MP3 File Follow the podcast on Facebook Support us on Patreon
Show Details:
Recorded 2017-12-15
Length this week – 1:37:02
(0:00:15-0:03:39) But First
(0:05:21-0:30:41) Alabama
(0:32:42-0:53:09) Mueller Bias
(0:53:49-1:06:59) Tax Bill
(1:08:46-1:18:13) Net Neutrality
(1:18:51-1:24:01) Judicial Nominations
(1:24:41-1:36:42) Patreon Misfire
The Curmudgeon’s Corner theme music is generously provided by Ray Lynch.
Once again the headline out of a state is Trump winning. In Nevada the delegate count was:
14 Trump, 7 Rubio, 6 Cruz, 2 Carson, 1 Kasich
To be on the glide path for a 1st ballot victory though, Trump needed 15 of the 30 delegates. So he fell slightly short.
Now, don’t misunderstand. This is still an impressive victory, and looking at the upcoming states he has a clearer path to victory than anybody else. His margins were higher in Nevada than many people expected. But if today’s performance was replicated in all of the other states, Trump would come to the convention with more delegates than anybody else, but not the majority needed to win outright. Of course as we continue more people will drop out, and the amount with which states give bonuses to the winners increases, so that still seems like an unlikely final outcome.
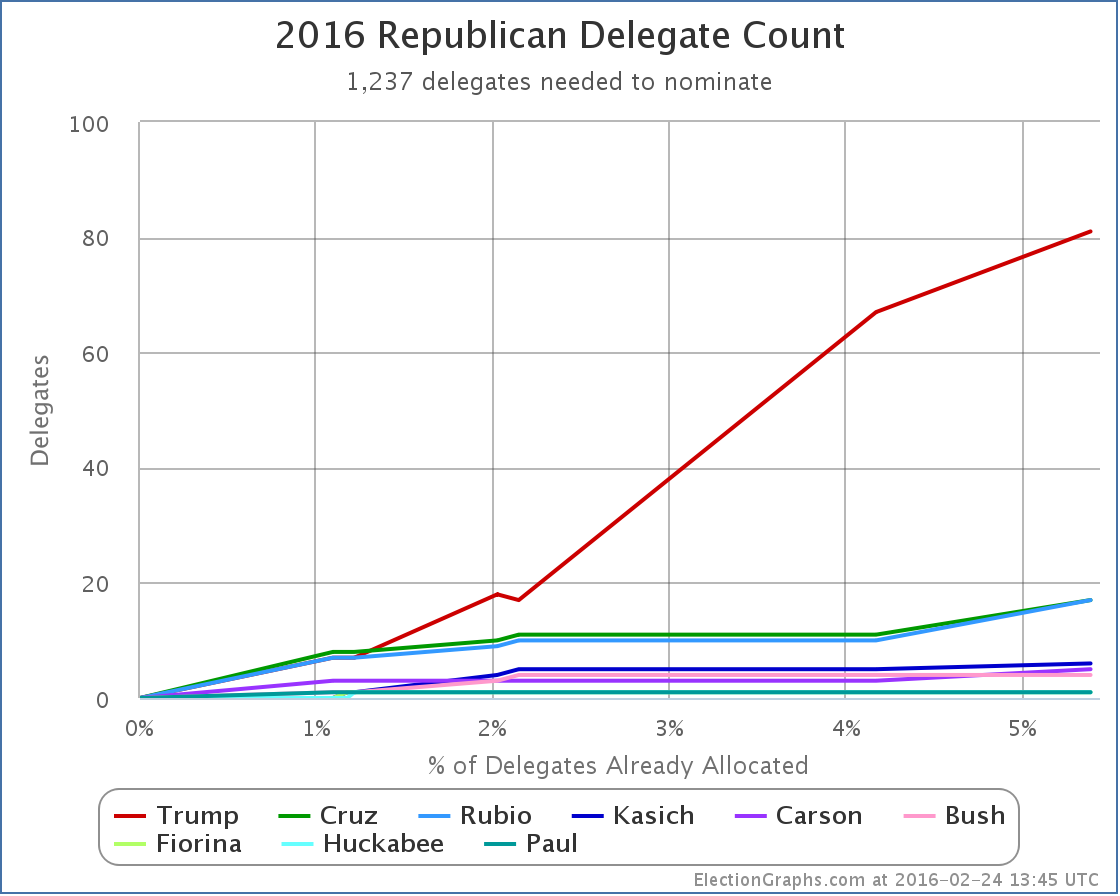
Right now Trump continues to do everything he needs to do to win. Lets look at some of the graphs, then we’ll do a quick look at the March 1st “Super Tuesday” states.
The overall delegate count is now:
81 Trump, 17 Cruz, 17 Rubio, 6 Kasich, 5 Carson, and 7 for people who have dropped out
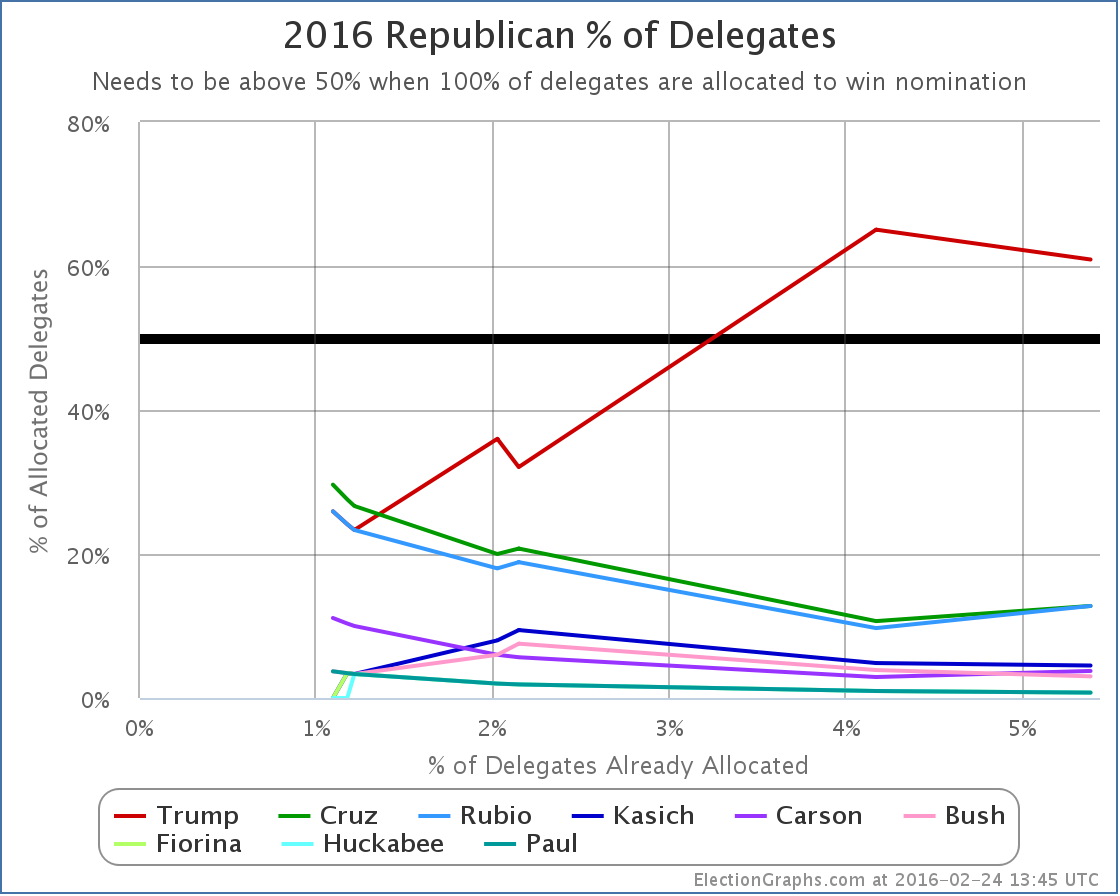
Trump continues to dominate. Lets look at this as percentages:
The “winners” here were actually Cruz, Rubio and Carson. Each of them improved their proportion of delegates with Nevada’s results. Trump actually went down. He doesn’t have to worry too much about that though. He still has a majority of the delegates allocated so far, and he is far far ahead of any of his opponents.
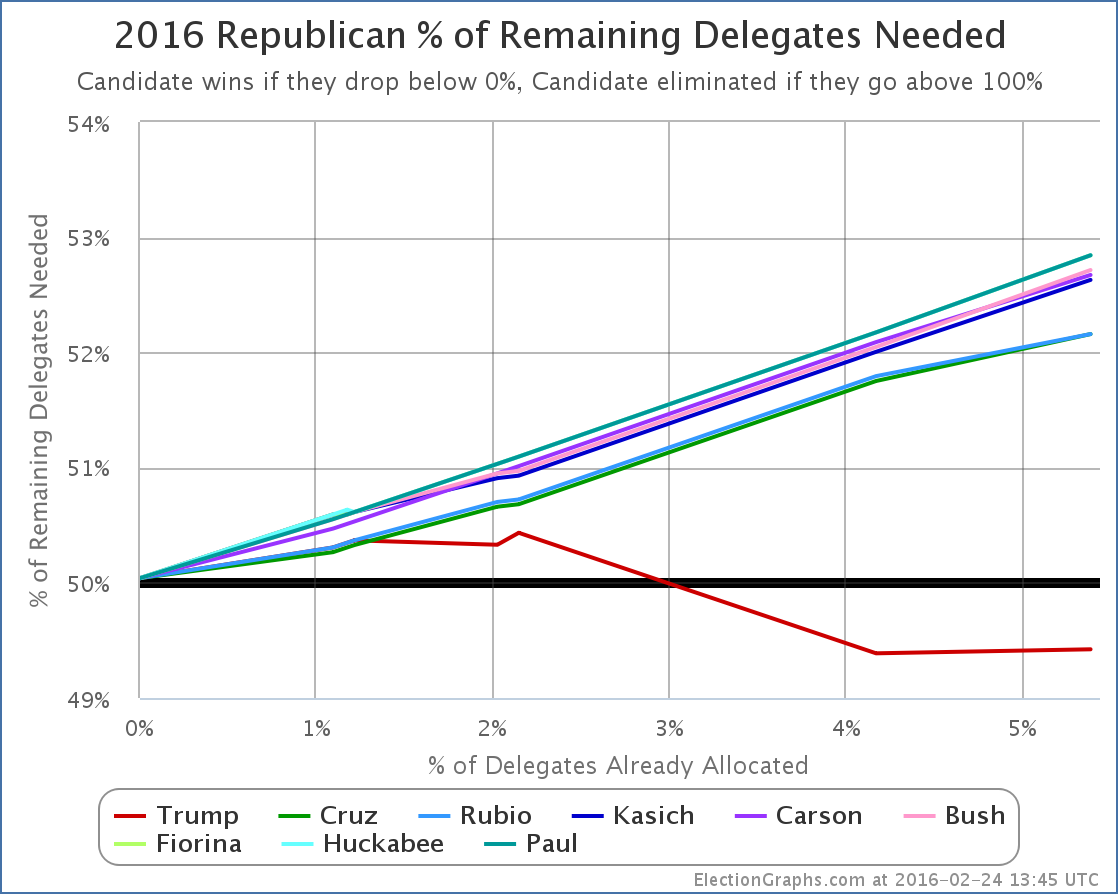
Finally, lets look at the “% of remaining delegates needed to win”, which I argue is the single most important thing to look at to understand where the race really is:
Because Trump got 14 delegates instead of 15 delegates, his line goes up a little bit. (Remember, on this chart down is good, up is bad.) The red line goes from needing 49.39% of the remaining delegates to needing 49.42%. This is a relatively trivial difference though. It is basically flat. Trump’s situation is very close to unchanged.
Meanwhile, the other lines keep going up at a decent pace. Kasich and Carson add about 0.6% to their numbers. Cruz and Rubio add about 0.4%.
This should be obvious, but the more they lose, the harder it is to catch up.
Many people are still talking about how as consolidation happens, the remaining non-Trumps will do better and the picture will change. Maybe, but nobody new announced they were dropping out after the Nevada results (yet anyway). So it looks like we may still go into March 1st with a five person race.
Lets run a hypothetical using current polling on the Super Tuesday states and see where we end up using RCP poll averages for the five remaining candidates. We’ll make delegate estimates based on the specific delegate allocation rules in each state.
That gives Trump 47.1% of the super Tuesday delegates, Cruz 39.4%, and everyone else much less.
Trump needs 49.4% of the delegates to be on the path to an outright win though! So 47.1% would be in the realm where heading to a contested convention might be possible! Still unlikely, as the additional states in March will add up fast, and more candidates are likely to drop out. Still though, possible!
Adding in the existing delegates, we’d have a post-Super Tuesday race that looks like this:
375 Trump, 263 Cruz, 84 Rubio, 17 Kasich, 11 Carson, 7 for candidates who have already dropped out
Now, these are estimates based on current polling, and very few of these states were well polled as of this post, so much of the above is based on one or two polls, or using the national averages rather than state polls. And I had to make the assumption that all congressional districts would mirror state results (which is unlikely to be true). And Wyoming actually elects individual delegates rather than doing things based on candidate preference, so it may be an oddball in the end. And of course things are likely to change further before people actually vote next Tuesday. But… the general outlines of this aren’t likely to be too far off.
If this is even remotely close to where we are on March 2nd, we end up with Trump very close to the 50% of delegate mark. (The above has him EXACTLY at that mark.) He would need just a LITTLE bit more to actually push him over the edge to a clean win.
The flip side of that though is the combination of all the anti-Trumps would need just a LITTLE bit more in order to have this be on the path to a contested convention. I mentioned earlier that this is still an unlikely outcome. It is. After March 1st, the disproportionality of delegates given to the winner increases, and after March 15th we have pure winner take all states as well. If Trump remains in the overall lead, even with a plurality, then that is all it takes to push him over the edge.
If the anti-Trumps want to have any hope here at all, they need to be in a position by mid-March that they can win not just a few, but many states of the winner-take-most and winner-take-all variety. And frankly, the most likely scenario even then is just forcing a contested convention where Trump still has the most delegates, not someone else winning outright.
The anti-Trumps would have a hard road to get to an outright win. Cruz would need 56.8% of the remaining delegates to catch up and win after March 1st if things played out like my estimates above.
If you had to make a guess based on what we know now, a Trump nomination is far more likely than any other… and with an outright delegate majority on the first ballot, not after a contested convention.
6 days until Super Tuesday. We’ll see how close my estimates above turn out to be.
Update 2016-02-26 07:17 UTC – On February 22nd New Hampshire certified the results of their primary. In the final tally Trump had one more delegate than previous estimates, and Rubio one less. This did not seem worthy of a separate post, but a note here seemed appropriate. The totals on ElectionGraphs.com have been updates appropriately. This does not substantively change any of the analysis above.
Note: This post is an update based on the data on ElectionGraphs.com. Election Graphs tracks both a poll based estimate of the Electoral College and a numbers based look at the Delegate Races. All of the charts and graphs seen in this post are from that site. Additional graphs, charts and raw data can be found there. All charts above are clickable to go to the current version of the detail page the chart is from, which may contain more up to date information than the snapshots on this page, which were current as of the time of this post. Follow @ElectionGraphs on Twitter or like Election Graphs on Facebook to see announcements of updates or to join the conversation. For those interested in individual general election poll updates, follow @ElecCollPolls on Twitter for all the polls as they are added.
[Edit 16:28 UTC to correct math on % of remaining Cruz would need after Super Tuesday, I’d originally shown a higher number around 61%.]
[Edit 2016-02-27 17:06 UTC to fix place where Kasich had been autocorrected to Quash.]
[Edit 2016-02-28 22:03 UTC to add dropped out candidates to the after Super Tuesday estimate.]
Charts from the Abulsme.com 2012 Republican Delegate Count Graphs page. When a candidate gets down to 0%, they have clinched the nomination. If they get above 100%, they have been mathematically eliminated. The first chart is by date, the second is by “% of Delegates Already Allocated”. These numbers include estimates of the eventual results of multi-stage caucus processes which will be refined as the later stages occur.
You may have heard reports of a big Ron Paul win in Nevada this weekend. Ron Paul supporters win 22 of the 25 delegate spots in Nevada and all that. Well, yes. True. However, in Nevada the delegates are still bound on the first ballot at the convention to vote proportionately to the caucus results, and the delegates can be removed and replaced if they attempt to do something different. So the slate of delegates elected in Nevada doesn’t actually change the delegate counts. Something else does however. According to Green Papers the delegates will be awarded proportionally between the candidates still actively in the race, so by suspending their campaigns Santorum and Gingrich lose their delegates and those delegates get reallocated. So the previous estimated allocation in Nevada had been: Romney 14, Gingrich 6, Paul 5, Santorum 3. This now becomes: Romney 20, Paul 8. So net from Nevada for today: Romney +6, Paul +3, Santorum -3, Gingrich -6.
Meanwhile, Romney picks up two more supers, one from Alabama and one from Arkansas.
So for the day: Romney +8, Paul +3, Santorum -3, Gingrich -6. So of course Romney continues to walk toward the nomination, despite some delegate gains for Paul as well.
Wait, but what about Maine? Paul won there over the weekend too, right? Yes. It looks that way. But Green Papers hasn’t updated their “soft count” for Maine yet. I’m sure they will soon. When they do, we’ll update here too.
In any case, for now, in terms of “% of remaining needed to win”:
Romney: 29.6% -> 28.8%
Santorum: 96.5% -> 97.1%
Despite winning some delegates, Paul’s “% of remaining needed to win” remains significantly higher than 100% at 114.4%. The delegates he is accumulating right now are not anywhere near enough to catch up and win… or even to block Romney in combination with Santorum and Gingrich delegates. Sorry. They may let him cause the convention not to go quite the way the Romney folks would like due to some unscripted deviations from the plan, but it won’t be anywhere near what would be needed to actually derail Romney.
Charts from the Abulsme.com 2012 Republican Delegate Count Graphs page. When a candidate gets down to 0%, they have clinched the nomination. If they get above 100%, they have been mathematically eliminated. The first chart is by date, the second is by “% of Delegates Already Allocated”. These numbers include estimates of the eventual results of multi-stage caucus processes which will be refined as the later stages occur.
If you remember, in Ohio Santorum did not file all the right paperwork to have actual human delegates designated to fill the slots he might win in some parts of the state. There were four delegate positions that Santorum won, but wasn’t going to be able to claim because of that. Well, it looks like the Romney folks decided to be nice and not challenge Santorum’s ability to retroactively fill those four delegate slots. So Santorum will get those four delegates after all. So Santorum +4 in Ohio.
Meanwhile, DCW adjusts their Superdelegate Count. One Alabama super switches from Santorum to Romney. And then Romney gains two more previously undeclared supers, one from Alabama and one from South Dakota.
Net for the day, Romney +3, Santorum +3. At 50%, this is of course well over the 29.7% of the delegates Romney needs to be tracking to in order to clinch the nomination.
Charts from the Abulsme.com 2012 Republican Delegate Count Graphs page. When a candidate gets down to 0%, they have clinched the nomination. If they get above 100%, they have been mathematically eliminated. The first chart is by date, the second is by “% of Delegates Already Allocated”. These numbers include estimates of the eventual results of multi-stage caucus processes which will be refined as the later stages occur.
A couple minor updates today as we continue through the slow period before we have NY/PA/CT/RI/DE next week.
The totals for Alabama get updated from Santorum 23, Gingrich 14, Romney 11, 2 TBD to Santorum 23, Gingrich 13, Romney 12, 2 TBD. This apparently after resolving a dispute on the results in the 7th congressional district. So Romney +1, Gingrich -1.
Chart from the Abulsme.com 2012 Republican Delegate Count Graphs page. When a candidate gets down to 0%, they have cinched the nomination. If they get up past 100%, they have been mathematically eliminated. Note that these numbers include estimates of the eventual results of multi-stage caucus processes which will be refined as the later stages occur.
Some minor updates today as results get finalized in the last round of states. In Alabama 3 of the 9 non-super delegates that Green Papers still had as TBD have been determined… 2 for Santorum, 1 for Romney. Meanwhile, in Hawaii the Green Papers estimate gets revised from 9 Romney, 5 Santorum, 3 Paul to 10 Romney, 5 Santorum, 2 Paul. So in Hawaii +1 for Romney, -1 for Paul.
Net for the day: +2 Romney, +2 Santorum, -1 Paul
There are still 6 non-super delegates in Alabama in the TBD category, so we haven’t heard the last from Alabama.
Since this is only a very small number of delegates, the effects are very small. In terms of “% of remaining needed to win”:
Romney: 49.21% -> 49.17%
Santorum: 68.65% -> 68.66%
Gingrich: 74.38% -> 74.55%
Paul: 80.33% -> 80.59%
Obviously this changes nothing at all about the analysis of the state of the race that was presented yesterday.
Chart from the Abulsme.com 2012 Republican Delegate Count Graphs page. When a candidate gets down to 0%, they have cinched the nomination. If they get up past 100%, they have been mathematically eliminated. Rather than the date on the x-axis, we show the “% of Delegates Already Allocated” as this better represents the progress through the race. Note that these numbers include estimates of the eventual results of multi-stage caucus processes which will be refined as the later stages occur.
OK, bottom line here… this is not the big win for Santorum that many people are crowing about this morning. He didn’t come close to the numbers he would need to be able to catch up and get to 1144. He didn’t even get the most delegates today. Romney did. But this was also not a win for Romney. As many anticipated, he did not get the percentages of delegates he needed to stay on pace for 1144 and fell back a bit, keeping the possibility of the non-Romney’s preventing Romney from getting to 1144 alive.
OK, now lets hit the details. The states with updates today:
Alabama: +16 Santorum, +12 Gingrich, +10 Romney (9 regular delegates and 2 super delegates still TBD)
Mississippi: +13 Santorum, +12 Romney, +12 Gingrich (2 super delegates still TBD)
Hawaii: +9 Romney, +5 Santorum, +3 Paul (3 super delegates still TBD)
American Samoa: +9 Romney
Georgia: +2 Gingrich, -2 Romney (Revision to Georgia results based on updated computations)
So, total for the day: Romney +38, Santorum +34, Gingrich+26, Paul +3
Before anything else, lets just point out again… Romney got the most delegates today. Romney was ahead when this started. So Romney increased his lead today. How is this a win for Santorum? (The answer of course is the spin that gets put on things… which could in turn affect what happens in the next few states… but in the end it will come down to the cold hard numbers… )
So, for Romney going into today, to maintain his pace toward 1144, he needed to get 48.4% of the delegates. Did he manage that? 38/101 = 37.6%. No. He fell short by a significant margin. This WAS a bad day for Romney, no way to disguise it. His “% of remaining needed to win” rises to 49.2%. So far he has 51.2% of the delegates according to the count we use (GreenPapers Soft Count), so if he just continues at that pace he WILL get to 1144… eventually. But this remains in the zone where Romney is vulnerable to be stopped. So far the collective non-Romney’s have managed to get 48.8% of the delegates. They only have to up their game a little bit… such that collectively they are managing 50.8%… to be able to block Romney. This is obviously NOT where Romney would like to be. He wants to be at the point where his “% needed to win” keeps dropping toward zero. But that just isn’t happening yet, and if Santorum gains “momentum” out of his Alabama and Mississippi wins, then it may yet be awhile. If Romney slips under the mark of “50% of the delegates awarded so far” in the next few contests, expect the talk of brokered conventions to accelerate rapidly.
How about Santorum? Well, despite the positive headlines, in terms of actually winning the nomination, despite his wins in two states, today was not good for him. Coming into this round, he needed to be getting 66.2% of the delegates to be on a pace to catch up and win. He got 34/101=33.7% which is nowhere even close. As a result, his “% needed to win” rises dramatically to 68.7%. This is essentially an impossible number as long as all four candidates continue to get support. Even if Gingrich and Paul drop out, this would be an insane winning margin in a two man race. Not going to happen. The only scenarios where Santorum starts to get close are ones where Gingrich and Paul not only drop out, but their delegates en masse and unanimously jump over to Santorum. This would drop Santorum’s “% needed to win” to the 50.8% needed for the non-Romney’s mentioned above. That isn’t going to happen either though.
The situation is of course even worse for Gingrich and Paul. All three of these guys are racing toward mathematical elimination. So the only interesting scenario remains if the three of them collectively can get enough delegates to stop Romney from getting to 1144. The three candidates at this point have all but admitted this. As we have mentioned before, this scenario relies on the three of them being able to continue getting delegates… and getting them at a higher rate than they have so far… even though it is impossible for any of them to individually win. This is still in the realm of the possible though. They have to win the spin war by winning states, even if not by enough delegates to catch up, pushing things explicitly as “Stop Romney”, etc. By all reports the rest of March is still marginal for Romney. If Santorum gains some momentum from states like Alabama and Mississippi and can push hard on the “We must stop Romney” angle, wins some more states in March and then starts driving down Romney support in post-March states, then this remains very much on the table. And then of course the idea is, if it actually goes to the convention undecided, then anything can happen.
Fundamentally the basic analysis of where we are remains the same as it has been since Super Tuesday, and arguably since Florida… or even since Iowa… namely, the non-Romney’s get further away from the nomination with almost every contest (the only exceptions so far being South Carolina and Kansas). Meanwhile Romney continues to hover in the zone where if he continues exactly how he has been going he will win EVENTUALLY, but it will take a long time, and if his opponents collectively improve their performance just a LITTLE BIT, they could block him and force some convention drama.
Edit 2012 Mar 13 18:11 UTC to correct one place where I had incorrectly said Romney when I actually meant Gingrich. Thanks Paolo for pointing it out.