This is the website of Abulsme Noibatno Itramne (also known as Sam Minter).
Posts here are rare these days. For current stuff, follow me on Mastodon
|
On this week’s Curmudgeon’s Corner podcast Ivan and Sam start off talking about things OTHER than Election 2016. The upcoming small iPhone announcement, corporate reorgs, Kanye and The Pirate Bay, feedback on the show, and more! But of course then it is election time. They cover the Super Tuesday results in both parties, the Republican delegate math, the possibilities of a Republican schism, and everything else surrounding the race that they can think of.
Click below to listen or subscribe… then let us know your own thoughts!

Recorded 2016-03-03
Length this week – 1:59:20
 1-Click Subscribe in iTunes 1-Click Subscribe in iTunes
 View Podcast in iTunes View Podcast in iTunes
 View Raw Podcast Feed View Raw Podcast Feed
 Download MP3 File Download MP3 File
 Follow the podcast on Facebook Follow the podcast on Facebook
Show Details:
- (0:00:10-0:10:30) But First
- Agenda
- Small iPhone
- Mexico City
- Reorgs
- (0:11:50-0:42:03) Lightning Round
- Carillian prelude
- Apple wins a round
- Malaysian Plane
- Kanye and Pirate Bay
- Nearby House Fire
- North Korea
- Syria
- Feedback
- Sam’s Vote?
- (0:43:08-1:28:41) Election 2016 Part 1
- Democratic Super Tuesday Results
- Sanders lost, get over it
- Carson out
- Christie and Trump
- Rubio attacking Trump
- Trump’s Business Success
- Effect of Rubio’s Attacks?
- Trump Delegate Math
- Forcing a contested convention?
- Delegate Shenanagans
- Odds of President Trump?
- Trump’s Policy Details
- The Mexican Wall
- Trump and Duke/KKK
- (1:29:44-1:59:01) Election 2016 Part 2
- Never Trump Republicans
- Will the Republicans Split?
- Is Clinton more conservative than Trump?
- Trump’s Supporter’s Motivations
- Immigrant Debate
- Romney Attacks
- Trump’s Free Media
- Buying votes not working
- The Next Contests
The Republican Super Tuesday is over with the exception of a handful of delegates that were still undetermined when it was time for me to start writing up the results.
Last Tuesday I used polling to project what Super Tuesday would look like for the Republicans. The projection looked like this:
Estimate: 294 Trump, 246 Cruz, 67 Rubio, 11 Kasich, 6 Carson
We’ll dispense with the state by state totals, and jump right to the final results:
Actual: 252 Trump, 211 Cruz, 101 Rubio, 16 Kasich, 4 Carson, 6 TBD
The 6 that are still to be determined as of this update are from Tennessee (3 delegates) and Texas (3 delegates), but they won’t make much of a difference here.
The poll based estimates were not quite as close as they were for the Democrats. This may simply be because I did the estimates a full week out based on relatively sparse polling. There were a lot of polls in that last week, and it may well be that the results would have been closer if I had redone the analysis on Monday.
The general outlines of the estimate and the analysis based on them were basically correct though. The one notable difference is that Rubio did considerably better than the estimates, at the expense of both Trump and Cruz’s delegate totals. It appears that Rubio’s week of anti-Trump crusading may have worked.
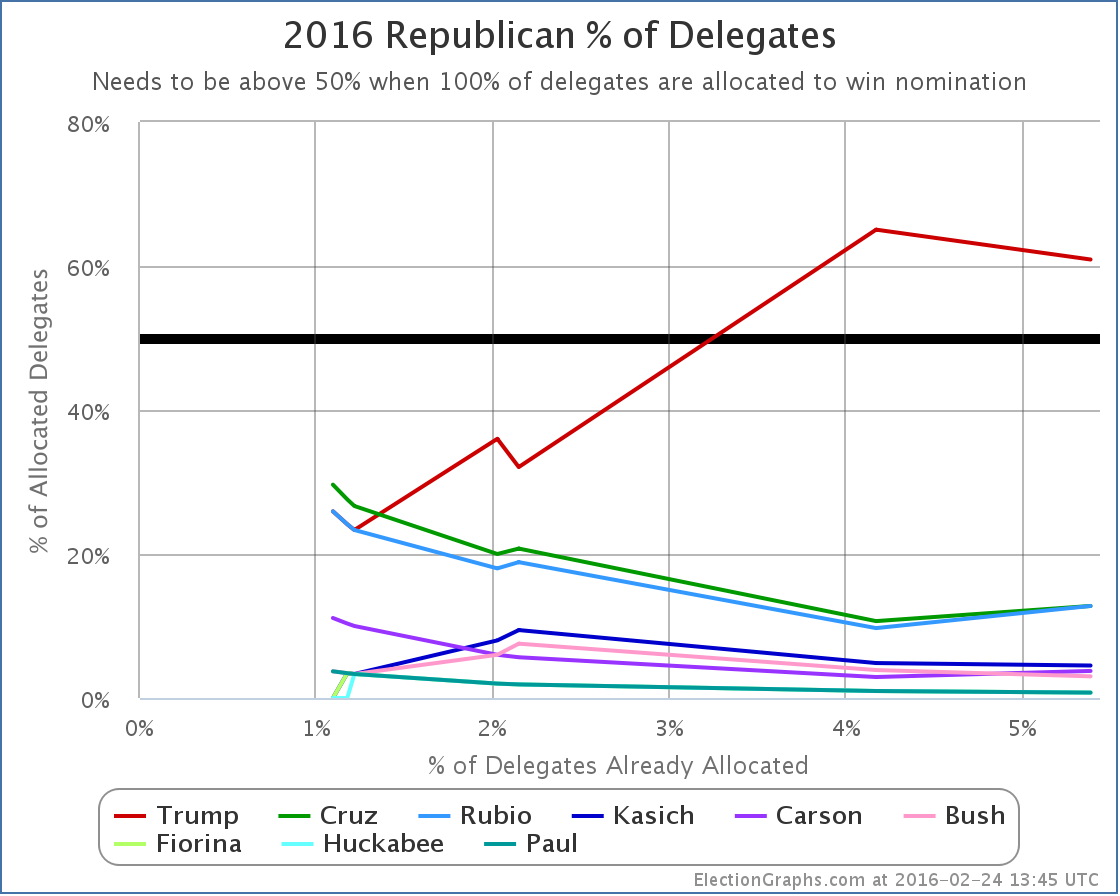
The main consequence is that Trump was pushed a bit further away from the levels he needed to actually improve his position relative to last week. He was expected to lose ground anyway, but he lost more than it looked like he was going to. It was enough to push Trump back down below 50% of the delegates allocated so far:
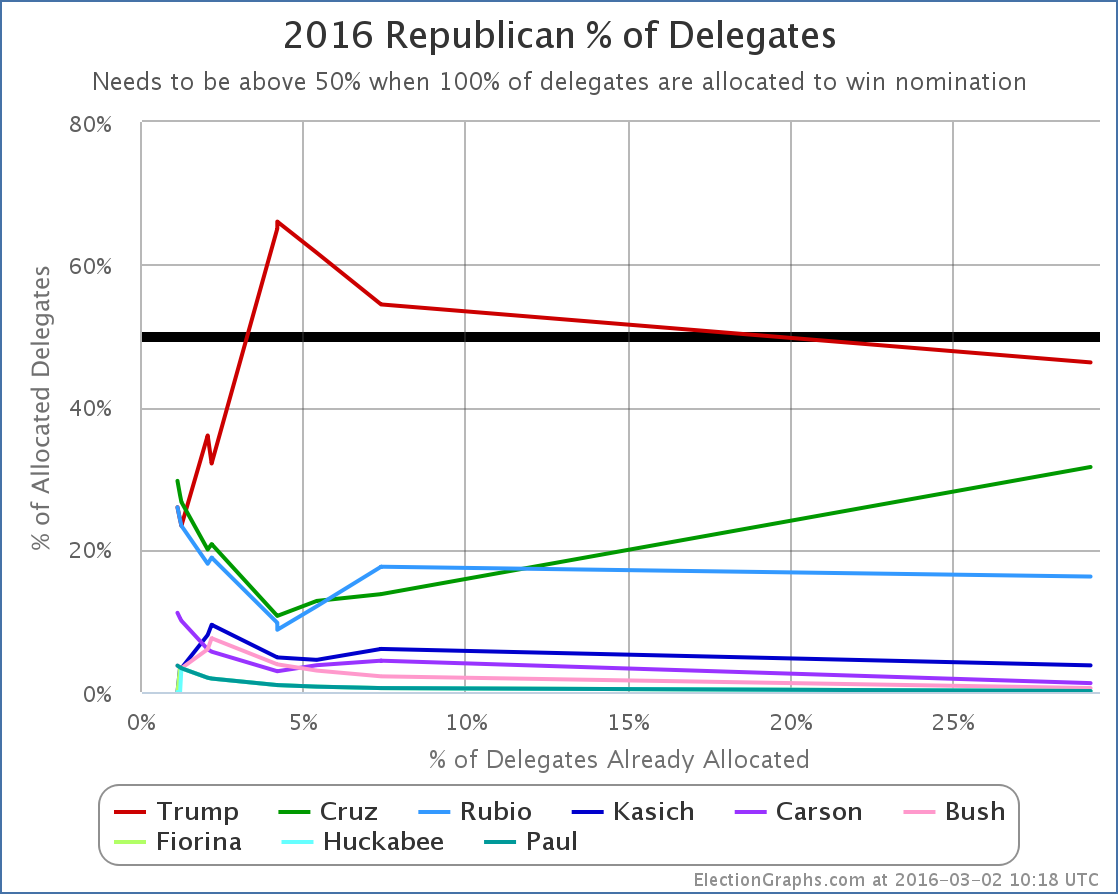
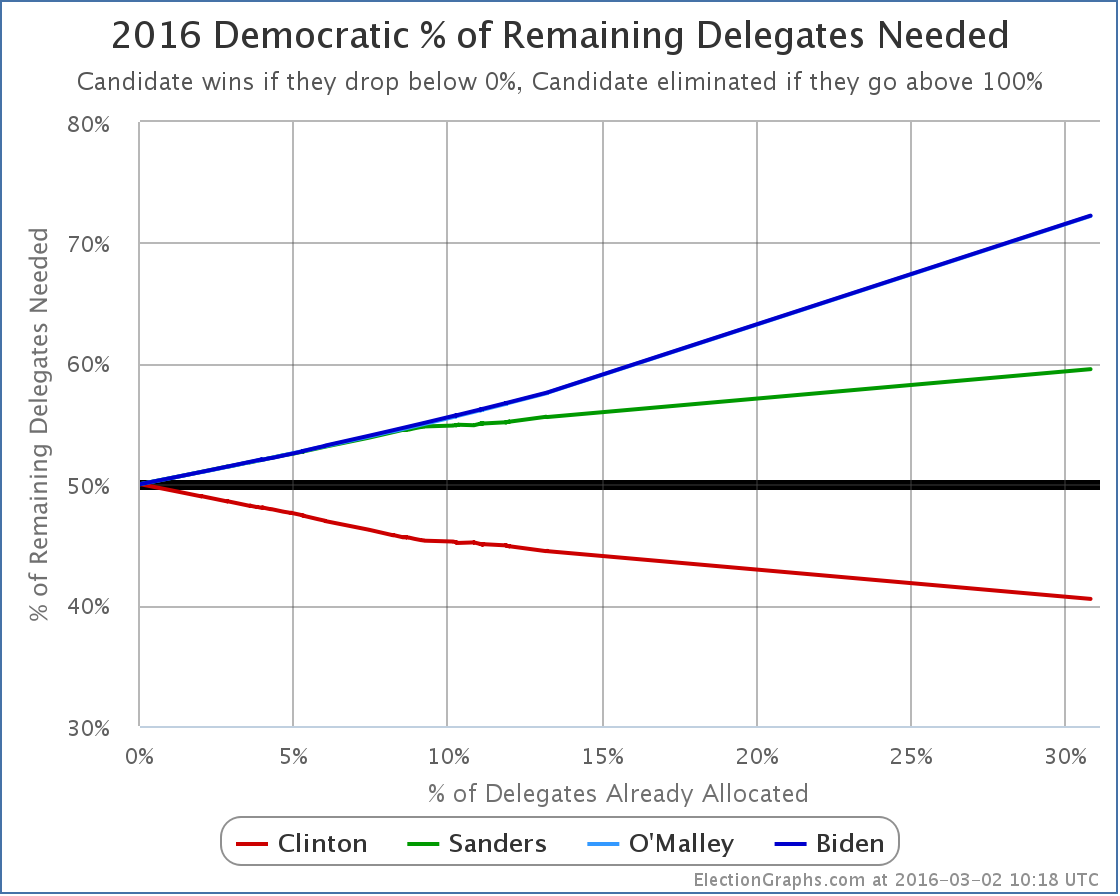
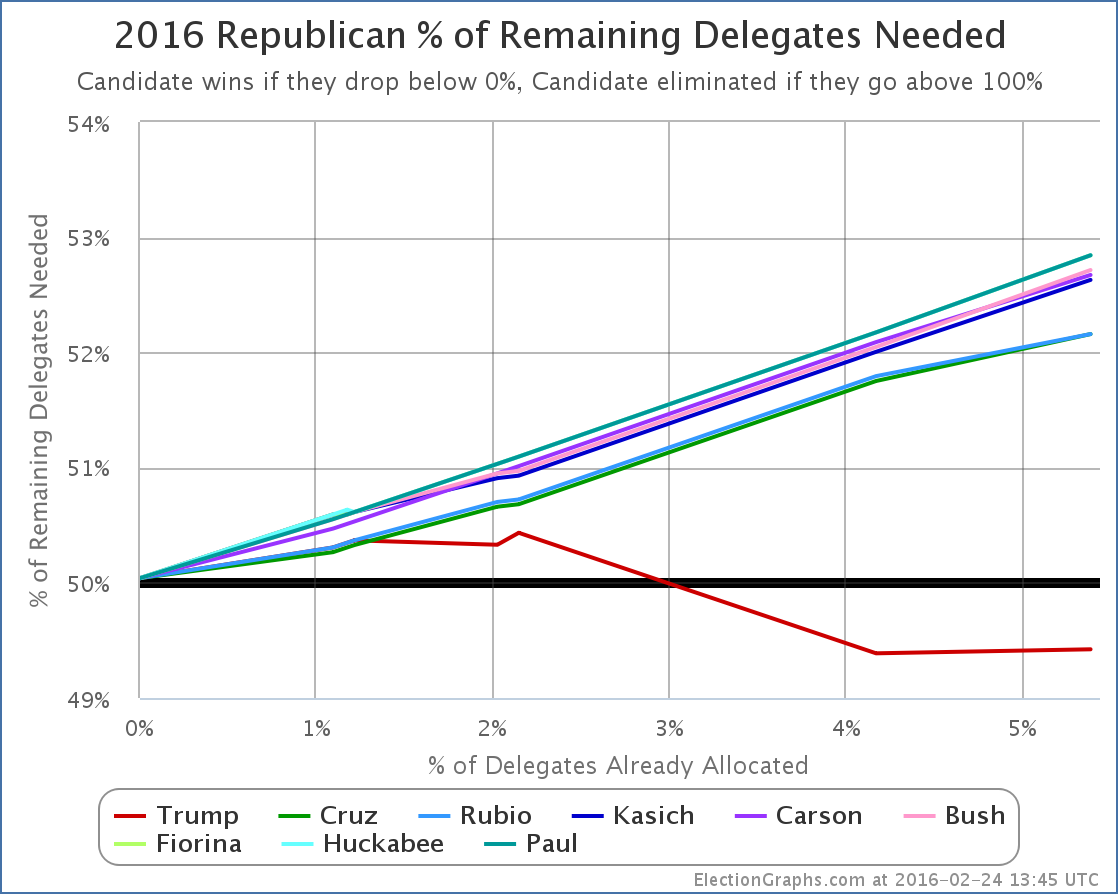
On this metric, Cruz looks like he did the best coming out of Super Tuesday. But this is the wrong number to be looking at. The all important thing to be looking at is the “% of remaining delegates needed to win”:
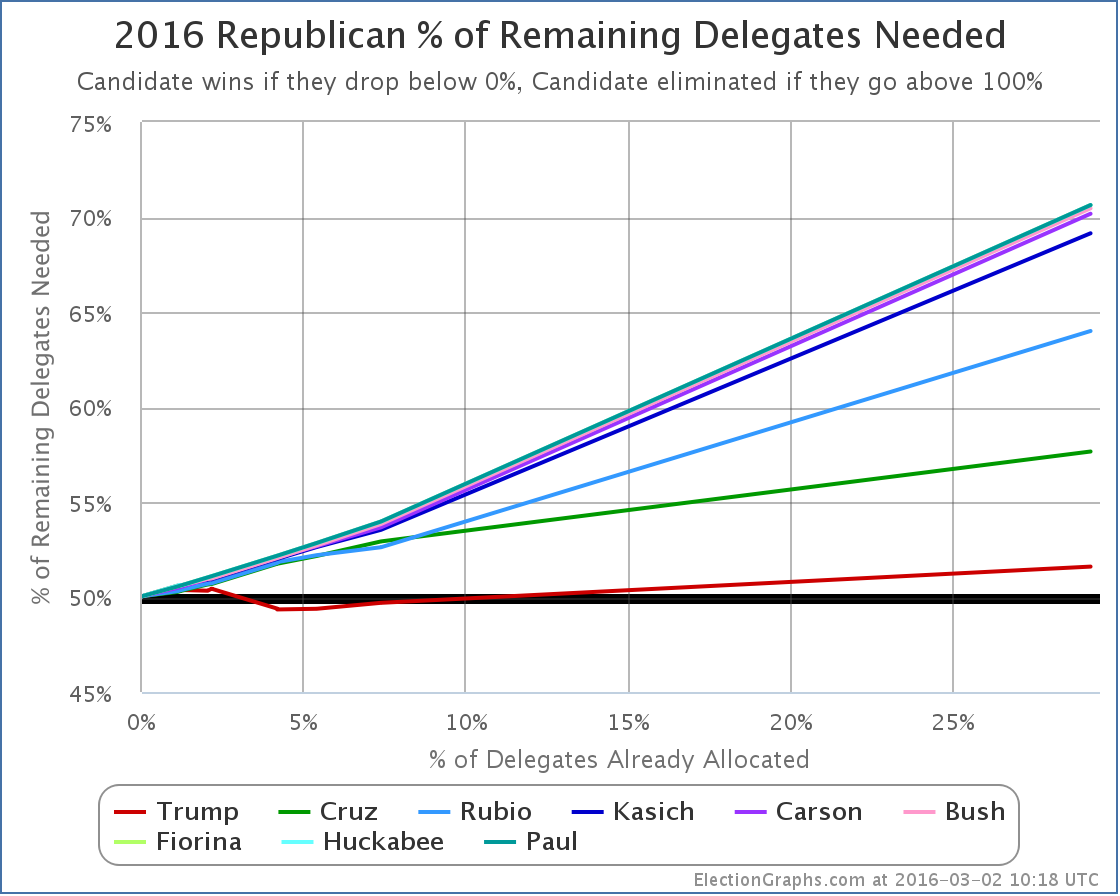
Everybody’s position got worse! (Remember down is good on this chart… getting down to 0% means you win, going up to 100% means you are eliminated.)
Trump needed to get 49.4% of the Super Tuesday delegates to improve his position in terms of getting to a clean first ballot win. Instead, he got 43.1% of the delegates so far. So his “% of remaining delegates to win” increased to 51.6%.
We are back in the zone where if everybody performs the same as they have so far, we end up with Trump having more delegates than anybody else, but a bit short of the majority he would need to win. The “contested convention” scenario.
At this point the closest competitor is Cruz, who would need 57.7% of the remaining delegates in order to catch up and win outright. Next closest is Rubio, who would need 64.0% of the remaining delegates. Given their past performances, it seems unlikely that either will reach anything close to those numbers, especially since they both seem determined to stay in the race. It would take one of them dropping out AND a complete Trump collapse to enable that. This seems like an unlikely scenario at this point.
But both the Cruz and Rubio campaigns are now starting to openly talk about a contested convention. To do that, neither Cruz or Rubio need to get super-majorities of the remaining delegates. They don’t even need to get majorities. They don’t even need to have a majority of the delegates between them. They just need to keep Trump to less than 51.6% of the remaining delegates.
So Cruz + Rubio + Kasich (now that Carson has dropped out) just need to manage to get 48.4% of the remaining delegates between them. And if they successfully do that, they will need even less the next time around.
At this point, the best strategy to “stop Trump” is not for more people to drop out. It is for all three of the remaining non-Trumps to stay in to try to get as many delegates as they can, even if they know they can’t get to an outright win either. Strategies have been suggested such as the candidates working together and encouraging their supporters to vote for whichever non-Trump was strongest in each state in order to maximize the delegate totals. Then they would work it out at the convention.
That kind of coordination between rival campaigns is unlikely. But it could happen to some degree spontaneously between now and March 15th, just by the nature of having four candidates still in the race. Even though Trump is leading in a lot of the states in the next couple of weeks, it is possible the non-Trumps could keep him below that 51.6% target, and thus be on the road to a contested convention.
But… starting March 15th there are winner take all states. Not just states where the delegate totals are heavily weighted to the winner, but pure unadulterated winner take all. If Trump is below 50% of delegates at that point, but not by all that much, and he is still leading the polls, then starting on March 15th, he’ll just start cleaning up and get back over 50% very rapidly, and then close out the contest.
In order to actually force a contested convention, the non-Trumps not only have to keep him below 51.6% of the delegates that are being doled out in the next couple weeks, they either have to keep him MUCH lower than that number in the next two weeks, or they have to damage him so much that by March 15th he is losing states left and right and the others can continue to pick up large numbers of delegates in the winner take all zone. Of course, the two might have to come together.
The odds of a non-Trump winning the nomination outright are now negligible absent a major event that destroys Trump’s prospects.
The ability to deny Trump a majority is still alive though. But the time for even that is running out quickly. The non-Trumps basically have two weeks.
Of course, Trump might still come out of a contested convention as the nominee, especially if he came in with a plurality of the delegates that wasn’t very far from the 50% mark. But all kinds of things can happen at a contested convention, including the emergence of a nominee who wasn’t even running. You never know.
One final thing before closing up. I have heard a lot of commentary saying that if any other candidate besides Trump was in the position he is in, he would already be being called the presumptive nominee. Maybe. But we really aren’t quite there yet.
Trump is definitely leading. He has better chances than anybody else of ending up the nominee. But at the same time…
Trump is clearly behind where either Romney or McCain were at this stage in the process. Digging up data from my 2008 and 2012 delegate tracking…
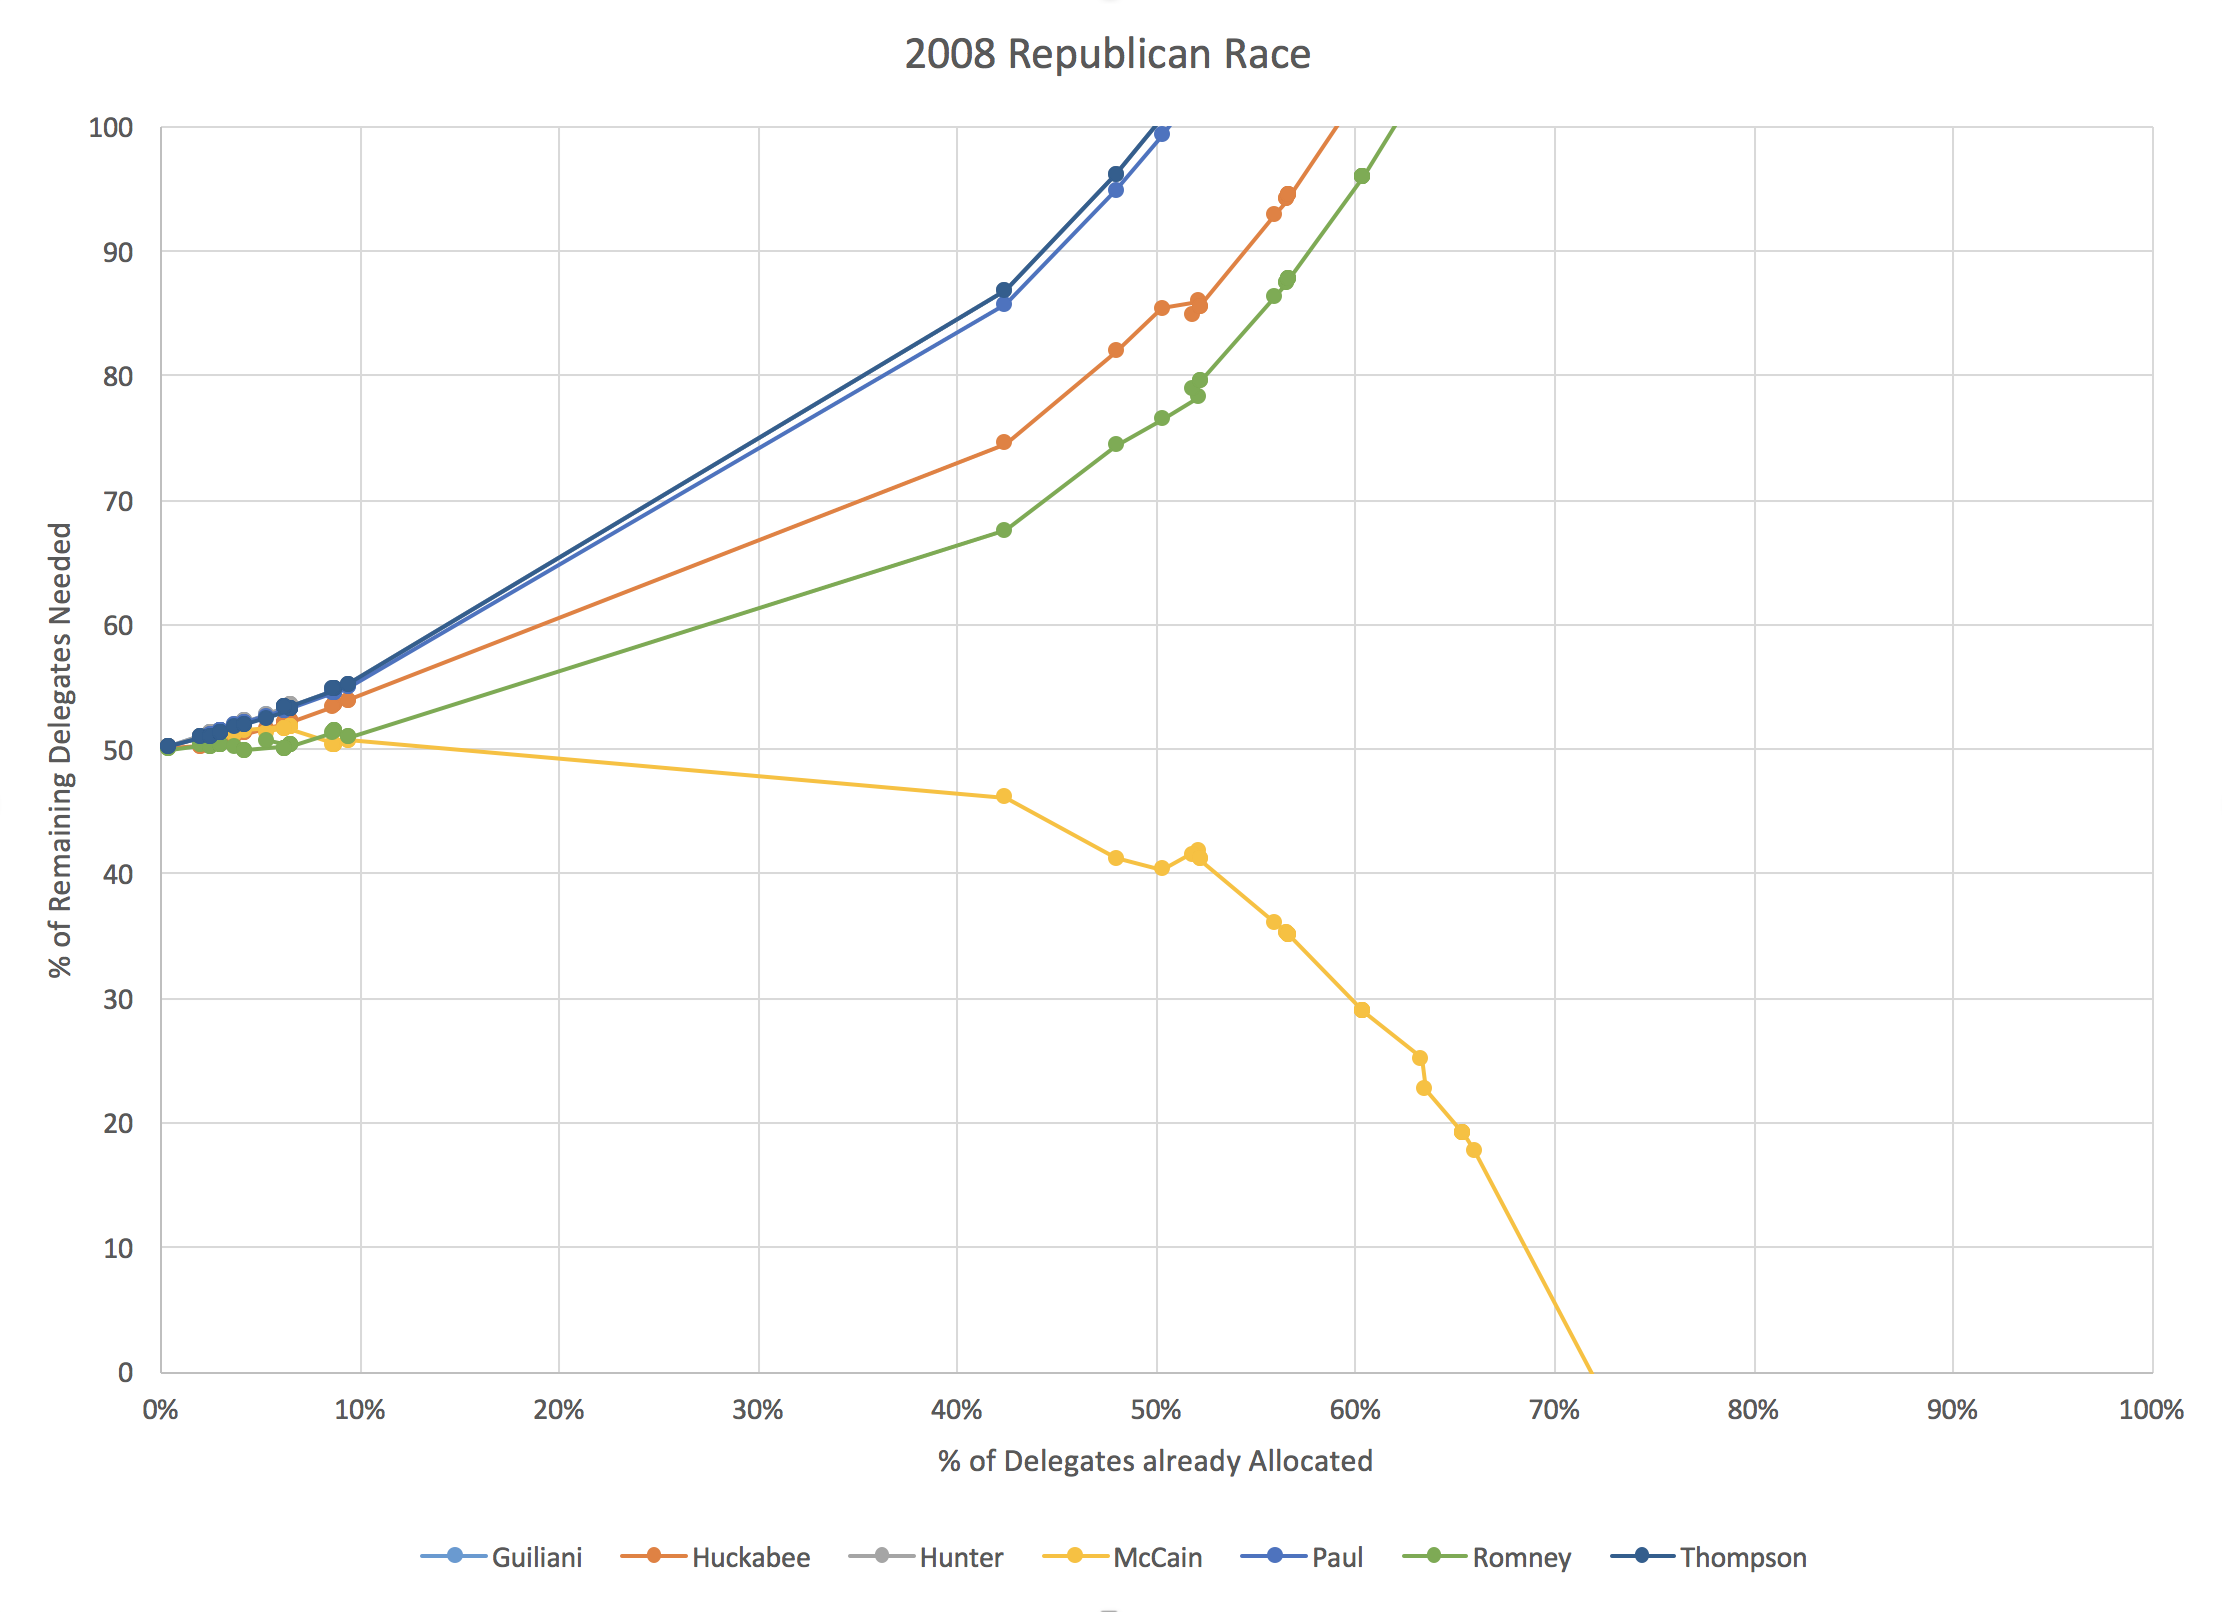
We are currently at the point where about 29% of the delegates have been allocated. Super Tuesday was bigger in 2008, so we don’t have a data point between about 10% and 42%, but you can see that in that Super Tuesday event, McCain took a clear lead, leaving all of the competitors behind. Although things were still a muddle before Super Tuesday, from that point forward there was no stopping McCain. His dominance was unmistakeable.
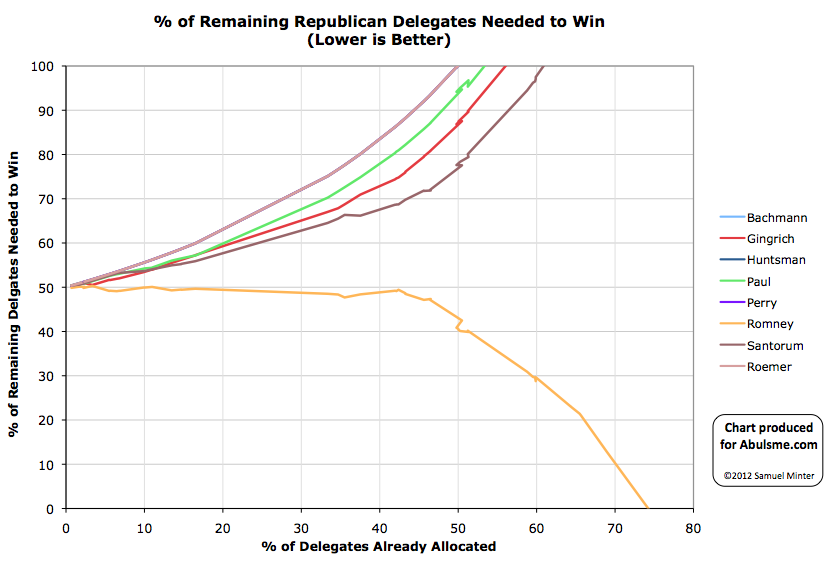
In 2012, Romney was over 50% of delegates earned almost from the very beginning. He continued to hover just below 50% of remaining delegates needed to win though, leading for continued talk of a possible brokered convention for awhile longer. It took until we got past 45% of delegates for Romney to really pull away and eliminate that possibility, making it a clean win.
2012 is probably the closest parallel to where we are today, but Romney never dropped below 50% of delegates after that first few percent at the beginning of the race. Trump is weaker than that at the moment… and his opponents are stronger. But the gap isn’t large. He trails Romney, but not by much.
We’re going to go from just under 30% of delegates determined today, to just under 60% after March 15th. Things will move very quickly, and if there really is going to be a good chance of a contested convention, the groundwork will be laid in these two weeks. If the non-Trumps want to stop Trump, that almost certainly needs to be the game plan at this point. And it has to start bearing fruit NOW.
[Update 2016-03-03 02:34 UTC – The 6 TBD delegates in Tennessee and Texas have been resolved, and there were other adjustments as results continues to be tabulated. Net changes happened in four states: Arkansas (Trump -1, Cruz +1), Massachusetts (Trump +1, Carson -1), Tennessee (Trump +2, Cruz +2, Rubio -1) and Texas (Cruz +4, Trump +2, Rubio -3). Total change for this update: Cruz +7, Trump +4, Carson -1, Rubio -4. New overall delegate totals are: Trump 338, Cruz 235, Rubio 113, Kasich 27, Carson 8, Bush 4, Fiorina 1, Huckabee 1, Paul 1. These changes do not substantively change the analysis above.]
[Update 2016-03-04 02:53 UTC – Update for Georgia: +1 Cruz, -1 Rubio.]
Note: This post is an update based on the data on ElectionGraphs.com. Election Graphs tracks both a poll based estimate of the Electoral College and a numbers based look at the Delegate Races. All of the charts and graphs seen in this post are from that site. Additional graphs, charts and raw data can be found there. All charts above are clickable to go to the current version of the detail page the chart is from, which may contain more up to date information than the snapshots on this page, which were current as of the time of this post. Follow @ElectionGraphs on Twitter or like Election Graphs on Facebook to see announcements of updates or to join the conversation. For those interested in individual general election poll updates, follow @ElecCollPolls on Twitter for all the polls as they are added.
Well, Super Tuesday is over except for a few straggling delegates that were not yet determined when it was time to start writing this post. So how did things end up? A lot of places will concentrate on “states won” and say that Clinton won 7 states and Sanders won 4. That’s well and good, but we’re going to look at what actually matters… the delegate totals.
First as a reminder, on Sunday I used current polling to predict where we would end up on delegates. Subtracting out “Delegates Abroad” which as it turns out won’t report results for a few more days, the polling suggested we would get results something like:
Estimate: 526 Clinton, 339 Sanders
And where are we actually? I’ll refrain from going through this state by state and just jump to the totals.
Actual: 504 Clinton, 335 Sanders, 26 TBD
The 26 TBD delegates are from Texas (19 delegates) and Tennessee (7 delegates). They could still split in such a way that the estimate ends up exactly correct. But even if it doesn’t, it will have been pretty close.
Bottom line is that the results are very closely in line with what would have been expected given the polling. No surprises here.
Where does that put our all important “% of remaining delegates needed to win” chart?
Clinton now only needs 40.52% of the remaining delegates to win the nomination. Sanders needs 59.54% of the remaining delegates to win.
Or of course large numbers of Clinton superdelegates have to start defecting to Sanders, which would raise Clinton’s number, and lower Sanders’ number. But there continues to be no sign of any such movement. And with Sanders continuing to lose the race for non-super delegates as well, it seems unlikely that a a big rush of “back the winner” movement will be heading Sanders’ way any time soon.
In the title of this post, I ask “what next?”. But even if Sanders had some “momentum” coming out of Super Tuesday (he really doesn’t) getting to 60% of the delegates in the coming contests would be a very tall order. His performance so far has been nowhere near that level. The Sanders folks may not be quite ready to admit it yet, but absent a Clinton implosion of historic proportions, the Sanders race for the nomination is over. If Sanders continues to fight on through the remaining contests, it isn’t to win, it is back to “making a point”, and “giving exposure to his issues”, and “moving the party towards him”, which was probably his original goal before he started doing a lot better than people originally expected. Those are legitimate reasons to continue a campaign. But it is not about winning the nomination.
What next? Clinton slowly but surely pushes her lead until she has 2,382 delegates and wins the nomination.
Before closing up, just a quick comparison:
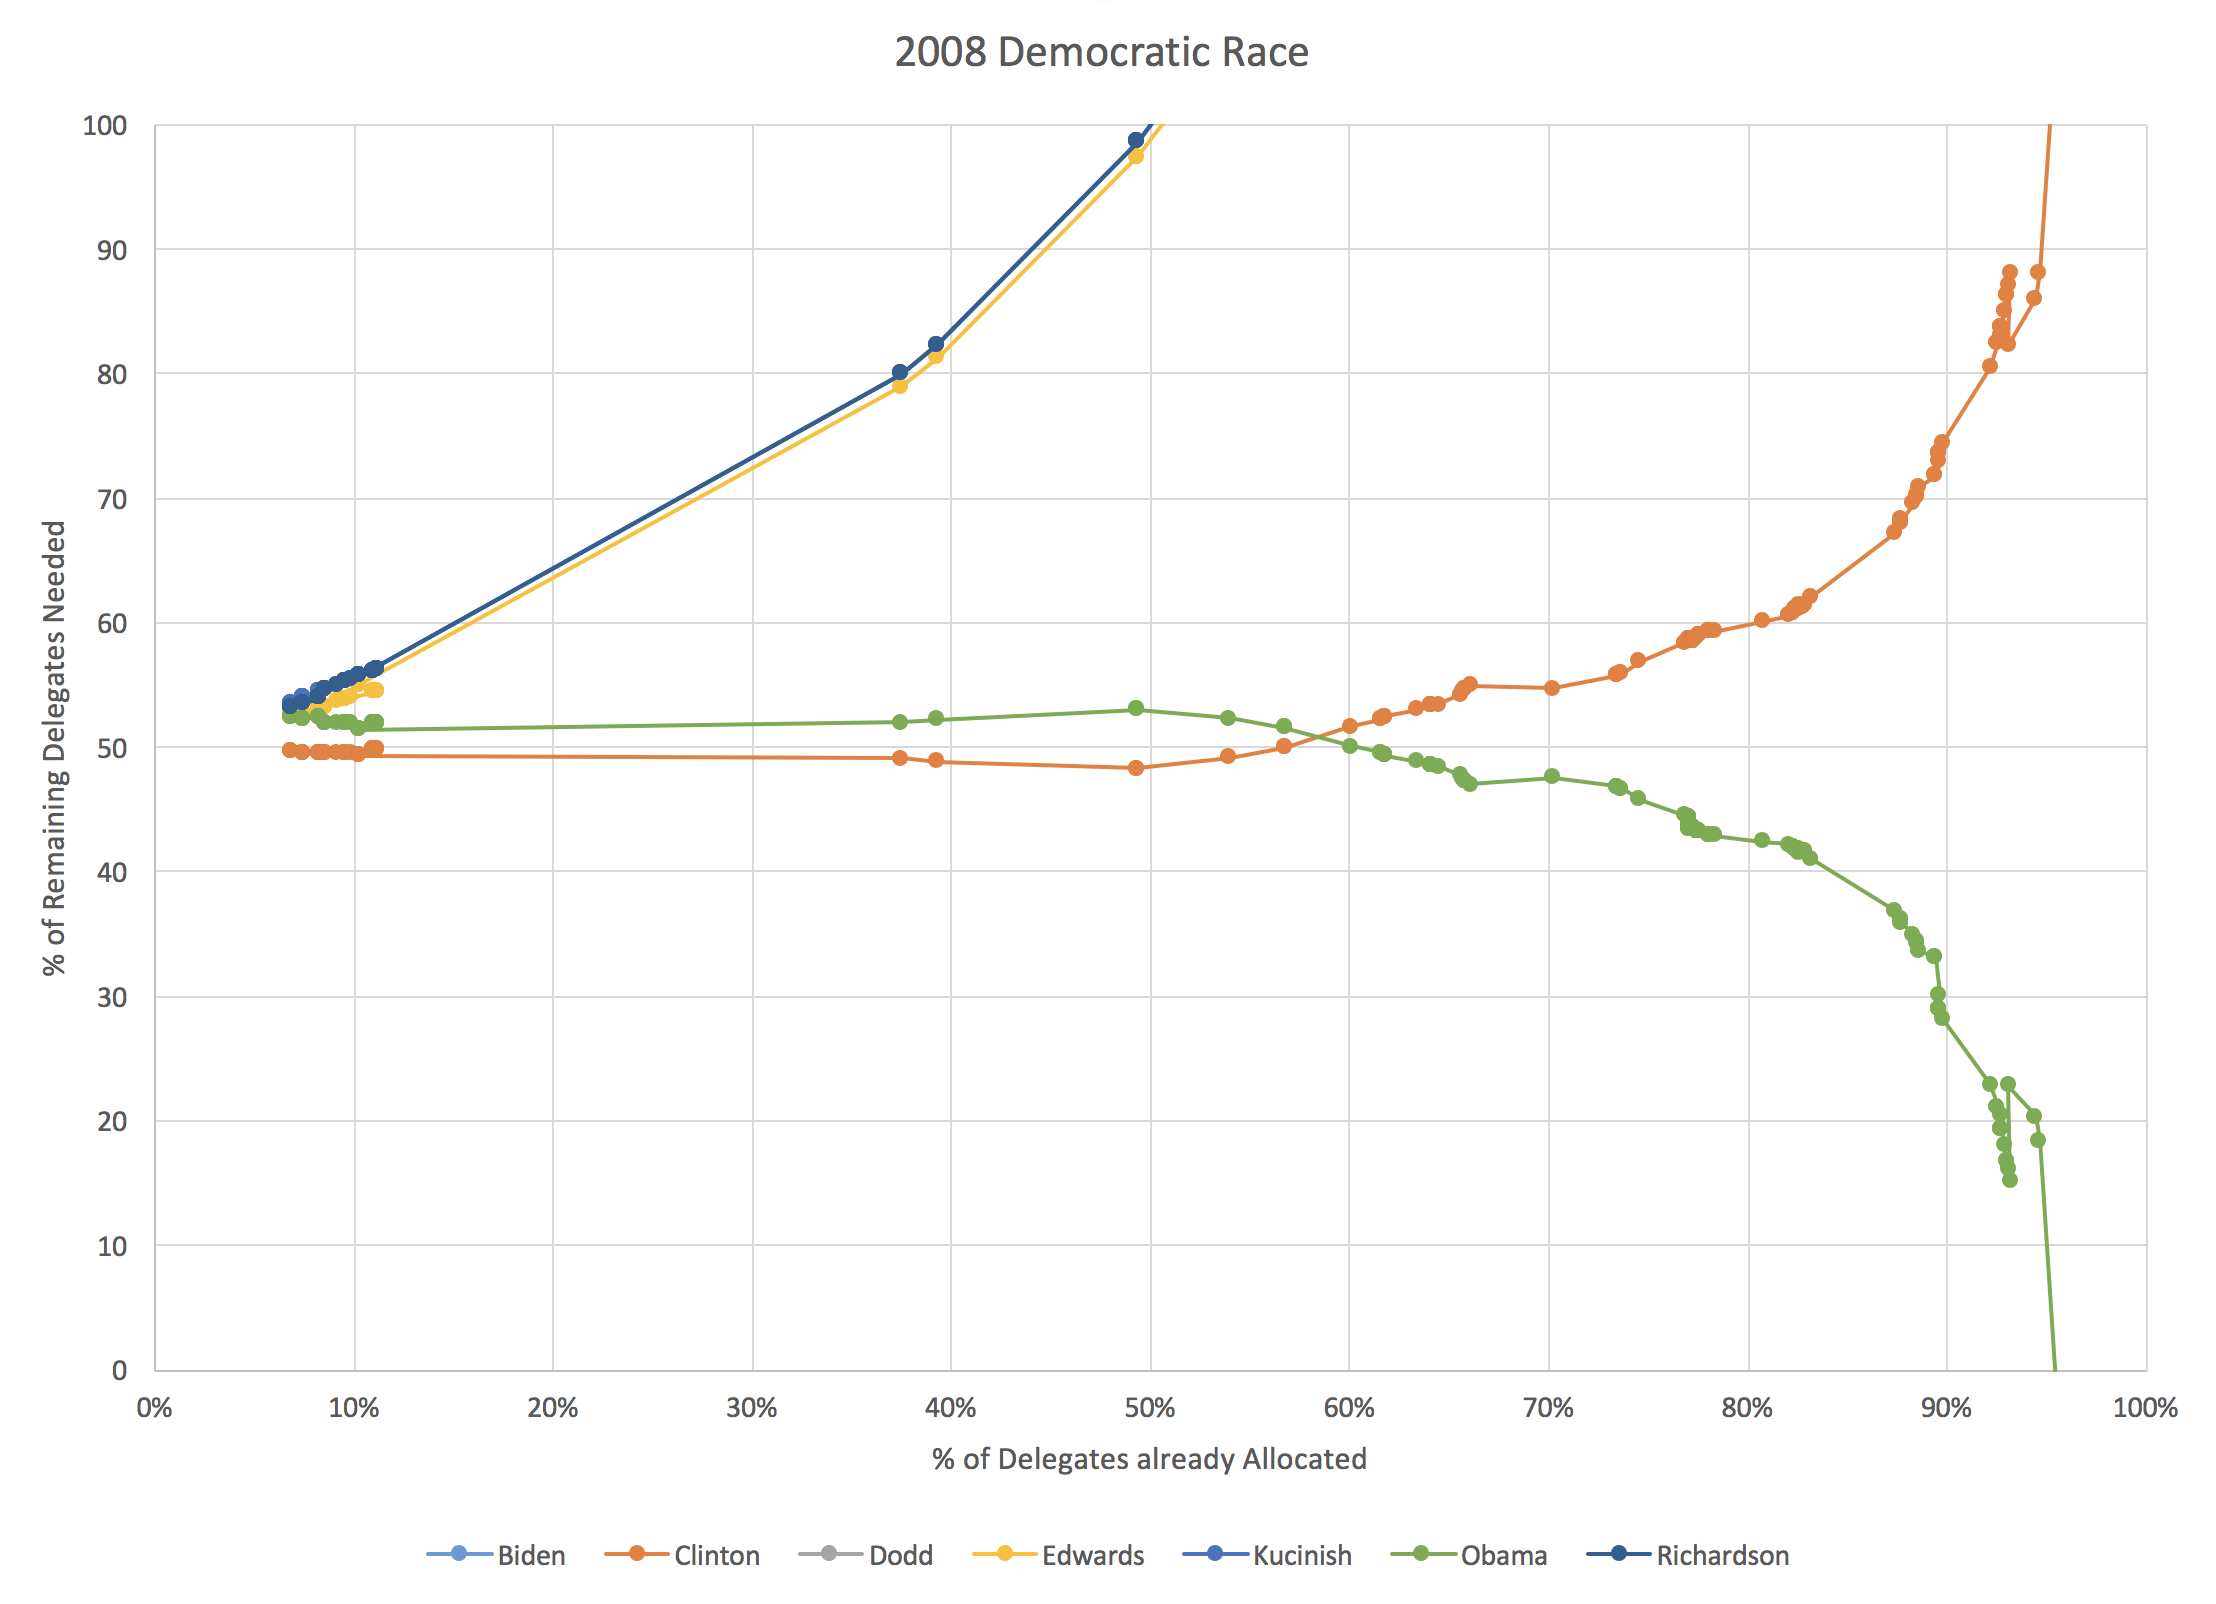
Although I didn’t produce the chart in exactly the same form when I did the analysis in 2008, a few minutes in Excel with the old data produced the equivalent chart for 2008. It is interesting to compare where we are.
First of all, at just over 30% of the delegates allocated, Clinton was still ahead in 2008! But it was much closer than things are today. She needed about 49% of the remaining delegates to win, compared to only needing about 41% today. Obama needed about 52% of the remaining delegates to catch up and win. Which he obviously did. At that point he already had about 47% of the delegates that were already allocated though… while Sanders only has about 29% of the delegates. (Both 2008 and 2016 numbers of course include superdelegates.) So while Obama was able to mount a come from behind win from this point in the delegate race, Sanders is far far behind where Obama was.
Sanders is now approximately where Clinton was when about 80% of the delegates had been determined. In 2008, that was in late April. The media was still talking about the Clinton/Obama race at that point, and hyping up increasingly outlandish scenarios where Clinton could still win, because a race is more interesting than having a clear winner, but anybody watching the numbers knew it was over at that point absent a catastrophic event.
In any case, back here in 2016, I will of course continue to watch the races and post updates after each contest. If a major event happens that changes everything and puts Sanders back on track to win you will see it here. Absent that though, we’re just going to be watching Clinton’s slow march toward mathematically clinching the nomination.
[Update 2016-03-03 02:17 UTC – Update on super Tuesday delegates. The 7 TBD delegates in Tennessee broke 6 for Clinton, 1 for Sanders. The 19 TBD delegates in Texas broke 12 for Sanders, 7 for Clinton. In addition in Minnesota the estimates were adjusted to give one less delegate to Sanders, and one more to Clinton. Net for this round of updates: Clinton +14, Sanders +12, bringing totals to Clinton 1060, Sanders 431, O’Malley 1. This does not substantively change the analysis above.]
[Update 2016-03-04 02:51 UTC – Superdelegate update: Net Clinton +2]
[Update 2016-03-05 16:41 UTC – Superdelegate update: Net Clinton +6]
[Update 2016-03-06 07:30 UTC – Final superdelegate update prior to results from March 6th states: Net Sanders +1]
Note: This post is an update based on the data on ElectionGraphs.com. Election Graphs tracks both a poll based estimate of the Electoral College and a numbers based look at the Delegate Races. All of the charts and graphs seen in this post are from that site. Additional graphs, charts and raw data can be found there. All charts above are clickable to go to the current version of the detail page the chart is from, which may contain more up to date information than the snapshots on this page, which were current as of the time of this post. Follow @ElectionGraphs on Twitter or like Election Graphs on Facebook to see announcements of updates or to join the conversation. For those interested in individual general election poll updates, follow @ElecCollPolls on Twitter for all the polls as they are added.
[Edit 16:44 UTC to actually answer the “What’s next?” from the title.]
As expected, Clinton easily won South Carolina. Clinton won 39 delegates, Sanders got 14.
Since my last post on the Democrats the tally has also added a net 10 superdelegates for Clinton, 1 for Sanders, and 1 straggler for O’Malley.
As of that last post, Sanders needed to get more than 55.03% of delegates to be on track to catch up with Clinton and win. Obviously that hasn’t happened with these updates. He got 23.08% of the delegates since that post.
So the end result is that the percentage of the remaining delegates Sanders needs to win goes up, while that number for Clinton goes down:
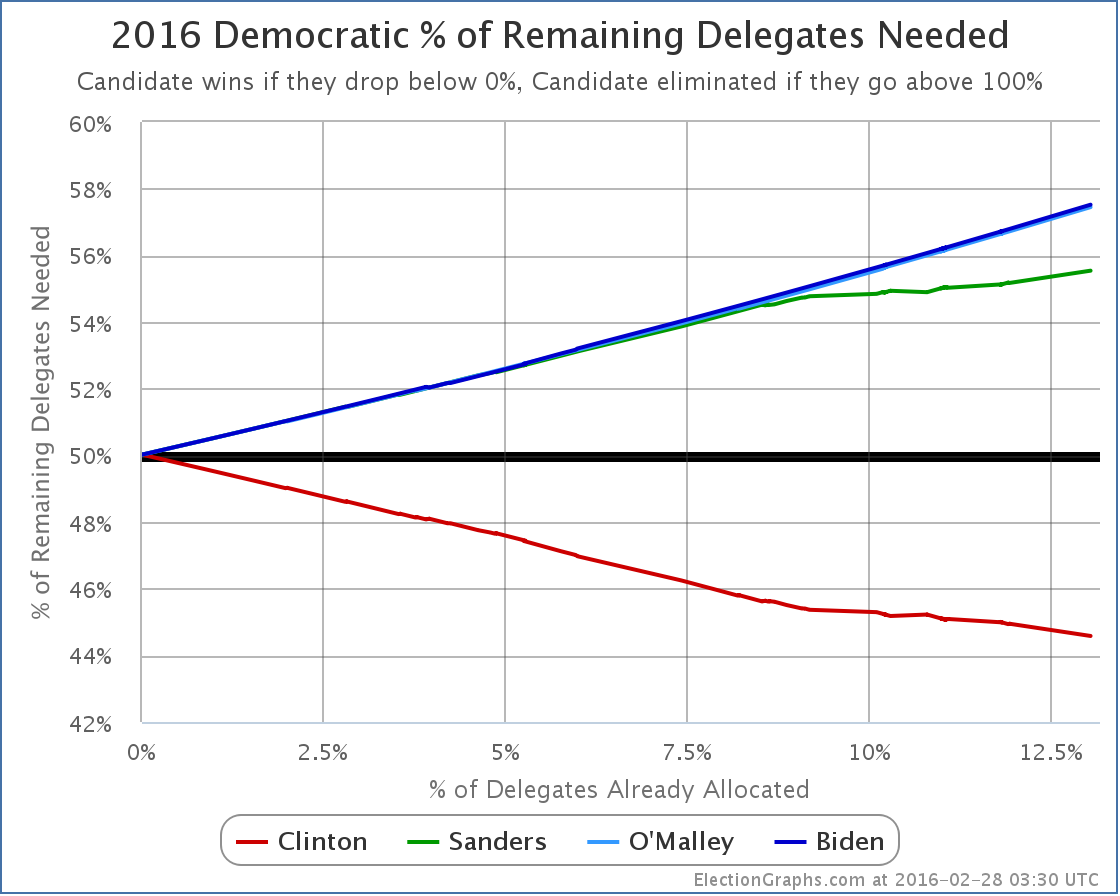
South Carolina is that slight acceleration of the curves starting at about 11.9%.
Sanders now needs 55.54% of the remaining delegates to catch up and win. (Or less if he starts flipping Clinton superdelegates to his side, but there has been no sign of that yet.)
Meanwhile, Clinton only needs 44.58% of the remaining delegates to win.
Frankly, in the 2008 and 2012 cycles once the frontrunner needed less than 45% of the delegates to win, it was time to start calling the race over. Yes, something happening that would allow a challenger to catch up and win is still possible. But it is unlikely. And with each additional contest where the challenger fails to make their own “% needed to win” mark, it gets harder.
But lets not consider it done quite yet. Super Tuesday is coming up in a few days. Maybe there is something there to indicate this isn’t over quite yet. Just as I did for the Republicans, lets game out what Super Tuesday looks like based on current polling. I’ll use the RCP poll averages, then try to estimate delegates based on the rules in each state.
Texas (222 delegates)
- Current poll averages: 59.9% Clinton, 33.6% Sanders
- Delegate estimates: 142 Clinton, 80 Sanders
Georgia (102 delegates)
- Current poll averages: 62.8% Clinton, 26.0% Sanders
- Delegate estimates: 72 Clinton, 30 Sanders
Virginia (95 delegates)
- Current poll averages: 54.5% Clinton, 35.0% Sanders
- Delegate estimates: 58 Clinton, 37 Sanders
Massachusetts (91 delegates)
- Current poll averages: 46.3% Sanders, 45.7% Clinton
- Delegate estimates: 46 Sanders, 45 Clinton
Minnesota (77 delegates)
- Current poll averages: 54.5% Clinton, 28.5% Sanders
- Delegate estimates: 51 Clinton, 26 Sanders
Tennessee (67 delegates)
- Current poll averages: 53.0% Clinton, 30.0% Sanders
- Delegate estimates: 43 Clinton, 24 Sanders
Colorado (66 delegates)
- Last poll from November so using national averages: 47.2% Clinton, 42.2% Sanders
- Delegate estimates: 35 Clinton, 31 Sanders
Alabama (53 delegates)
- Using only poll from February: 59% Clinton, 31% Sanders
- Delegate estimates: 35 Clinton, 18 Sanders
Oklahoma (38 delegates)
- Current poll averages: 45.0% Clinton, 36.0% Sanders
- Delegate estimates: 21 Clinton, 17 Sanders
Arkansas (32 delegates)
- Current poll averages: 57.0% Clinton, 28.5% Sanders
- Delegate estimates: 21 Clinton, 11 Sanders
Vermont (16 delegates)
- Current poll averages: 84.5% Sanders, 9.5% Clinton
- Delegate estimates: 16 Sanders
Democrats Abroad (13 delegates)
- No polls, using national averages: 47.2% Clinton, 42.2% Sanders
- Delegate estimates: 7 Clinton, 6 Sanders
American Samoa (6 delegates)
- No polls, using national averages: 47.2% Clinton, 42.2% Sanders
- Delegate estimates: 3 Clinton, 3 Sanders
OK. Adding all those up…
533 Clinton, 345 Sanders
Now, these are estimates based on relatively sparse polling and the assumption that candidate support is uniformly distributed within each state. The results will not be exactly like this.
But unless something major happens to change the picture in the next couple of days, the results on Tuesday should look broadly similar to this. With the estimate above, Sanders gets about 39.3% of the delegates. A far cry from the 55.5% he would need in order to actually improve his position against Clinton.
Adding the current delegates to the estimated Super Tuesday delegates, the new totals would be:
1,069 Clinton, 427 Sanders, 3 O’Malley
31.5% of the delegates will have been allocated. But 68.5% would still be available.
What would Sanders’ new “% of remaining needed to win” be at that point?
It would be 59.9%.
Sanders would need nearly 60% of the remaining delegates to catch up and win, or a massive defection of Clinton superdelegates to lower that number.
To imagine Sanders performing like this, you either have to believe the remaining states are vastly different in their preferences to the states that will have gone before (there is no evidence for this so far), or some massive seismic event would have to happen in the campaign to dramatically change minds of large numbers of Democratic voters in a very short timeframe.
A good argument could be made that absent a shocking surprise, this race is already done. After Super Tuesday, if the results are anything like the estimates above, then those hoping for a Sanders win will be grasping at the thinnest of straws. By the time we get to the end of March, again, absent that huge surprise, there will be no serious question any more.
Now, surprises do sometimes happen. You never know. But you don’t get to a Sanders win from here with just “normal” campaigning. It would take something bigger… a major Clinton scandal bigger than anything seen so far… a serious issue with Clinton’s health… something along those lines.
This doesn’t preclude Sanders staying in the race all the way until the convention and battling in every primary and caucus. He could do that if his cash flow holds out. But it would be to champion his issues and to try to move the party further in his direction, it would not be a serious attempt to win the nomination.
Three days from the time I post this, we’ll have Super Tuesday results and we’ll see just how close my poll based guestimates were and if this analysis holds up. More then…
[Update 2016-03-02 00:47 UTC – As a result of a final scan for superdelegates prior to adding Super Tuesday results we have a net change of +7 Clinton superdelegates, +2 Sanders superdelegates, -2 O’Malley superdelegates (they flipped to Clinton). This does not substantively change any of the analysis above and does not get a separate blog post, but a note here was warranted.]
Note: This post is an update based on the data on ElectionGraphs.com. Election Graphs tracks both a poll based estimate of the Electoral College and a numbers based look at the Delegate Races. All of the charts and graphs seen in this post are from that site. Additional graphs, charts and raw data can be found there. All charts above are clickable to go to the current version of the detail page the chart is from, which may contain more up to date information than the snapshots on this page, which were current as of the time of this post. Follow @ElectionGraphs on Twitter or like Election Graphs on Facebook to see announcements of updates or to join the conversation. For those interested in individual general election poll updates, follow @ElecCollPolls on Twitter for all the polls as they are added.
This week on Curmudgeon’s Corner Sam and Ivan of course talk about Election 2016, covering both the Democratic and Republican nomination races, then some speculation about what a Clinton vs Trump race may look like. Before that though, they spend some time following up on both the Apple vs FBI case and the SCOTUS vacancy. And there is some feedback to discuss!
Click below to listen or subscribe… then let us know your own thoughts!
Recorded 2016-02-25
Length this week – 1:32:14
1-Click Subscribe in iTunes
View Podcast in iTunes
View Raw Podcast Feed
Download MP3 File
Follow the podcast on Facebook
Show Details:
- (0:00:10-0:11:03) But First
- Water Heater Fire
- Commutes
- Agenda
- Feedback
- (0:12:07-0:28:20) Apple vs FBI
- PR Battle
- Cracking Safes
- Other ways to get info
- Test Case
- Slippery Slopes
- Lavabit comparison
- (0:29:06-0:42:09) SCOTUS and Congress
- Doing Nothing
- Republican Strategies
- Options in January
- Senate Implications
- Republican Factions
- Ivan for SCOTUS
- (0:42:48-1:01:36) Election 2016 – Primaries
- Ivan for SCOTUS continued
- Clinton Still Winning
- Judicial Murders
- Trump SC/NV Wins
- Dissipating Trump Denial
- Gaming out Super Tuesday
- (1:02:16-1:31:53) Election 2016 – Clinton vs Trump
- Trump as third party after contested convention?
- Are there really that many asshole racists?
- The whiteness of the GOP
- Clinton vs Trump personal attacks
- Trump attacking from both Right and Left
- Trump Reinvention
- President Trump
Once again the headline out of a state is Trump winning. In Nevada the delegate count was:
14 Trump, 7 Rubio, 6 Cruz, 2 Carson, 1 Kasich
To be on the glide path for a 1st ballot victory though, Trump needed 15 of the 30 delegates. So he fell slightly short.
Now, don’t misunderstand. This is still an impressive victory, and looking at the upcoming states he has a clearer path to victory than anybody else. His margins were higher in Nevada than many people expected. But if today’s performance was replicated in all of the other states, Trump would come to the convention with more delegates than anybody else, but not the majority needed to win outright. Of course as we continue more people will drop out, and the amount with which states give bonuses to the winners increases, so that still seems like an unlikely final outcome.
Right now Trump continues to do everything he needs to do to win. Lets look at some of the graphs, then we’ll do a quick look at the March 1st “Super Tuesday” states.
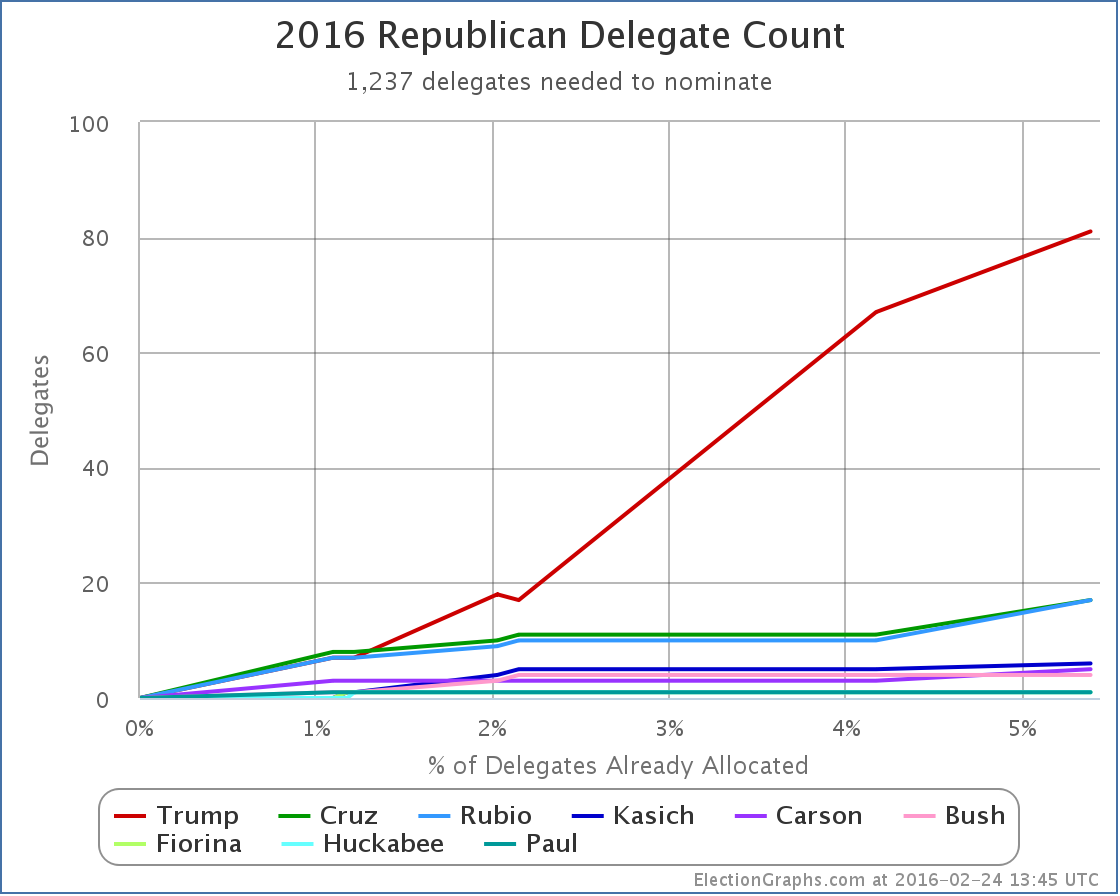
The overall delegate count is now:
81 Trump, 17 Cruz, 17 Rubio, 6 Kasich, 5 Carson, and 7 for people who have dropped out
Trump continues to dominate. Lets look at this as percentages:
The “winners” here were actually Cruz, Rubio and Carson. Each of them improved their proportion of delegates with Nevada’s results. Trump actually went down. He doesn’t have to worry too much about that though. He still has a majority of the delegates allocated so far, and he is far far ahead of any of his opponents.
Finally, lets look at the “% of remaining delegates needed to win”, which I argue is the single most important thing to look at to understand where the race really is:
Because Trump got 14 delegates instead of 15 delegates, his line goes up a little bit. (Remember, on this chart down is good, up is bad.) The red line goes from needing 49.39% of the remaining delegates to needing 49.42%. This is a relatively trivial difference though. It is basically flat. Trump’s situation is very close to unchanged.
Meanwhile, the other lines keep going up at a decent pace. Kasich and Carson add about 0.6% to their numbers. Cruz and Rubio add about 0.4%.
This should be obvious, but the more they lose, the harder it is to catch up.
Many people are still talking about how as consolidation happens, the remaining non-Trumps will do better and the picture will change. Maybe, but nobody new announced they were dropping out after the Nevada results (yet anyway). So it looks like we may still go into March 1st with a five person race.
Lets run a hypothetical using current polling on the Super Tuesday states and see where we end up using RCP poll averages for the five remaining candidates. We’ll make delegate estimates based on the specific delegate allocation rules in each state.
Texas (155 delegates)
- Current poll averages: 37.3% Cruz, 28.0% Trump, 11.7% Rubio, 4.7% Carson, 3.0% Kasich
- Delegate estimates: 99 Cruz, 56 Trump
Georgia (76 delegates)
- Current poll averages: 35.0% Trump, 22.7% Cruz, 19.3% Rubio, 7.3% Carson, 6.3% Kasich
- Delegate estimates: 50 Trump, 26 Cruz
Tennessee (58 delegates)
- Last poll from November so using national average: 33.6% Trump, 20.4% Cruz, 16.4% Rubio, 9.8% Kasich, 7.4% Carson
- Delegate estimates: 37 Trump, 21 Cruz
Alabama (50 delegates)
- Last poll from December so using national average: 33.6% Trump, 20.4% Cruz, 16.4% Rubio, 9.8% Kasich, 7.4% Carson
- Delegate estimates: 32 Trump, 18 Cruz
Virginia (49 delegates)
- Using only February poll: 28% Trump, 22% Rubio, 19% Cruz, 7% Kasich, 7% Carson
- Delegate estimates: 17 Trump, 13 Rubio, 11 Cruz, 4 Kasich, 4 Carson
Oklahoma (43 delegates)
- Using only February poll: 32.5% Trump, 25.0% Cruz, 15.5% Rubio, 7.0% Carson, 0.0% Kasich
- Delegate estimates: 17 Trump, 15 Cruz, 11 Rubio
Massachusetts (42 delegates)
- Current poll averages: 41.0% Trump, 17.0% Rubio, 10.0% Cruz, 7.5% Kasich, 3.5% Carson
- Delegate estimates: 23 Trump, 9 Rubio, 6 Cruz, 4 Kasich
Arkansas (40 delegates)
- Using only February poll: 27% Cruz, 23% Trump, 23% Rubio, 11% Carson, 4% Kasich
- Delegate estimates: 18 Cruz, 13 Rubio, 9 Trump (giving Rubio the 2nd place finish breaking 23% tie by alphabetical order)
Minnesota (38 delegates)
- Last poll from January so using national average: 33.6% Trump, 20.4% Cruz, 16.4% Rubio, 9.8% Kasich, 7.4% Carson
- Delegate estimates: 18 Trump, 11 Cruz, 9 Rubio
Wyoming (29 delegates)
- No polls at all, using national average: 33.6% Trump, 20.4% Cruz, 16.4% Rubio, 9.8% Kasich, 7.4% Carson
- Delegate estimates: 12 Trump, 7 Cruz, 5 Rubio, 3 Kasich, 2 Carson
Alaska (28 delegates)
- Last poll from January so using national average: 33.6% Trump, 20.4% Cruz, 16.4% Rubio, 9.8% Kasich, 7.4% Carson
- Delegate estimates: 13 Trump, 8 Cruz, 7 Rubio
Vermont (16 delegates)
- No polls at all, using national average: 33.6% Trump, 20.4% Cruz, 16.4% Rubio, 9.8% Kasich, 7.4% Carson
- Delegate estimates: 10 Trump, 6 Cruz
OK, that’s it. Adding all that up…
Estimated Super Tuesday delegate totals: 294 Trump, 246 Cruz, 67 Rubio, 11 Kasich, 6 Carson
That gives Trump 47.1% of the super Tuesday delegates, Cruz 39.4%, and everyone else much less.
Trump needs 49.4% of the delegates to be on the path to an outright win though! So 47.1% would be in the realm where heading to a contested convention might be possible! Still unlikely, as the additional states in March will add up fast, and more candidates are likely to drop out. Still though, possible!
Adding in the existing delegates, we’d have a post-Super Tuesday race that looks like this:
375 Trump, 263 Cruz, 84 Rubio, 17 Kasich, 11 Carson, 7 for candidates who have already dropped out
Now, these are estimates based on current polling, and very few of these states were well polled as of this post, so much of the above is based on one or two polls, or using the national averages rather than state polls. And I had to make the assumption that all congressional districts would mirror state results (which is unlikely to be true). And Wyoming actually elects individual delegates rather than doing things based on candidate preference, so it may be an oddball in the end. And of course things are likely to change further before people actually vote next Tuesday. But… the general outlines of this aren’t likely to be too far off.
If this is even remotely close to where we are on March 2nd, we end up with Trump very close to the 50% of delegate mark. (The above has him EXACTLY at that mark.) He would need just a LITTLE bit more to actually push him over the edge to a clean win.
The flip side of that though is the combination of all the anti-Trumps would need just a LITTLE bit more in order to have this be on the path to a contested convention. I mentioned earlier that this is still an unlikely outcome. It is. After March 1st, the disproportionality of delegates given to the winner increases, and after March 15th we have pure winner take all states as well. If Trump remains in the overall lead, even with a plurality, then that is all it takes to push him over the edge.
If the anti-Trumps want to have any hope here at all, they need to be in a position by mid-March that they can win not just a few, but many states of the winner-take-most and winner-take-all variety. And frankly, the most likely scenario even then is just forcing a contested convention where Trump still has the most delegates, not someone else winning outright.
The anti-Trumps would have a hard road to get to an outright win. Cruz would need 56.8% of the remaining delegates to catch up and win after March 1st if things played out like my estimates above.
If you had to make a guess based on what we know now, a Trump nomination is far more likely than any other… and with an outright delegate majority on the first ballot, not after a contested convention.
6 days until Super Tuesday. We’ll see how close my estimates above turn out to be.
Update 2016-02-26 07:17 UTC – On February 22nd New Hampshire certified the results of their primary. In the final tally Trump had one more delegate than previous estimates, and Rubio one less. This did not seem worthy of a separate post, but a note here seemed appropriate. The totals on ElectionGraphs.com have been updates appropriately. This does not substantively change any of the analysis above.
Note: This post is an update based on the data on ElectionGraphs.com. Election Graphs tracks both a poll based estimate of the Electoral College and a numbers based look at the Delegate Races. All of the charts and graphs seen in this post are from that site. Additional graphs, charts and raw data can be found there. All charts above are clickable to go to the current version of the detail page the chart is from, which may contain more up to date information than the snapshots on this page, which were current as of the time of this post. Follow @ElectionGraphs on Twitter or like Election Graphs on Facebook to see announcements of updates or to join the conversation. For those interested in individual general election poll updates, follow @ElecCollPolls on Twitter for all the polls as they are added.
[Edit 16:28 UTC to correct math on % of remaining Cruz would need after Super Tuesday, I’d originally shown a higher number around 61%.]
[Edit 2016-02-27 17:06 UTC to fix place where Kasich had been autocorrected to Quash.]
[Edit 2016-02-28 22:03 UTC to add dropped out candidates to the after Super Tuesday estimate.]
| In the latest Curmudgeon’s Corner…
Sam and Ivan talk about:
- Daylight Savings Time / Election 2012
- New iPad / Apple Competition / HD Downloads
Just click to listen now:
[wpaudio url=”http://www.abulsme.com/CurmudgeonsCorner/cc20120311.mp3″ text=”Recorded 11 Mar 2012″]
or
1-Click Subscribe in iTunes
View Podcast in iTunes
View XML Feed |
 |

Chart from the Abulsme.com 2012 Republican Delegate Count Graphs page. When a candidate gets down to 0%, they have cinched the nomination. If they get up past 100%, they have been mathematically eliminated. Rather than the date on the x-axis, we show the “% of Delegates Already Allocated” as this better represents the progress through the race. Note that these numbers include estimates of the eventual results of multi-stage caucus processes which will be refined as the later stages occur.
So it appears that the last 34 delegates from Super Tuesday, a handful each from Georgia, Ohio and Tennessee, have been determined. 17 more to Romney, 8 more to Gingrich and 5 more to Santorum. But wait, that is only 30! Well, according to Green Papers, 4 of the 63 delegates that were up for grabs in Ohio end up officially “Uncommitted”, which (I think) means we won’t actually know which way they may go until we know which actual human beings end up being those delegates and those people say publicly who they plan on supporting (which they may or may not actually do before the convention).
All in all, today’s results are once again a win for Romney. He got 56.7% of today’s delegates, which was way more than the 48.5% he needed to continue to move closer to the nomination rather than further way. His “% of remaining needed to win” drops now to 48.4%. For the other candidates, the effect on the other side is more dramatic. Santorum is still in 2nd place, but his “% of remaining needed to win” moves up from 64.5% to 65.5%. Romney may not yet be rapidly moving toward cinching the nomination, but the non-Romneys are rapidly moving toward being mathematically eliminated.
Looking at the non-Romney’s for a minute, the next few states are expected to favor them. Perhaps Santorum will win some. Perhaps Gingrich will win some. But to actually be on a pace to win, Santorum has to not just win a state, but win by a huge margin, getting more than 65.5% of the delegates. For Gingrich it is even worse, he would need to win getting 67.8% of the delegates. (For completeness, Paul would need to get more than 71.7%.)
Even with Romney expected to not be strong in these states, with four candidates in the race, you don’t expect anybody to be able to pull that kind of level except in winner take all (or winner take almost-all) states. Of the next few coming up… in Kansas, Guam, Northern Marianas, Virgin Islands, Alabama, Mississippi, Hawaii and American Samoa there are as usual complicated delegate rules (and the territories might only select uncommitted delegates), but none of them are straight up winner takes all. (Some allow for certain situations that could lead there though.) Bottom line, 65.5% (or more) is a pretty big ask and seems unlikely.
Which means that even if Santorum or Gingrich win some states (as expected) in terms of delegates they will almost certainly still both be heading closer to mathematical elimination rather than closer to the nomination. The big thing to look at will once again be looking at how well the non-Romney’s collectively block Romney from getting the 48.4% of the delegates he needs to be closing in on the nomination himself. With strong performance by the non-Romney’s in the next few contests, they may well be able to achieve this, even if they don’t actually help themselves individually.

Chart from the Abulsme.com 2012 Republican Delegate Count Graphs page. When a candidate gets down to 0%, they have cinched the nomination. If they get up past 100%, they have been mathematically eliminated. Rather than the date on the x-axis, we show the “% of Delegates Already Allocated” as this better represents the progress through the race. Note that these numbers include estimates of the eventual results of multi-stage caucus processes which will be refined as the later stages occur.
So, Super Tuesday happened. As of this update, Green Papers has “called” 385 of the 419 delegates available from the Super Tuesday contests. There are 34 delegates that haven’t been determined yet that will result in updates later, but of the ones we do know, the estimates for Super Tuesday contests are: Romney 208, Santorum 84, Gingrich 72, Paul 21. Romney also picked up a Superdelegate, bringing the total for the day to Romney 209, Santorum 84, Gingrich 72, Paul 21.
Compared to the Sabato Crystal Ball projections which we used to game out Super Tuesday over the weekend, Romney performed better than expectations, as did Gingrich. Santorum and Paul underperformed compared to those predictions. In any case, where does this put us…
Bottom line, Romney is the big winner today, and this may be the start of him actually pulling away and heading toward the nomination, but he is still not out of the woods in terms of the danger of being blocked from 1144. Lets look at the details.
The situation for Santorum, Gingrich and Paul is essentially what I mapped out in the gaming Super Tuesday post. To paraphrase what I said there, it is now absolutely undeniably clear (although the trend was obvious even before today) that none of these three guys are on a path to the nomination. Of the three, Santorum is doing the best, but with today’s numbers, to be on a path to win, he would need to now get 64.5% of the remaining delegates, compared to the 21.1% he has gotten so far. For this to even come into the realm of possibility, Gingrich and Paul would both have to stop getting delegates, Santorum would have to pick up all of their support, AND something would need to happen to cause support for Romney to plummet. This is a very unlikely sequence of events. It isn’t going to happen.
Oh, I guess I should also note that Gingrich pulled back ahead of Paul for 3rd place.
The remaining question is: “Are the non-Romney’s collectively still in a position to potentially block Romney from getting to 1144?” If after today, Romney was under 50% of the total delegates, and his “% of remaining needed to win” was heading upward or flat, this is a possibility that would be looking like it was still very much in play. But Romney exceeded the 49.7% of delegates he needed in order to be on track toward 1144, and did it by a decent margin. Of the delegates in today’s total, he picked up 209 of 386, or 54.1%. This reduced his “% of remaining needed to win” from 49.7% to 48.5%. That means to block, the non-Romney’s collectively need to be getting 51.5% of the delegates, compared to the 46.9% they have managed so far. So they have to do better than they have been so far, and by a non-trivial margin. And they have do do this even though it is obvious none of them can win outright. It has to be about stopping Romney.
Now, the rest of March has a bunch of states that are supposed to be relatively good for the non-Romneys. So the non-Romney’s managing to get 51.5% in the next few state is very much within the realm of possibility. After that we hit more Romney friendly states in April. The thing to watch for in the upcoming states is not who wins the popular vote, or even the delegate count. The question will be: “Is Romney continuing to get enough delegates to avoid being blocked?” Right now, that magic number is 48.2%. As long as he is getting 48.2% of the delegates (or more) then he is marching his way toward the nomination. If he gets less than that, then blocking will remain possible a little bit longer. If the rest of March really is friendly to the non-Romneys, we may see that Romney’s “% needed to win” starts heading back up a bit before Romney hits friendly states again and starts fully pulling away. As long as we see that happening, blocking Romney is still a possibility. And indeed, if Romney is damaged by the contests in March and his April states start looking not so good after all, then blocking starts looking more real again.
But Romney’s “% of remaining needed to win” is the smallest it has been so far, and none of the other candidates have realistic shots at winning, only a shot at blocking that relies on them continuing to win delegates even though it is obvious they can’t win, so Romney is in a pretty good position right now. Watch that line though. Until it starts heading downward decisively, Romney hasn’t got it wrapped up just yet.
So what is next? Well, first, the last 34 delegates from Super Tuesday (they are from Georgia, Ohio and Tennessee). Then on Sunday we have Kansas (40), Guam (9), Northern Marianas (9), Virgin Islands (9). Then Tuesday we have Alabama (50), Mississippi (40), Hawaii (20), American Samoa (9). And then it goes on and on…
| In the latest Curmudgeon’s Corner…
Sam and Ivan talk about:
- WA Caucuses
- Super Tuesday Predictions
- Human Computer Interactions / Data Speeds and Usage
Just click to listen now:
[wpaudio url=”http://www.abulsme.com/CurmudgeonsCorner/cc20120304.mp3″ text=”Recorded 4 Mar 2012″]
or
1-Click Subscribe in iTunes
View Podcast in iTunes
View XML Feed |
|
|
|


