This is the website of Abulsme Noibatno Itramne (also known as Sam Minter).
Posts here are rare these days. For current stuff, follow me on Mastodon
|
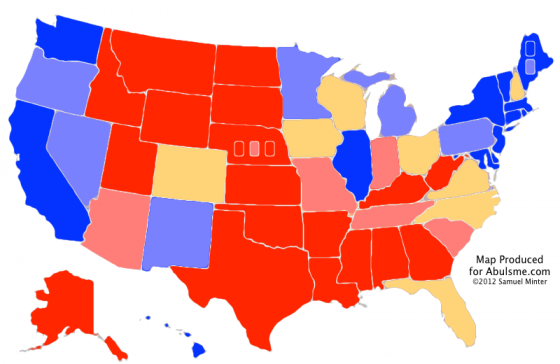
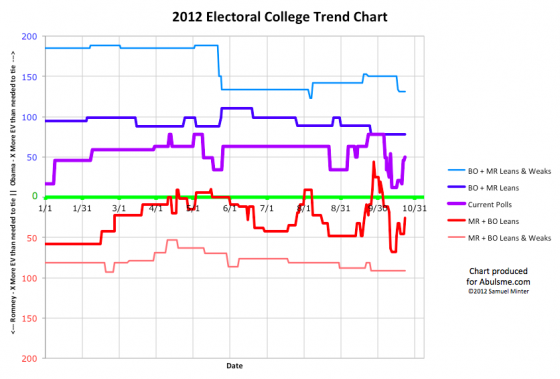
Two states changing categories today, both moving toward Obama. Both Romney’s “Best Case” line and the “Current” line reflecting the current lead in the polls, have now moved significantly back toward Obama since Romney’s peak around October 12th. These gains are still somewhat tenuous for Obama, which we’ll get into in a bit. For the moment though, lets look at the individual states:
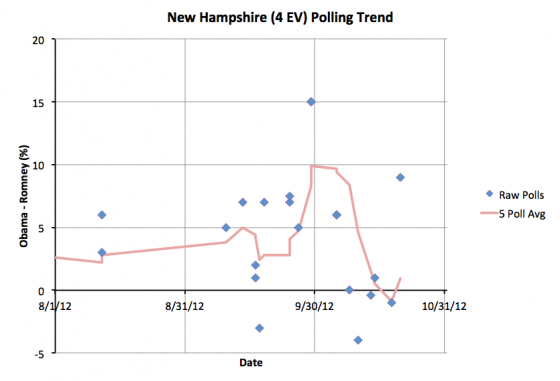
First up New Hampshire. Just three days ago Romney pulled into a slight lead in my five point average in New Hampshire. The very next poll pulls the average back over to Obama’s side of the fence. Having said that, the new poll, showing a 9% Obama lead, looks like it might end up as an outlier. We’ll need more polls to determine if there is real movement, or just noise. Even with that point Obama only has a 0.9% lead. So New Hampshire is still very close. A little on one side of the line versus a little on the other side of the line really doesn’t change all that much.
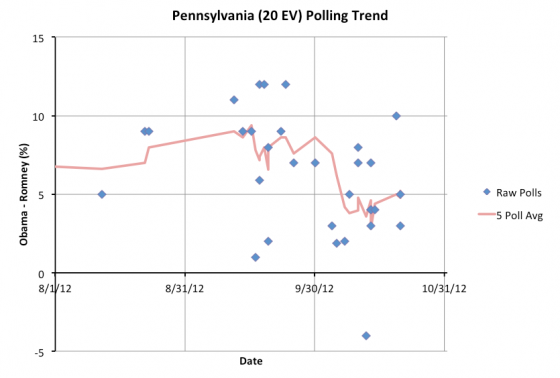
In Pennsylvania a couple of days ago what seemed like an outlier in Romney’s favor aged out of the five poll average. Today it was replaced by what looks like an outlier in Obama’s favor. This is enough to bring Obama’s lead to 5.2% in Pennsylvania. That is enough for me to move Pennsylvania to “Weak Obama” and take out of Romney’s best case scenario. As with New Hampshire’s move, this move is influenced by a poll that smells a little like an outlier. So don’t be surprised if Pennsylvania slips back under the 5% mark as more polls come in.
So where does this put the summary:
|
Romney |
Obama |
| Romney Best Case |
295 |
243 |
| Current Status |
219 |
319 |
| Obama Best Case |
191 |
347 |
This looks pretty good for Obama, right? He’s building his lead back in, and slowly but surely undoing the damage from that first debate? Just looking at the charts, it looks like on the “current” line, Obama is about half way back to his peak at the end of September. On the “Romney’s best case” Obama’s gained back about a third of his losses. In terms of these numbers, Obama is better off than the spot at the end of August where I had once called a Romney peak.
At that point in time I mentioned that even at that Romney peak, Obama was in a very solid position. Romney would have to flip a whole bunch of states where Obama was ahead in order to win. It was a tall order. Since we’re right there again, so Obama is pretty solid, right?
Right? Well on the surface. But looking at that alone hides a bit. The key is that a lot of the states that are on Obama’s side of the winning line are just BARELY there. So lets look again at all of the close states:
- North Carolina (15 ev): 2.0% Romney lead
- Virginia (13 ev): 0.2% Romney lead
- Florida (29 ev): 0.4% Obama lead
- New Hampshire (4 ev): 0.9% Obama lead
- Ohio (18 ev): 1.2% Obama lead
- Colorado (9 ev): 1.2% Obama lead
- Iowa (6 ev): 2.2% Obama lead
- Wisconsin (10 ev): 3.8% Obama lead
My line is always that anything under a 5% lead can easily disappear with essentially no notice. Of the 8 states with margins under 5%, five are actually closer than 2%. Three are closer than 1%! These are a bunch of really close states that really could flip back and forth.
With all the states he is ahead in, Obama wins 319 to 219. That is 50 electoral votes more than he needs to win! But if you just get a 1.3% uniform move in the polls across the close states, then Florida (29 ev), New Hampshire (4 ev), Ohio (18 ev) and Colorado (9 ev) all flip to Romney. That is 60 electoral votes. With that 2% move, Romney wins 279 to 259.
1.3% is not a big move. Obama has the lead. But barely. A stupid statement at a critical time. A random mistake that comes off badly. Some national or international news that just doesn’t reflect well. Changes in enthusiasm that causes Democrats to turn out less than Republicans. Any of those could move things by 1.3%. 1.3% is nothing. 1.3% can evaporate almost instantly if the right things happen.
The movements since the second debate have been mainly in Obama’s direction. Consensus seems to be that Obama also “won” the third debate. After the disaster in the first debate the Obama campaign seems to have hit their stride again. Things seem to be moving in their direction. If that continues for the next two weeks through election day, Obama should end up with a pretty comfortable victory. If things hold steady, or if Romney has a few good news cycles, then we may indeed end up waiting up late on election night to resolve a tight election in Ohio that will determine the outcome of the election.
Note: I finished my daily scan of polls a little over 10 hours prior to making this post, so new polls announced since then will be reflected in tomorrow’s update rather than today’s. I normally try to make the blog post right after finishing the scan on days where states change categories, but this time I just needed to get a little sleep in between. Sorry about that. :-)
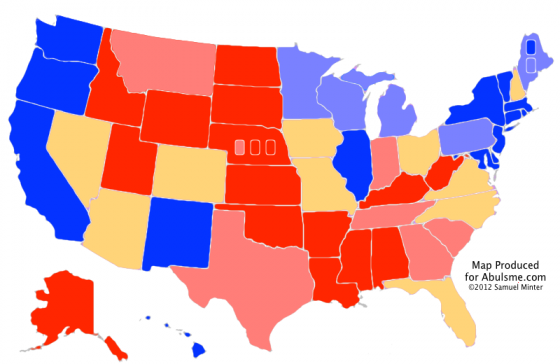
Note: Chart and map from the Abulsme.com 2012 Electoral College Prediction page. Both assume Obama vs Romney with no strong third party candidate and show polling as it currently exists. Things will change before election day. On the map red is Romney, blue is Obama, gold states are too close to call. Lines on the chart represent how many more electoral votes a candidate would have than is needed to tie under several different scenarios. Up is good for Obama, Down is good for Romney.
[Edited 2012 Oct 23 22:12 to add final note, fix a wording error, and correct a mistake where I had 2.0% in a place that should have said 1.3%.]
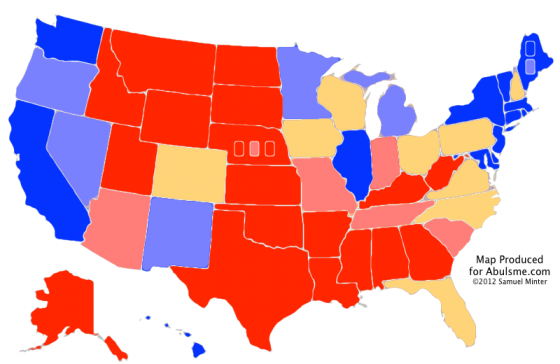
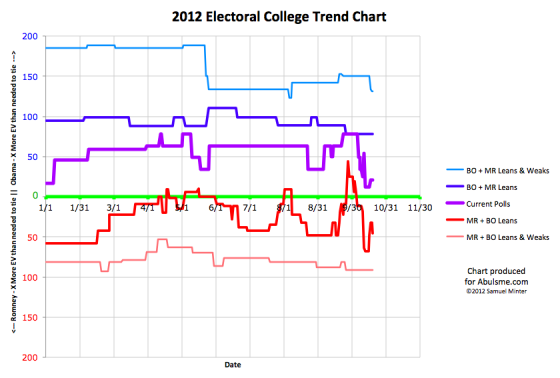
Two states move today, one toward Obama, one toward Romney. As usual, in order of Electoral College strength:
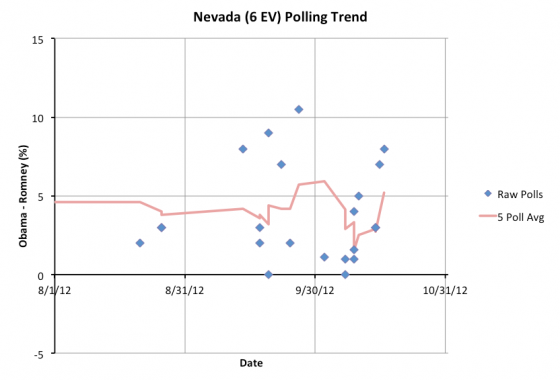
In the last three months Nevada has usually been “Leaning Obama”, meaning Obama has the advantage, but not by very much. In September Obama’s lead headed higher for a little bit, then dove again after the debates. Now it heads up again, with Obama’s lead in the five poll average now at 5.2%. Given this, Nevada now is classified as “Weak Obama” meaning it would take a pretty significant move for Romney to take the lead and win the state. So Nevada is no longer included in Romney’s “best case” scenario.
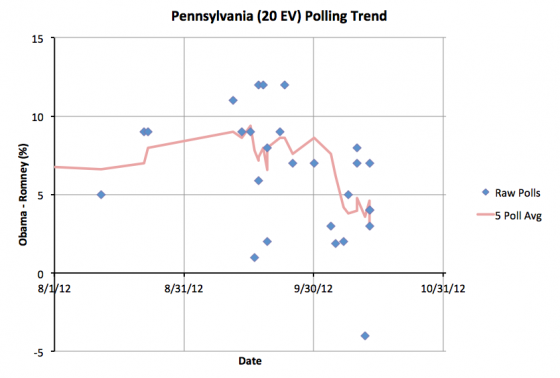
Pennsylvania is a bit odd. Three days ago Obama’s lead topped 5% in the five poll average. But today we add a new poll that arrived out of order. It was still in the five most recent polls by the last day of polling, so it counted as a “recent poll” for us, but it was also the first poll since February showing Romney ahead in Pennsylvania, and showing him ahead by a relatively substantial 4% at that. This is way out of line with other recent polling in the state, so certainly LOOKS like an outlier. Especially since by the time it was released there were already polls taken after it that did not show that kind of movement.
But I don’t do any outlier removal here. I just let the five poll average do what the five poll average does. For the moment, this means that Obama’s lead in Pennsylvania is now down 2.8%, with the peak above 5% erased. Because this was still a “current poll” I do not retroactively adjust the overall historical trend however.
This potential outlier is now the 5th oldest poll I have in Pennsylvania, so it will age out with the very next Pennsylvania poll. Pennsylvania may or may not pop back to “Weak Obama” at that point depending on the results of that next poll.
So this puts Pennsylvania back in play, with the possibility of Romney winning the state now back in his best case scenario.
Which brings us to the updated summary:
|
Romney |
Obama |
| Romney Best Case |
301 |
237 |
| Current Status |
248 |
290 |
| Obama Best Case |
191 |
347 |
We still have a close race. Obama is ahead, but Romney only needs to pull 21 more electoral votes over to his side to win.
Right now the easiest way to get there is to hold North Carolina (15 ev, 3.8% Romney lead), Virginia (13 ev, 2.6% Romney lead), Florida (29 ev, 0.4% Romney lead) and then to pull ahead and take New Hampshire (4 ev, 0.5% Obama lead) and Ohio (18 ev, 2.8% Obama lead).
There are many other combinations that will do it too. That just looks like the easiest to me at the moment.
Note: Chart and map from the Abulsme.com 2012 Electoral College Prediction page. Both assume Obama vs Romney with no strong third party candidate and show polling as it currently exists. Things will change before election day. On the map red is Romney, blue is Obama, gold states are too close to call. Lines on the chart represent how many more electoral votes a candidate would have than is needed to tie under several different scenarios. Up is good for Obama, Down is good for Romney.
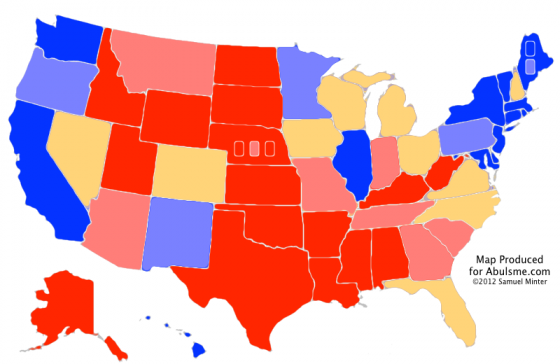
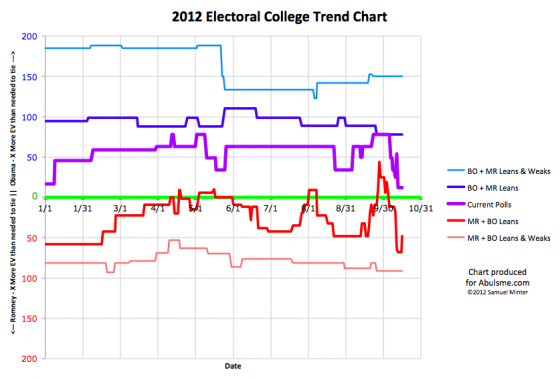
After a few days with no changes, one state changes categories today and hey, for the first time in awhile, the movement is toward Obama:
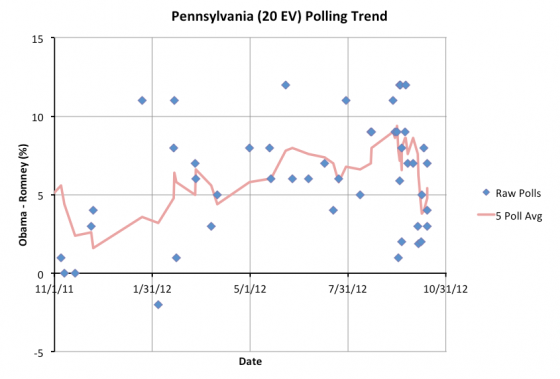
Obama’s lead in Pennsylvania in my five poll average peaked at 9.4% back in mid-September. On the eve of the first debate, this was down to 8.6%. By October 11th, that lead had dropped to 3.8%. Romney actually made Pennsylvania close… but since then the polls have started looking better for Obama again, and the five poll average rises back up to a 5.4% Obama lead. This pulls the state back out of my swing state category and into the “Weak Obama” category, but just barely.
Note that even in the dip, not a single poll showed Romney ahead in Pennsylvania. The last time any poll showed Romney ahead in Pennsylvania was way back in February. Although Obama’s lead dipped in Pennsylvania in the post-debate period, a Romney win here seems pretty unlikely if this is indeed the end of the downward post-debate trend. There are too few polls as of yet to know if this is an actual reversal of the recent trend, or if it is just the polls being jittery.
For the moment though, the five poll average pulls the state out of Romney’s best case:
|
Romney |
Obama |
| Romney Best Case |
317 |
221 |
| Current Status |
257 |
281 |
| Obama Best Case |
191 |
347 |
Romney’s best case is 20 electoral points weaker, but his overall position is still way better than it has been for most of the year. Obama is still ahead. Romney has still never actually pulled ahead in the electoral college analysis. But it is close. It is still very close.
The question remains what it has been for at least the last few days… Has Romney peaked? Or can he pull a little more support in his direction? Right now Romney is behind, but barely. Just a LITTLE more movement in his direction would have him in the lead. But the first debate had already caused a very large movement compared to where the race stood for most of the year. Is there really room for more movement? Or has Romney hit a ceiling?
The move toward Obama in Pennsylvania may well be the start of a more general reversion in the polls to something more like the Obama leads we’ve seen most of the year. Or it might not. Too soon to tell.
But with the second presidential debate in less than 16 hours, whatever trends may have been underway up through today will get replaced by reactions to the new news cycle. If Obama puts in another sub-par performance, maybe he drops further and Romney takes the lead. If so, Obama is in real trouble.
Otherwise, with an “OK”, “Good” or “Great” performance from Obama, we’ll probably start to see some more Obama gains in the polls as those who moved away from him in the last two weeks think to themselves “OK, maybe he’s not that bad after all.” In that case, Obama retains his position as favorite, and maybe even starts making it look inevitable again if he does really well.
So… debates almost never make a difference, except when they do… and this next debate is another critical one.
So we’ll see what happens…
Note: A poll added today in North Carolina that were older than the “last five” changed the date North Carolina last moved from Lean Obama to Lean Romney from October 4th to October 8th. The historical trend chart has been adjusted starting with today’s update.
Note: Chart and map from the Abulsme.com 2012 Electoral College Prediction page. Both assume Obama vs Romney with no strong third party candidate and show polling as it currently exists. Things will change before election day. On the map red is Romney, blue is Obama, gold states are too close to call. Lines on the chart represent how many more electoral votes a candidate would have than is needed to tie under several different scenarios. Up is good for Obama, Down is good for Romney.
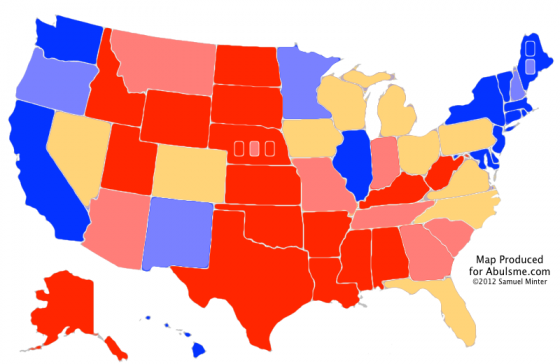
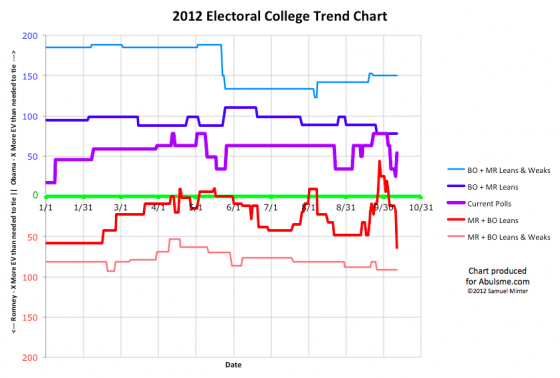
In terms of the categories I use to classify states based on the average of the last five polls, today was another brutal day for Obama. It just keeps getting worse. There had been some talk about the “bump” from the debate having bottomed. I’m just not quite seeing it yet. One state does move in Obama’s direction today, and I’ll get to that, but for the most part the theme today is states that had once looked pretty safe for Obama now once again looking competitive.
So lets look at the states, from smallest to largest in the electoral college:
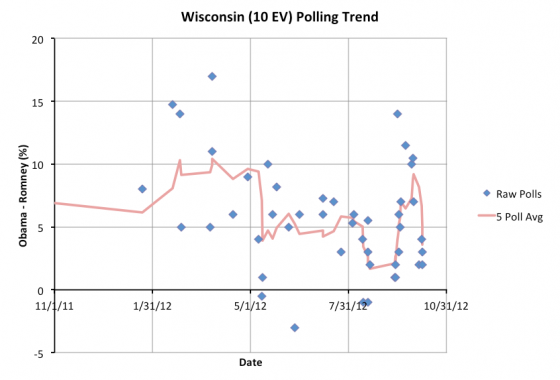
Immediately before the debate, Obama’s lead in Wisconsin stood at 9.2%. As of today’s update, it has dropped to a 3.6% lead with 4/5 polls now from after the debate. Huge drop. This of course puts Wisconsin back in “Lean Obama” territory, meaning Obama is ahead, but by a small enough margin it is easy to imagine Romney taking the state. Wisconsin has been in this category before of course. But it is a big change from the time period right before the debate.
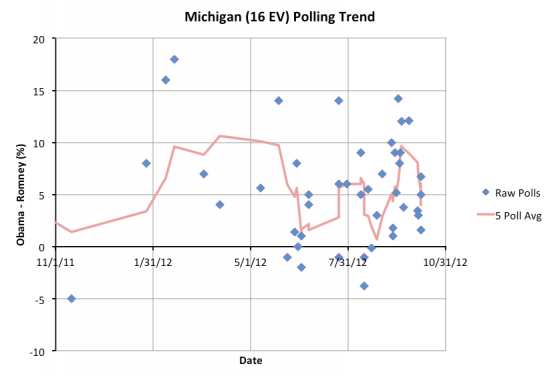
Michigan looks pretty similar to Wisconsin. Right before the debate Obama had a 9.0% lead. Now he has a 4.0% lead with all five polls in the average after the debate. So Michigan also returns to “Lean Obama” and I include a win here in Romney’s best case.
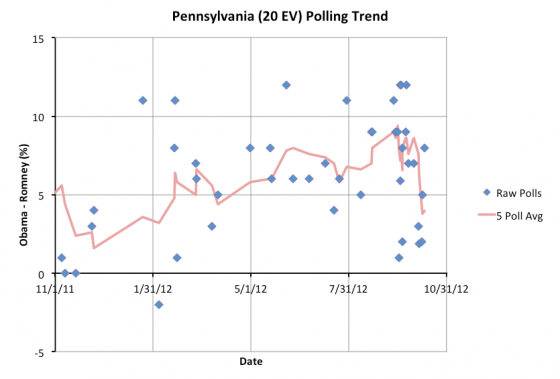
Does the pattern look familiar? Before the debates, Obama had a 8.6% lead in Pennsylvania. Now with all five polls in the average after the debate, Obama’s lead is down to 4.0%. So Pennsylvania also comes within reach for Romney. Yes, he is still behind. In all three of these states. But they are all close. Another bad new cycle for Obama, and seeing these states move over to Romney does not seem impossible.
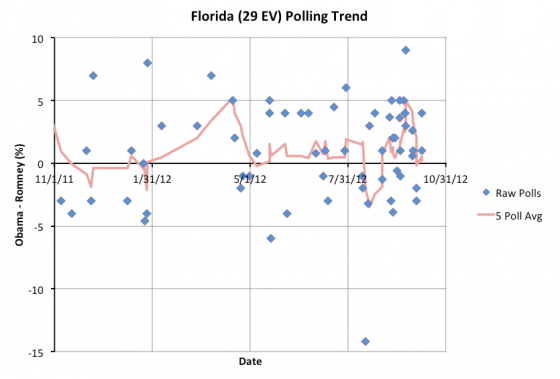
The one move toward Obama today is the biggest state moving today, but Obama folks should not get too excited. The five poll average for Florida moves from a 0.2% Romney lead yesterday to a 0.2% Obama lead today. Those margins are negligible. Either way, Florida is incredibly close and could very easily go either way. Before the debates Obama had a 3.2% lead in Florida, so his drop has not been as large here as elsewhere. But in a state this big and this close, every little bit counts.
Florida is hyper close, but I have to classify it somewhere, and for the moment, for today, it goes back into the Obama column, where it has been most of the year. Just barely.
Which brings us to the new summary of the race:
|
Romney |
Obama |
| Romney Best Case |
333 |
205 |
| Current Status |
215 |
323 |
| Obama Best Case |
191 |
347 |
Romney’s best case is better than it has been all year. He beats his post-primary peak from the beginning of September, and he even passes all time peak from January. Obama’s lead in state after state has just been washed away in the aftermath of the first debate. Obama is still ahead in these states for the most part… but what once had been substantial leads are now very narrow.
This is clearly not where Obama wanted to be right now.
Now, the current status does improve for Obama compared to yesterday because of Florida flipping categories, but as I mentioned above, the margin in Florida is essentially zero. So the difference between today and yesterday isn’t really substantive on that front. Either way, Florida is a toss up at the moment.
So to try to get a little more insight, although I won’t do this every time, lets once again look at the actual current margins in all of the close states to see how they rank. With just the states he is ahead in by more than 5%, Romney starts out with 191 electoral votes. From there Romney needs 78 more electoral votes to tie, 79 to win.
Ranked in order of current polling, these are the current “close” states:
- North Carolina (15 ev): 3.5% Romney lead – 2/5 polls after debate
- Colorado (9 ev): 0.7% Romney lead – 5/5 polls after debate
- Florida (29 ev): 0.2% Obama lead – 4/5 polls after debate
- Nevada (6 ev): 1.6% Obama lead – 5/5 polls after debate
- Ohio (18 ev): 2.2% Obama lead – 5/5 polls after debate
- Virginia (13 ev): 2.2% Obama lead – 5/5 polls after debate
- Iowa (6 ev): 3.2% Obama lead – 1/5 polls after debate
- Wisconsin (10 ev): 3.6% Obama lead – 4/5 polls after debate
- Pennsylvania (20 ev): 4.0% Obama lead – 5/5 polls after debate
- Michigan (16 ev): 4.0% Obama lead – 5/5 polls after debate
That is a lot of “close” states. Before the debate, we were down to just a handful of close states. No more.
Anyway, if Romney pulls those states toward him “evenly” then a move of just over 2.2% more in his direction would get him all the states through Virginia on the list above, which would give him an over all win.
Obama is still ahead. It is worth repeating that. But this race is so much closer than it was before the first debate. And Romney has so many more “paths to victory”. The easiest route is though Florida, Ohio and Virginia. But there are now many more options available as well.
Are we now at a ceiling for Romney though? Has he picked up about all of the “persuadable” votes that he can? Is there really headroom to move higher? If not, then it still isn’t enough. Obama will win.
If the Obama folks screw up more, and the Romney folks effectively capitalize on it though… then maybe Romney ends up with more room to go up further.
The next event expected to have the potential to move numbers is of course the Vice Presidential debate… a few hours from the time I am posting this update. We probably won’t really start seeing any move from that debate in the state polls for a few days, but this is probably one of the last moments we’ll really be able to look at the poll numbers and attribute the motion directly to the first debate. Starting with the VP debate, things get more muddled again, and more factors are at play.
But looking at things right now, it is clear that the debate had a devastating short term effect. It was NOT enough to put Romney in the lead when you look at the electoral college. But it was enough to take what looked like an insurmountable lead for Obama and turn it into a tight race. The big question now is does it stay a close race, or does Obama start to claw back his previous lead. Or… of course the third option… does Romney/Ryan score some more big blows and actually start taking the lead in this race.
Note: Chart and map from the Abulsme.com 2012 Electoral College Prediction page. Both assume Obama vs Romney with no strong third party candidate and show polling as it currently exists. Things will change before election day. On the map red is Romney, blue is Obama, gold states are too close to call. Lines on the chart represent how many more electoral votes a candidate would have than is needed to tie under several different scenarios. Up is good for Obama, Down is good for Romney.
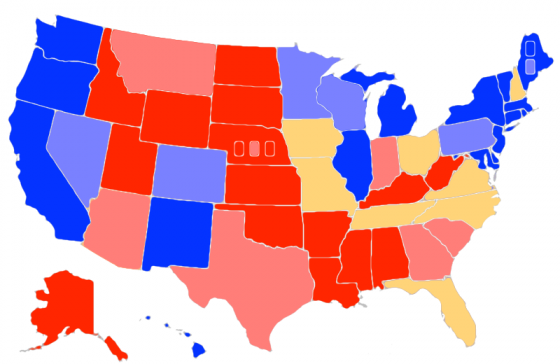
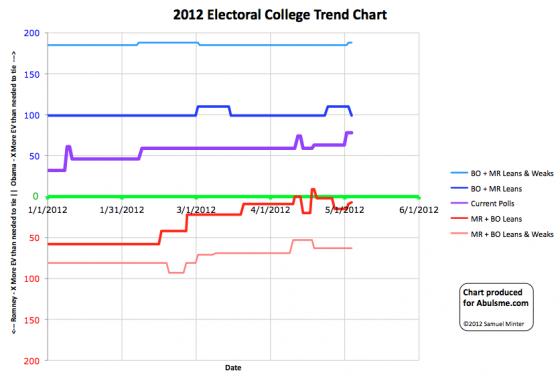
Chart and map from the Abulsme.com 2012 Electoral College Prediction page. Both assume Obama vs Romney with no strong third party candidate. Both show polling as it currently exists. Things will change before election day. On the map red is Romney, blue is Obama, gold states are too close to call. Lines on the chart represent how many more electoral votes a candidate would have than is needed to tie under several different scenarios. Up is good for Obama, Down is good for Romney.
Today is an exciting day. THREE states change categories.
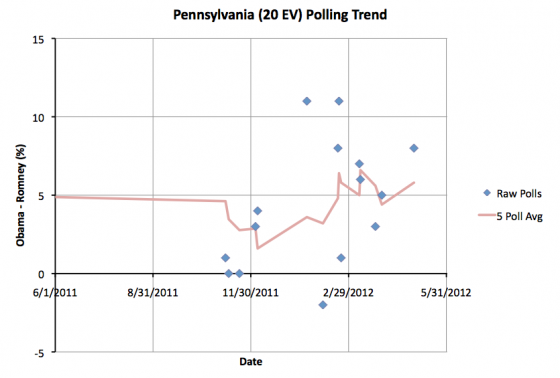
First up, Obama’s lead in Pennsylvania moves over 5%, so we pull it out of swing state status again. We’d listed Pennsylvania as a swing state since April 14th. The five poll average now has Obama up by 5.8%. This is still pretty close to the boundary, so a poll or two in Romney’s direction could pull Pennsylvania back, but for now we no longer consider Romney winning PA in our “Romney Best Case” scenario.
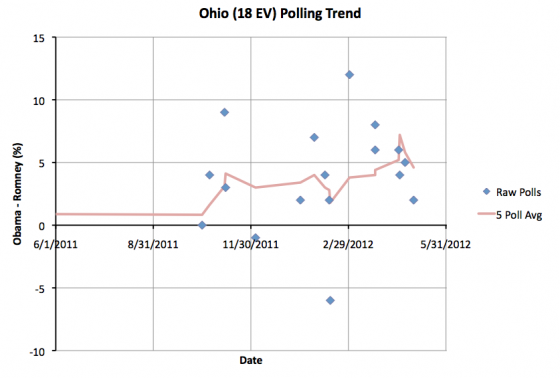
Second, Ohio gets tighter. Obama’s lead drops to 4.6%, which means I consider it a swing state again, and Romney’s best case scenario now includes Ohio. Ohio has usually been considered a swing state, and our five poll average only showed a greater than 5% lead for Obama from Apr 20 until today… two weeks. So this is a return to Ohio’s “normal” status. Ohio (18 ev) moving back toward Romney balances the Pennsylvania (20 ev) move, so the overall loss to Romney’s best case is only 2 electoral votes.
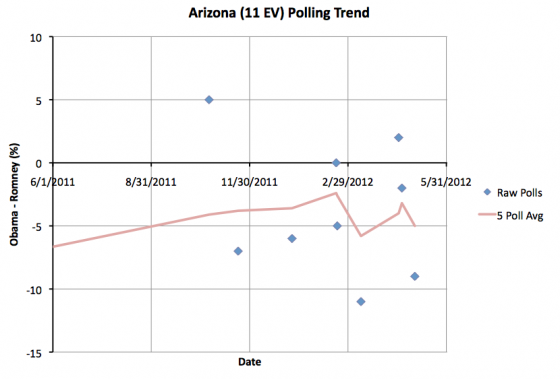
Third, Arizona moves back toward Romney. There has been talk of Arizona being a red state that Obama may be able to pick off and win. For the moment though, that looks less likely. According to my definition, I consider states to be swing states if the lead in the five poll average is LESS than 5.0%. At the moment the five poll average in Arizona is EXACTLY a 5.0% Romney lead, so the state moves back into “Lean Romney”. So I take winning Arizona off the table for Obama. At least for the moment. One poll could bring it back.
Between all three of these changes, the net affect is to narrow the range of possibilities between our Obama best case and Romney best case scenarios. Obama’s best case is worse by 11 electoral votes, and Romney’s best case is worse by 2 electoral votes.
|
Romney |
Obama |
| Romney Best Case |
276 |
262 |
| Current Status |
191 |
347 |
| Obama Best Case |
170 |
368 |
Romney’s best case remains very narrow. In order to win the presidency, he needs to win all of the states where he is currently ahead, including Tennessee (11 ev) and Missouri (10 ev) where polls currently show his lead is slim, then he MUST win Florida (27 ev), Ohio (18 ev), North Carolina (15 ev) and Virginia (13 ev), all of which are states where Obama is currently ahead by a narrow margin. Then he needs to win either Iowa (6 ev) or New Hampshire (4 ev) both of which are also leaning Obama at the moment.
Edit 2012 May 4 18:07 UTC – Corrected map, I had forgotten to color Ohio gold.
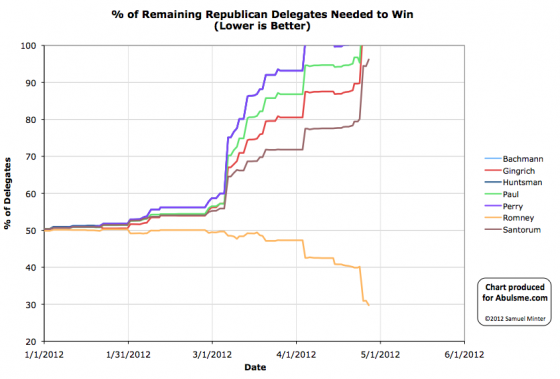
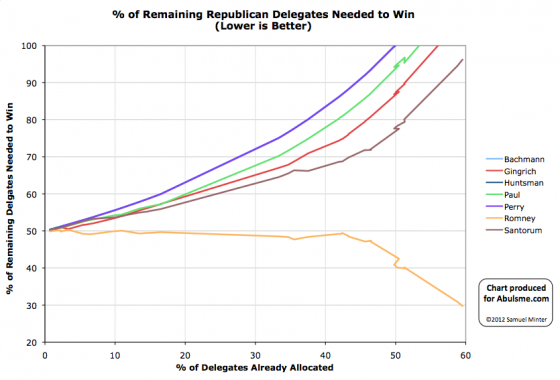
Charts from the Abulsme.com 2012 Republican Delegate Count Graphs page. When a candidate gets down to 0%, they have clinched the nomination. If they get above 100%, they have been mathematically eliminated. The first chart is by date, the second is by “% of Delegates Already Allocated”. These numbers include estimates of the eventual results of multi-stage caucus processes which will be refined as the later stages occur.
First of all, I just updated Wednesday’s post to add a correction. I had made the mistake of doubting Green Papers. I thought they had missed a delegate in their count. In fact, I had misinterpreted their statement about the change. I read their new total as a delta from the election, leading me to add an extra non-existant delegate to Romney’s total in Pennsylvania. My bad. Not theirs. Worse, my first draft of Wednesday’s post actually had it right, but I switched it to the wrong answer right before posting. Bleh. Today’s updates build off the corrected numbers for Wednesday rather than the original incorrect numbers I posted. (OK, it was only off by one delegate, which is tiny in the big scheme, but still, I’m annoyed at myself. :-) ) Anyway…
Three states with updates today, all via Green Papers as usual:
- Pennsylvania: Continued updates as more sources get indication on the preferences of the delegates elected in Pennsylvania. The previous Pennsylvania totals, after my correction mentioned above, had been… Romney 11, Paul 5, Gingrich 4, Santorum 3, 49 TBD. They are now Romney 27, Paul 5, Gingrich 3, Santorum 3, 34 TBD. Net for the day… Romney +16, Gingrich -1.
- Colorado: 2 delegates previously listed as uncommitted move to the Paul column. Net for the day, Paul +2. New total for the state Romney 14, Santorum 6, Paul 2, 14 TBD.
- Virgin Islands: 1 previously uncommitted delegate moves to the Romney column. So Romney +1
So total for the day: Romney +17, Paul +2, Gingrich -1
In terms of “% of remaining delegates needed to win”:
- Romney: 31.0% -> 29.7%
- Santorum: 94.4% -> 96.2%
More updates from Pennsylvania and other locations as they come in. Next batch of actual contests are North Carolina, Indiana and West Virginia on May 8th. I’m guessing Romney will get the 29.7% of delegates he needs there. Yawn.
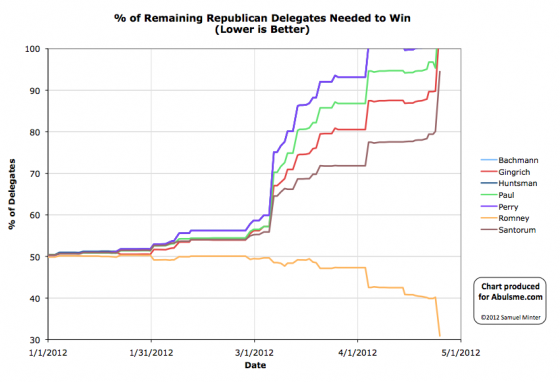
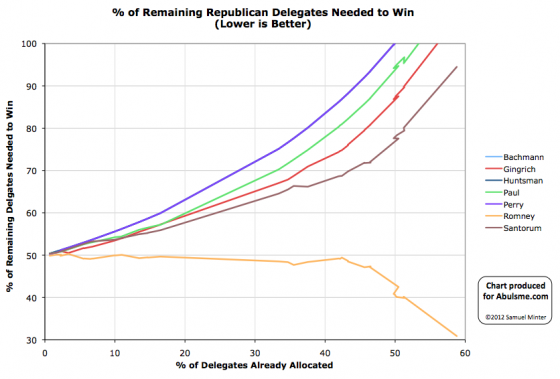
Charts from the Abulsme.com 2012 Republican Delegate Count Graphs page. When a candidate gets down to 0%, they have clinched the nomination. If they get above 100%, they have been mathematically eliminated. The first chart is by date, the second is by “% of Delegates Already Allocated”. These numbers include estimates of the eventual results of multi-stage caucus processes which will be refined as the later stages occur.
First big primary day in awhile, and of course Romney dominates.
- New York: Romney gets all 92 delegates from today. Total in NY now Romney 94, Gingrich 1
- Pennsylvania: This is the only tricky one of the day. Delegates were elected by name, not by presidential preference. So they are all officially uncommitted, but in general these delegates do support someone, it just takes more work to figure out who. Green Papers’ initial estimate from the primary is Romney +11, Paul +5, Gingrich +4, Santorum +3, and 39 uncommitted or unknown. That is obviously a lot of uncommitted/unknown, so there will probably be future updates as the preferences of those delegates become known. Also 10 at-large delegates won’t be chosen until June and two superdelegates have yet to publicly express a preference. The total in PA is now Romney 12, Paul 5, Gingrich 4, Santorum 3, TBD 48. (GP has Romney 11, TBD 49, but I think they forgot the one Romney superdelegate.)
- Connecticut: Romney wins all 25 delegates from the primary. New CT total: Romney 26, TBD 2
- Rhode Island: Romney gets 12 delegates from the primary, Paul gets 4. New RI Total: Romney 15, Paul 4
- Delaware: Romney gets all 17 delegates from the primary. No delegates had been allocated previously and none are left, so total is just Romney 17
So, for the day… Romney +157, Paul +9, Gingrich +4, Santorum +3. Romney gets 90.8% of the delegates today. Way more than the 40.2% he needed to stay on track to get to 1144.
And with this, Ron Paul and Newt Gingrich are both mathematically eliminated. More specifically, if they were now to get 100% of the remaining delegates they would still not get to 1144. In order to get to 1144, they would actually need to take delegates away from the other candidates, either through final results in caucus states being better for them than earlier estimates, or through actual defections. Both are possible. However, neither will happen in large enough numbers to change anything, absent something catastrophic that causes Romney to actually drop out. Uh, which is highly unlikely.
For the remaining two candidates, in terms of “% of remaining delegates needed to win”:
- Romney: 40.2% -> 30.9%
- Santorum: 80.1% -> 94.5%
So, theoretically Santorum could still catch up and win by getting 95% of the remaining delegates. Needless to say that won’t happen. His already long odds were made worse by suspending his campaign.
Meanwhile, neither Gingrich or Paul have suspended their campaigns. There are indications Gingrich might do so soon despite previous vows to stay in until Tampa. Paul has shown no signs of stopping.
The 31% of the remaining delegates Romney needs to wrap this up should be very easy for him to get. But we still have to wait for the calendar. So the march goes on…
Update 2012 Apr 27 12:34 UTC:
I was incorrect about the Pennsylvania count above and had misread Green Paper’s statement. In fact the new total in Pennsylvania was indeed Romney 11, not Romney 12. There were 10 new Romey delegates added to the count, not 11. They did not forget the one superdelegate. I just got twisted around thinking the 11 was a delta from the election instead of a new total, which would have left one delegate out. But it was indeed the new new total.
This makes the total for this day Romney +156, Paul +9, Gingrich +4, Santorum +3.
That gives Romney 90.7% of the delegates for the day instead of 90.8%.
This also changes Romney’s “% needed to win” to 31.0% instead of 30.9%. Santorum’s becomes 94.4% instead of 94.5%.
These changes are too small to be visible on the graph above, but will be reflected on future updates.
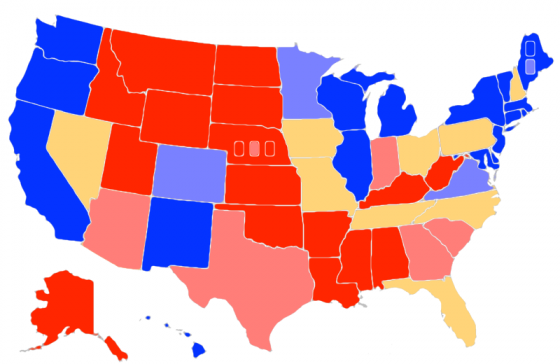
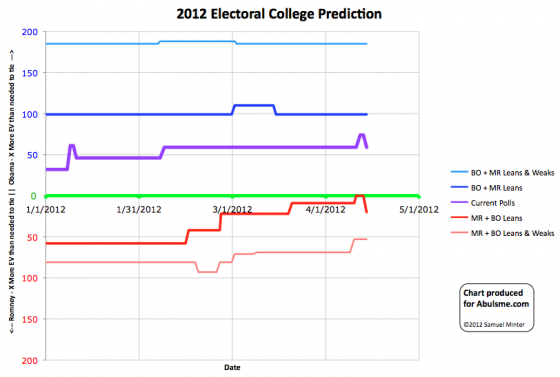
Map and chart from the Abulsme.com 2012 Electoral College Prediction page. Both assume Obama vs Romney with no third party strong enough to win states. Both show the polling situation as it currently exists. Things can and will change before election day. On the map Red is Romney, Blue is Obama, Gold States are too close to call. Lines on the chart represent how many more electoral votes a candidate would have than is needed to tie under several different scenarios. Up is good for Obama, Down is good for Romney.
As we have been saying for the last few updates, at some point the trend making things look better and better for Obama would come to an end. Today is that day. Two states change categories.
North Carolina: Only two days ago North Carolina moved from just barely Romney to just barely Obama in our five poll average. Well, a new poll there gets added today, and moves it back to just barely Romney. Easy come, easy go. In either case, it is really too close to call and counts as a swing state in our analysis.
Pennsylvania: The five poll average prior to today had Obama up by 5.6% in Pennsylvania. Today’s update drops Obama’s lead to 4.4% in the five poll average, which takes the state out of “Weak Obama” territory and back into too close to call swing state status. (5% leads can disappear overnight given the right events after all.)
The new summary becomes:
|
Romney |
Obama |
| Romney Best Case |
289 |
249 |
| Current Status |
210 |
328 |
| Obama Best Case |
170 |
368 |
The “best cases” are when a candidate wins ALL the swing states, not just the ones they are ahead in. “Current Status” is if everybody wins the states they are even a tiny bit ahead in.
Romney can once again win outright in his best case, not just tie and win in the House of Representatives.
Trendwise though, these are the first moves in Romney’s direction in almost a month. (The last time was March 16th when Arizona moved from being a swing state to Weak Romney.) So the question of course is: Does that mean we have just passed Obama’s high water mark and Romney will continue gaining ground for awhile?
My expectation is that we’ll have a bit more movement in Romney’s direction over the next few months as the general election is joined in earnest. This is natural as Romney is finally able to start crafting his general election message and, yes, moving toward “the center” to appeal to swing voters and swing states. Prior to a few days ago, he has had to concentrate on trying to get votes from Republicans… which is a very different game.
We shall see soon enough I guess. :-)
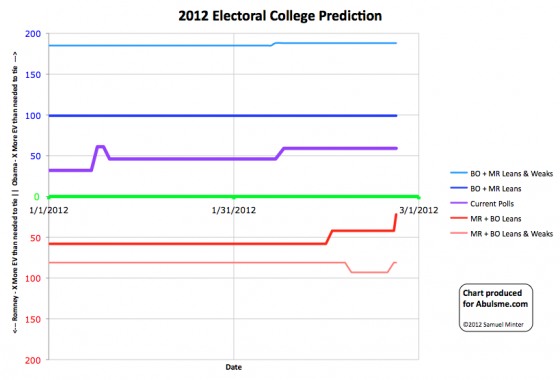
Chart from the Abulsme.com 2012 Electoral College Prediction page. Lines represent how many more electoral votes a candidate has than is needed to tie under several different scenarios. This chart reflects Obama vs Romney. If any other candidate takes the lead in the Republican delegate race we’ll switch to making charts for them.
This is a big one today. Obama’s 5 poll average in Pennsylvania is now more than a 5% lead. This means I take Pennsylvania out of swing state status. It is no longer “too close to call”, it is blue. This reduces Romney’s best case (win all the swing states scenario) to only a 291 to 241 win. It is still a win, but his best case is now a vey narrow win, only 22 electoral votes past the 269 needed to tie. That turns Florida into a “Must Win”, as without winning Florida, there is no longer a way to get to 269. (At least without reaching past the swing states and pulling back states where Obama is even further ahead.)
New summary:
|
Romney |
Obama |
| Romney Best Case |
291 |
247 |
| Current Status |
210 |
328 |
| Obama Best Case |
170 |
368 |
And new map…
Map from the Abulsme.com 2012 Electoral College Prediction page.
|
|


