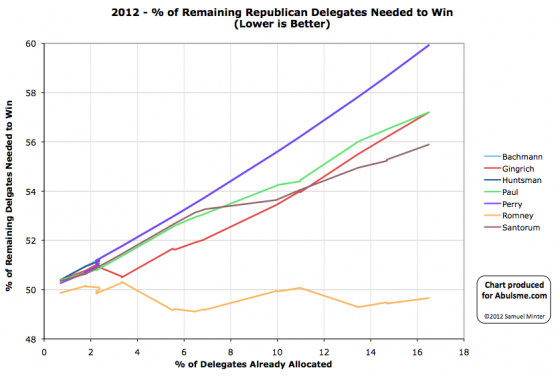
Chart from the Abulsme.com 2012 Republican Delegate Count Graphs page. When a candidate gets down to 0%, they have cinched the nomination. If they get up past 100%, they have been mathematically eliminated. Rather than the date on the x-axis, we show the “% of Delegates Already Allocated” as this better represents the progress through the race. Note that these numbers include estimates of the eventual results of multi-stage caucus processes which will be refined as the later stages occur.
So, today’s update includes the preliminary estimates from the Washington caucuses. As always, is important to note that no actual delegates were allocated at this point. That will happen at later stages of the process. Our graphs reflect Green Paper‘s “soft count” estimate, which will change over time as the later stages of the process happen. By those estimates, the results were Romney 16, Paul 10, Santorum 10, Gingrich 4. Santorum also picked up a super delegate since yesterday’s update. So for the day: Romney 16, Santorum 11, Paul 10, Gingrich 4.
Bottom line though, we have yet another day where EVERYBODY LOSES. Of course the narrative is all about how Romney has now “won” several in a row, and this gives him momentum going into Super Tuesday. And of course that is a very real effect. “Winning” and the media spin around it have a huge effect. People don’t just vote for their favorite candidate, they tend to want to vote for someone that can win. So things may change in future contests.
But as of right now, Romney did the best of the night, but he needed to get 49.4% of the delegates to be “on pace” to get to 1144. He actually got 16/41, or only 39.0%. So the percentage of remaining delegates he needs to get to win actually increases from 49.4% up to 49.7%. This isn’t a big move, but it is a move in the wrong direction. To be wrapping this up, Romney needs to be winning by numbers that drive this metric down. So far, he continues to hover in the range where if he continues as he has been, he will eventually win, but if he starts to do even slightly worse, he can be blocked.
For the non-Romneys, their path to the nomination continues to get more and more unlikely. Santorum is still in second place. He now needs 55.9% of the remaining delegates to catch up and win. This would be a remarkable change from the 20.4% of delegates he has managed so far. The more realistic goal for the non-Romneys at this point continues to be that they collectively get enough delegates to block Romney, not that any of them actually collect enough to win themselves. (Having said that, one of these guys catching up is not yet actually impossible if something major happens, it is just getting increasingly likely.)
I’ll also note that according to our estimates (combining the Soft Green Papers count and the DCW super delegate count) Ron Paul has now caught up and tied with Newt Gingrich for 3rd in the delegate count.
And now we have Super Tuesday. Although not as big as 2008, we’ll still have a large number of delegates awarded. The main thing to look out for: Does Romney’s “% of remaining needed to win” actually start to drop? If not, the possibility of him not getting to 1144 gets a lot more serious.

Leave a Reply
You must be logged in to post a comment.