This is the website of Abulsme Noibatno Itramne (also known as Sam Minter). Posts here are rare these days. For current stuff, follow me on Mastodon

Categories

Calendar

March 2024
S M T W T F S
 12
3456789
10111213141516
17181920212223
24252627282930
31  

Republicans: Trump almost there

With the final results all but inevitable, these updates will be somewhat mechanical absent something unexpected happening.

After Oregon, Trump needed 18.13% of the remaining delegates to win.

In Washington, Trump got 41 of 44 delegates. Nobody else got those last three, they will be officially uncommitted. No word yet on who those three delegates actually are and who they will support.

Also since the initial post on Oregon, updates there moved one delegate from Kasich to Cruz, plus an update in the Virgin Islands moved all but one uncommitted delegate there to Trump. Between these two places, the net change was Trump +7, Kasich -1, Rubio -2.

So total change since Oregon: Trump +48, Kasich -1, Rubio -2.

So Trump got over 100% of the new delegates since Oregon, since he got all of the actual new delegates, plus stole some from the others.

Updated graphs:

chart-148

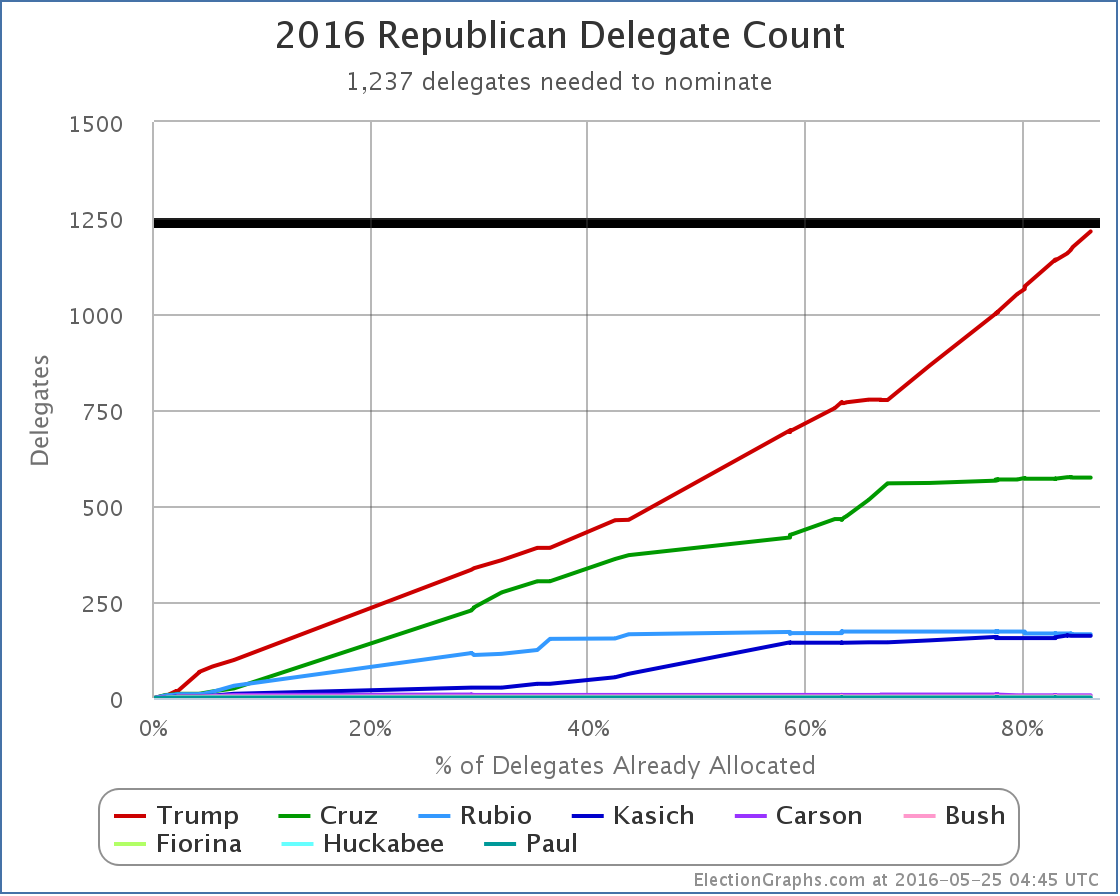
New delegate totals: Trump 1215, Cruz 574, Rubio 166, Kasich 162, Carson 7, Bush 4, Fiorina 1, Huckabee 1, Paul 1.

There are 341 delegates left. Trump only needs 22 of them.

As a note, there are currently 32 uncommitted delegates who have not yet expressed a preference by my count. There doesn’t seem to be an effort going on to push these folks to do so, but we’re now at the point where these uncommitted delegates could push Trump over the edge at any time if a bunch of them were to come out and say they were supporting him.

chart-149

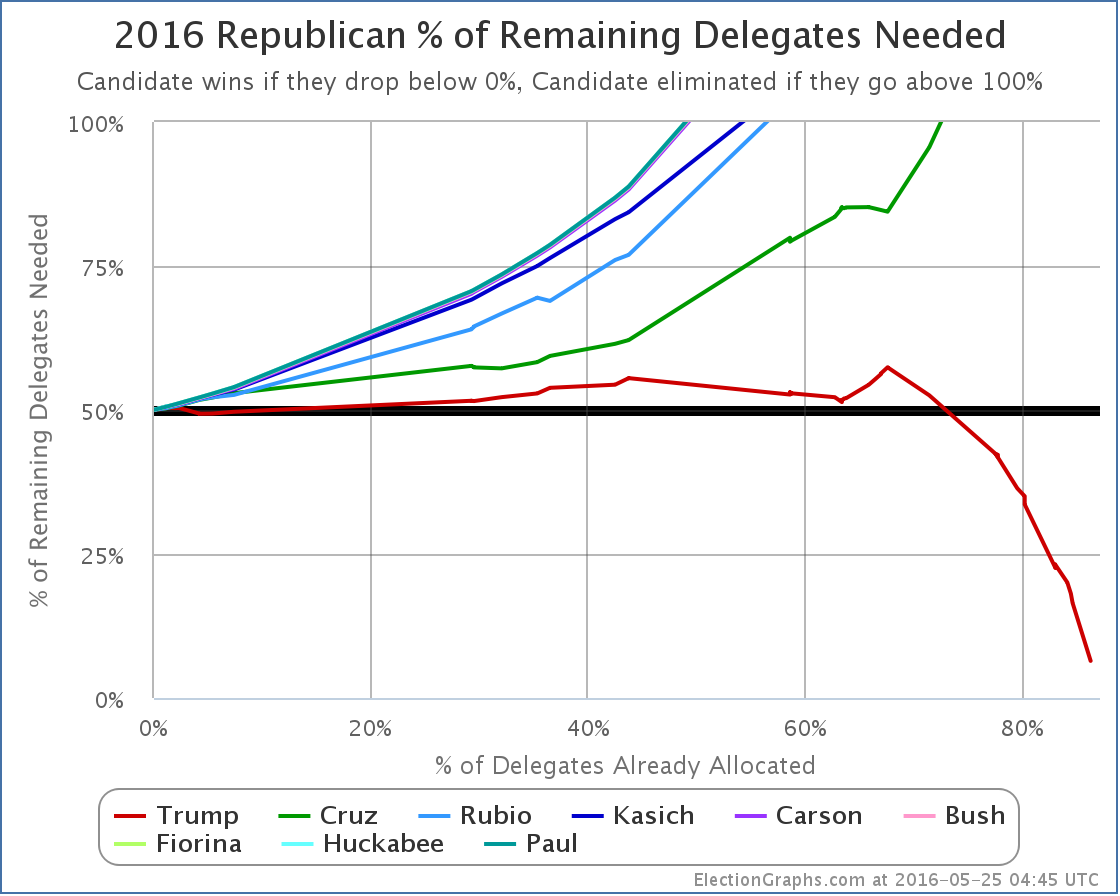
Trump now needs 6.45% of the remaining delegates to win.

That could be done with the uncommitted delegates sooner, but it is most probable this will come shortly after New Jersey closes their polls on June 7th. It is unlikely we will need to wait for the four Western states whose polls close later that evening.

Update 2016-05-26 14:51 UTC – AP says they have found enough uncommitted delegates to put Trump over 1237. I’ll update totals here as I get information on specific uncommitted delegates and state counts. Depending on how forthcoming AP is with the list of actual delegates that told them they support Trump, I may or may not be able to confirm 22 more uncommitted delegates before June 7th when the pledged delegates should push Trump over the edge anyway.

Update 2016-05-28 05:29 UTC – Uncommitted delegate update: Trump +20, Kasich +1, Cruz -3. I’ve done my best using all my usual sources to match AP’s conclusion. So far I have only been able to get up to Trump 1235… two delegates short… AP called various of these uncommitted delegates to get their count, but only released the totals and a few of the names, not all of the names, so it is impossible to confirm their total delegate by delegate. I’ll keep looking for more info on the remaining 18 uncommitted delegates on my list. If I find the remaining two before the next votes on June 7th, I’ll of course update.

Update 2016-05-28 05:54 UTC – I kept searching, and eventually found 3 more Trump delegates. That puts Trump at 1238 and therefore over the top. New blog post from me soon.

Note: This post is an update based on the data on ElectionGraphs.com. Election Graphs tracks both a poll based estimate of the Electoral College and a numbers based look at the Delegate Races. All of the charts and graphs seen in this post are from that site. Additional graphs, charts and raw data can be found there. All charts above are clickable to go to the current version of the detail page the chart is from, which may contain more up to date information than the snapshots on this page, which were current as of the time of this post. Follow @ElectionGraphs on Twitter or like Election Graphs on Facebook to see announcements of updates or to join the conversation. For those interested in individual general election poll updates, follow @ElecCollPolls on Twitter for all the polls as they are added.

Edit 15:21 to not imply the Virgin Islands are a state.

Edit 2016-05-28 13:57: Corrected the Trump delegate update not he first 2016-05-28 update to be Trump +20. The 1235 at that point was correct. I’d missed counting two Louisiana delegates in the delta.

Curmudgeon’s Corner: Anyone who raises their hand!

On the Curmudgeon’s Corner podcast this week, most of the show is of course about the presidential election. Ivan and Sam discuss everything you would expect about Clinton, Trump, Sanders and Cruz. And Sam ran a caucus! But in addition, there is plenty of other good stuff about hard drives, Microsoft Tay, being sick, the 5th amendment, and more!

Click below to listen or subscribe… then let us know your own thoughts!

CCCover20151125bw
Recorded 2016-03-31

Length this week – 1:51:50

1-Click Subscribe in iTunes
View Podcast in iTunes
View Raw Podcast Feed
Download MP3 File
Follow the podcast on Facebook

Show Details:

  • (0:00:10-0:11:09) But First
    • Agenda
    • Sick People
    • Airplane WiFi
    • Work without Internet?
  • (0:11:45-0:34:25) Lightning Round
    • Microsoft Tay
    • Pakistan Bombing / Egyptian Hijacking
    • Obama Approval Ratings
    • Apple vs FBI
    • Phones not protected by 5th Amendment?
  • (0:35:28-0:56:10) Election 2016 – Democrats
    • Washington, Hawaii and Alaska
    • The Sanders Path
    • Sam Caucuses
    • Information Bubbles
  • (0:56:56-1:08:18) Hard Drive Bonus Segment
    • Ivan’s Problem
    • SSD vs Spinning Platter
    • Wirecutter
    • Alex Interlude
    • Separating Media
    • Backups
  • (1:09:38-1:51:30) Election 2016 – Republicans
    • Wisconsin Delegate Allocation
    • Upcoming States
    • Trump Insanity
    • Third Parties and the Pledge
    • Vice Presidential Selection
    • The Trump Insider
    • Trump Presidential Style
    • Rubio keeping delegates
    • Autocorrect

Democrats: Huge Wins for Sanders… but…

Although the best delegate tallies are still estimates that will almost certainly change a bit before they are final, the general outline will not change. Sanders crushed Clinton in all three states that caucused on March 26th. With Washington, Hawaii and Alaska together, the delegate haul was 104 for Sanders to only 38 for Clinton.

Since the last update Sanders has also been on a roll gaining four new superdelegates (while Clinton got no new supers), and having four delegates move from Clinton to Sanders as results in states that voted earlier got finalized.

Between all that, since the 23rd the net change is Sanders +112, Clinton +34.

So Sanders got a whopping 76.71% of the delegates since the 23rd. That is well above the 67.70% he needed to improve his position in the race in terms of the % of the remaining delegates needed to win. So unlike some Sanders “wins” where he gets the most delegates but still just ends up in a worse position because he didn’t win by enough, this time Sanders supporters are fully justified in celebrating the win.

chart-93

See that downward slope right neat the end of the green line? That is the improvement in Sander’s position because of these three states. Despite all the states that Sanders has won, this has not happened often. Aside from days when a stray superdelegate committed to him or when states revised their results by a delegate here or there, the only previous times so far where Sanders has improved his position are February 9th when he won New Hampshire and March 6th when he won Maine. (OK, probably Democrats Abroad too.) This new result on March 26th swamps both of those in the magnitude of the improvement.

With all of the results and adjustments since Arizona, Idaho and Utah last week, Sanders goes from needing 67.70% of the remaining delegates to win, to needing only… 67.03%.

So… an improvement of… 0.67%.

So, uh… big improvement? Suddenly the Sanders path to victory is clear? Well, it is the biggest improvement in this metric Sanders has seen yet, but…

No.

March 26th was a big Sanders win. That should not be minimized. If he matched the March 26th performance in every contest from here to the end of the primary season, he would indeed catch up to Clinton and win. And the visibility of wins like the 26th may help Clinton seem weak, and may improve Sanders’ performance in future contests.

But the basic situation has not changed significantly. 67% of delegates is still an incredibly high bar. Sanders would have to consistently meet that bar for the rest of the race in order to win outright.

But wait you say, once again this is all including superdelegates. But surely if Sanders won in pledged delegates, the superdelegates wouldn’t deny him the win and would switch to Sanders en masse because to do otherwise would be unseemly? Well, I generally reject starting with that premise and say lets watch the superdelegates and see what they actually do.

But for the moment, as I did once before, let me run the numbers pretending superdelegates don’t exist.

With supers the totals right now are Clinton 1735, Sanders 1069.5, O’Malley 1

Without supers that becomes Clinton 1264, Sanders 1040.

Without supers there are 4050 delegates, and you need 2026 to have a majority.

Sanders would need 976 more delegates to have that majority of pledged delegates. There are 1746 more pledged delegates available.

That means Sanders would need 55.90% of the pledged delegates remaining to end the season with a majority of the pledged delegates.

That bar is a LOT lower than 67%. Consistently beating 67% seems close to unimaginable without a complete implosion. But 56%? Could you get to that just through some momentum, some positive press cycles and good campaigning? Maybe. It seems like it is on the outer edge of the possible given the history so far, but still possible.

If Sanders did succeed at that, he would still need to get a large number of Clinton superdelegates to defect in order to actually win. But Sanders has said he is ramping up his efforts to woo superdelegates. He has gone from saying superdelegates should be ignored, to acknowledging that any realistic path to a win involves getting superdelegates to vote for him too.

If superdelegates do start to defect, you will of course see it on the graphs here.

One last comparison, updating the one I did two weeks ago:

Screen Shot 2016-03-27 at 22.49.42747

Granting for the moment the premise that the results on the 26th are not an outlier, but are instead indicative of an inflection point in the race, you see that compared to Obama 2008, Sanders starts his “turn” on the graph later (at about 56% rather than at about 49%) and that he is much much further behind that Obama was. Just barely past this point in 2008 is when Obama took the delegate lead. Sanders is far from that.

Meanwhile, Clinton is in a much stronger position than Obama was until very nearly the end.

If this is a “turn”, and Sanders drives his line down and eventually wins, it will be one of the largest come from behind wins in modern times. This is not impossible, but it is still highly unlikely.

Wisconsin is next on April 5th. Right now the RCP poll average there has Clinton 46.5% to Sanders 44.0%. If that average plays out and assuming a roughly even distribution of support throughout the congressional districts in the state, it would mean about 44 delegates for Clinton to 42 delegates for Sanders.

If that happened, Sanders would then need 67.87% of the remaining delegates to win, completely undoing the gains he made with Washington, Hawaii and Alaska.

Now, Sanders may get a boost of his recent wins and do better than the current poll average indicates. He may even win Wisconsin. The question though is not if he wins, but if he wins it by enough to actually be on a pace to catch up to Clinton before things are over. Right now, that means he needs 58 of the 86 delegates available from the Wisconsin primary.

We shall see.

[Update 2016-04-01 16:10 UTC – Superdelegate scan nets Clinton +3, Sanders +2.5. This does not significantly change the analysis above.]

[Update 2016-04-01 16:55 UTC – I found an update from Michigan which I had logged on March 10th, but had an error in it, so the totals in Michigan in the state detail table were correct, but that update wasn’t included in the national totals. Fixed now. Net change from that: Clinton +2, Sanders -2. This also does not significantly change the analysis above.]

[Update 2016-04-05 16:29 UTC – Superdelegate scan: Clinton +1. Note because Bill Clinton said something about how he would support Sanders at the convention if Sanders won, just like he supported Obama in 2008, some people are saying he should be listed as an Uncommitted superdelegate instead of a Clinton superdelegate. I don’t buy this at the moment and am continuing to list Bill Clinton as supporting Hillary Clinton.]

Note: This post is an update based on the data on ElectionGraphs.com. Election Graphs tracks both a poll based estimate of the Electoral College and a numbers based look at the Delegate Races. All of the charts and graphs seen in this post are from that site. Additional graphs, charts and raw data can be found there. All charts above are clickable to go to the current version of the detail page the chart is from, which may contain more up to date information than the snapshots on this page, which were current as of the time of this post. Follow @ElectionGraphs on Twitter or like Election Graphs on Facebook to see announcements of updates or to join the conversation. For those interested in individual general election poll updates, follow @ElecCollPolls on Twitter for all the polls as they are added.

[Edit 2016-03-28 00:05 UTC – Fixed one place I had Sanders’ name instead of Clinton.]

Electoral College: 04:15 – Romney’s Paths Gone, Obama Wins!

Romney Obama
Romney Best Case 264 274
Current Status 206 332
Obama Best Case 205 333

A bunch of states were called between 04:00 UTC and 04:15 UTC:

  • Obama: CA, HA, WA, WI, IA NM
  • Romney: ID, MT, NC

Only one of these mattered. Iowa. Iowa was a close state. Romney needed every close state he had left in order to win. Without Iowa, even if Romney swept every other close state (and Maine’s 2nd) he would only get to 264.

When CNN called Iowa at 04:09 UTC, I called the race on twitter in these two tweets. Nine minutes later when some more states came in, CNN called the election for Obama. They were slow. More on those next states in the next update.

Anyway, Obama wins reelection!

Curmudgeon’s Corner: Did You Get Him a Drum Set?

In the latest Curmudgeon’s Corner…

Sam and Ivan talk about:

  • WA Caucuses
  • Super Tuesday Predictions
  • Human Computer Interactions / Data Speeds and Usage

Just click to listen now:

[wpaudio url=”http://www.abulsme.com/CurmudgeonsCorner/cc20120304.mp3″ text=”Recorded 4 Mar 2012″]

or

1-Click Subscribe in iTunes

View Podcast in iTunes

View XML Feed

2012 Republican Delegate Count: Washington Caucuses

Chart from the Abulsme.com 2012 Republican Delegate Count Graphs page. When a candidate gets down to 0%, they have cinched the nomination. If they get up past 100%, they have been mathematically eliminated. Rather than the date on the x-axis, we show the “% of Delegates Already Allocated” as this better represents the progress through the race. Note that these numbers include estimates of the eventual results of multi-stage caucus processes which will be refined as the later stages occur.

So, today’s update includes the preliminary estimates from the Washington caucuses. As always, is important to note that no actual delegates were allocated at this point. That will happen at later stages of the process. Our graphs reflect Green Paper‘s “soft count” estimate, which will change over time as the later stages of the process happen. By those estimates, the results were Romney 16, Paul 10, Santorum 10, Gingrich 4. Santorum also picked up a super delegate since yesterday’s update. So for the day: Romney 16, Santorum 11, Paul 10, Gingrich 4.

Bottom line though, we have yet another day where EVERYBODY LOSES. Of course the narrative is all about how Romney has now “won” several in a row, and this gives him momentum going into Super Tuesday. And of course that is a very real effect. “Winning” and the media spin around it have a huge effect. People don’t just vote for their favorite candidate, they tend to want to vote for someone that can win. So things may change in future contests.

But as of right now, Romney did the best of the night, but he needed to get 49.4% of the delegates to be “on pace” to get to 1144. He actually got 16/41, or only 39.0%. So the percentage of remaining delegates he needs to get to win actually increases from 49.4% up to 49.7%. This isn’t a big move, but it is a move in the wrong direction. To be wrapping this up, Romney needs to be winning by numbers that drive this metric down. So far, he continues to hover in the range where if he continues as he has been, he will eventually win, but if he starts to do even slightly worse, he can be blocked.

For the non-Romneys, their path to the nomination continues to get more and more unlikely. Santorum is still in second place. He now needs 55.9% of the remaining delegates to catch up and win. This would be a remarkable change from the 20.4% of delegates he has managed so far. The more realistic goal for the non-Romneys at this point continues to be that they collectively get enough delegates to block Romney, not that any of them actually collect enough to win themselves. (Having said that, one of these guys catching up is not yet actually impossible if something major happens, it is just getting increasingly likely.)

I’ll also note that according to our estimates (combining the Soft Green Papers count and the DCW super delegate count) Ron Paul has now caught up and tied with Newt Gingrich for 3rd in the delegate count.

And now we have Super Tuesday. Although not as big as 2008, we’ll still have a large number of delegates awarded. The main thing to look out for: Does Romney’s “% of remaining needed to win” actually start to drop? If not, the possibility of him not getting to 1144 gets a lot more serious.

Live Tweeting my Local Washington State Republican Caucuses

I am planning today to go to the Republican Caucuses here in Washington state. Doors open in about 30 minutes, you have to be signed in about 60 minutes from now, and 90 minutes from now the “action” should get started.

Assuming I am able to, I will be live tweeting as things progress. The tweets will appear on abulsme.com at a few minutes before 00:00 UTC in daily summary form, or you can follow me on Twitter to get updates in real time:

@abulsme

If I understand correctly, there will be a straw poll vote (which will be what is reported first by the press, but doest really matter), then there will be speeches and such, and then delegates will be picked for the county conventions. Those delegates will state their preferences most likely, but will not be bound in any way at the next level. Washington has 40 delegates, 30 will be winner take all 3 at a time by congressional district, and 10 will be proportional based on the state wide vote.

For the record, I plan on expressing my preferences (I hesitate to call what happens at a caucus actual voting) for Ron Paul. Of the four remaining Republican candidates, he is my preference by far. In terms of caucus participation, I am a Republican for the day, but at this point I am not ready to commit to what I will do in November. We shall see. And there will likely be other choices besides the Republican and Democrat, some of which may be interesting.