- Reading – вЂAnonymous’ Launches Boycott Over Netflix PAC (Carl Franzen) http://t.co/dja0hO1P #
- Reading – The Lumia 900 And The Trouble With Competing With Free (Matthew Yglesias) http://t.co/1BcOL5B7 #
|
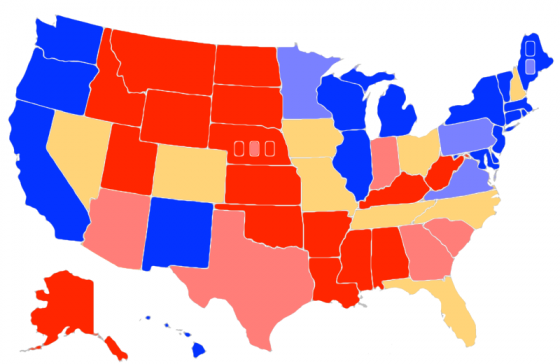
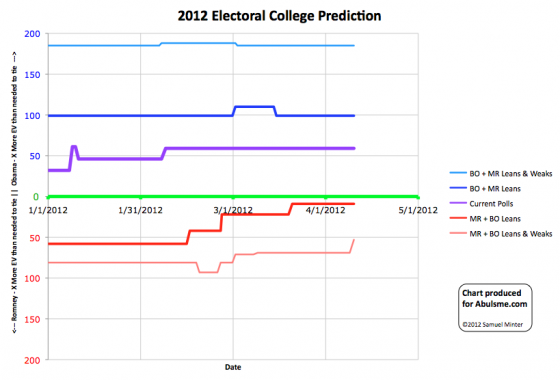
@BreakingNews says Santorum has decided to drop out! It will be interesting to see if he hangs on to his delegates or releases them (those that ate bound anyway, many are not officially bound) and where those delegates end up. In the end though, this just ratifies the already known result. It is Romney. It has always been Romney. Update 18:31 UTC: Suspending his campaign, not dropping out. This is the usual course for candidates at this stage. Means they keep their bound delegates (although unbound can of course change their minds and vote for whoever they want) and are able to keep fundraising and such to pay off debts, etc. Map and chart from the Abulsme.com 2012 Electoral College Prediction page. Both assume Obama vs Romney with no third party strong enough to win states. On the Map Red is Romney, Blue is Obama, Gold States are too close to call. Lines on the chart represent how many more electoral votes a candidate has than is needed to tie under several different scenarios. Up is good for Obama, Down is good for Romney. At some point things have to stop getting worse for Romney, right? As he pivots from the primaries to the general election, he’ll start pulling back support from the middle and start gaining ground again, right? Well, probably. But not yet. In today’s update the 5 poll average for Michigan moves to Obama having more than a 10% lead in that state. So we color the state dark blue. Essentially this means it is a state Romney probably shouldn’t bother putting any resources into at all. The situation may change later, but for the moment, it is out of reach. Since Michigan isn’t moving in or out of Swing State status, the overall summary remains the same with Obama clearly the favorite by a large margin, but Romney still being able to squeak by with a win if he manages to sweep all of the too close to call swing states:
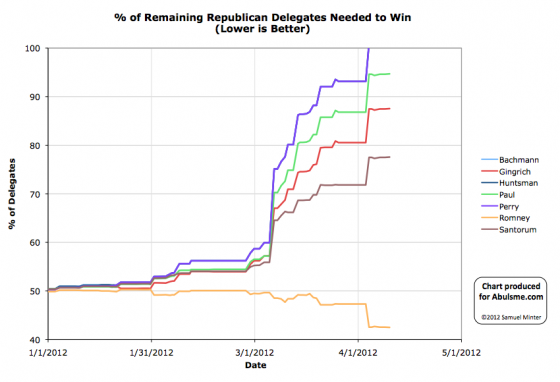
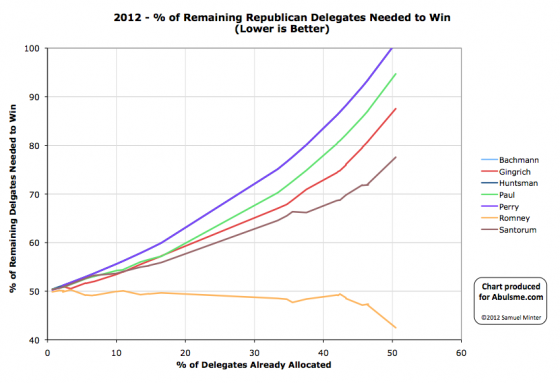
One thing to keep in mind at this stage is that state polling is still sparse. So the “five poll averages” I use for this analysis can cover a lot of time. For instance, in Michigan my five poll average currently has polls that were done all the way back through January. (Specifically it includes one from January, two from February, one from March and one from April.) There are still just a handful of state polls per week. Some states actually haven’t even been polled at all and I’m extrapolating based on the 2004 and 2008 elections. I’m also doing a straight average, not a recency weighted average. Because of this, this analysis will react more slowly to changes in the political situation. At least that is the situation here in April. As we get closer and closer to November, we’ll have a faster and faster pace of polls. By the time we get to October we will have many new state polls every week, and changes in this analysis will be much more frequent and catch changes faster. Edit 2012 May 30 15:49 UTC: It turns out that between the last update on Mar 30 and this one New Hampshire should have moved from Weak Romney to Lean Romney on Mar 31. At that time however, I was missing some polls and thought New Hampshire was already Lean Romney, so no update was posted. This is corrected in the historical charts starting on May 30. Charts from the Abulsme.com 2012 Republican Delegate Count Graphs page. When a candidate gets down to 0%, they have cinched the nomination. If they get up past 100%, they have been mathematically eliminated. The first chart is by date, the second is by “% of Delegates Already Allocated”. These numbers include estimates of the eventual results of multi-stage caucus processes which will be refined as the later stages occur. You’d think the remaining superdelegates would be rushing in a mob to get on the Romney bandwagon at this point, but not so far. We have an additional super from Massachusetts today. Well, actually DCW identified the new super on Saturday, but it took Green Papers a few days to update their Massachusetts numbers. Since we go by Green Papers here, we waited. :-) In any case, this is only one delegate, so only very minor changes to the “% of remaining needed to win” numbers:
And now we continue to yawn and wait in the lull before the next actual contests. Not that there is much contest left anyway, but Romney still does need to mop up the rest of the 1144 delegates he needs. |
||||||||||||||


