- @rebliv I have new respect now that I know @MarcusAlzona's true identity. #
- @rebliv @MarcusAlzona Marcus is Santa! Shhh! Don't tell! #
|
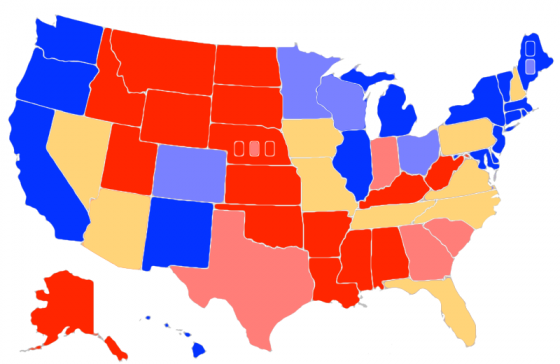
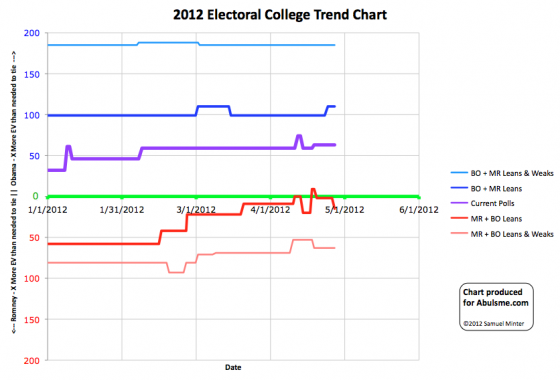
Chart and map from the Abulsme.com 2012 Electoral College Prediction page. Both assume Obama vs Romney with no strong third party candidate. Both show polling as it currently exists. Things will change before election day. On the map red is Romney, blue is Obama, gold states are too close to call. Lines on the chart represent how many more electoral votes a candidate would have than is needed to tie under several different scenarios. Up is good for Obama, Down is good for Romney. One state changing categories today. Virginia.
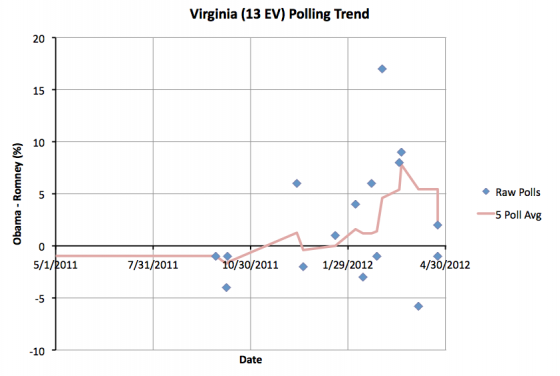
As you can see, The 5 poll average once again drops below 5%, moving the state from “Weak Obama” to “Lean Obama” and making Virginia once again one of the states we consider to be a swing state. The big effect here is the March 2nd Marist poll which showed Obama up by 17 in Virginia rolling off the 5 poll average. That poll was clearly an outlier. Even without it, we see a trend toward Obama around that time, but it wouldn’t have been large enough to move the average over a 5% lead without that one poll. In addition, the more recent polls have been moving in Romney’s direction. In any case, as of now the new 5 poll average has Obama up in Virginia by 2.4%. Clearly in the swing state category. This change improves Romney’s best case scenario (where we give him all the swing states):
Since Santorum dropped out on April 10th, there have been 11 changes to state categories. In the case of Florida (29 ev) and North Carolina (15 ev), they changed categories, but already changed back to where they were… so no net change. Ohio (18 ev), Arizona (11 ev), Colorado (9 ev) and New Hampshire (4 ev) moved toward Obama. Pennsylvania (20 ev), Virginia (13 ev) and Wisconsin (10 ev) moved toward Romney. The main net effect is slightly more electoral votes in the swing state category, so a bit larger range between Obama’s best case and Romney’s best case. Comparing to my last update before Santorum dropped out…
All in all, the main result here is the race opening up since the last small doubts of Romney being the nominee were put to rest. The polls are tightening and more states are up for grabs. Obama still has a big advantage in the electoral college… for the moment. It has only been 17 days since Santorum dropped out. My expectation is that this race becomes closer as events play out over the next few months. Edit 2012 May 2 13:10 UTC – Adjusted horizontal scale on Virginia Graph
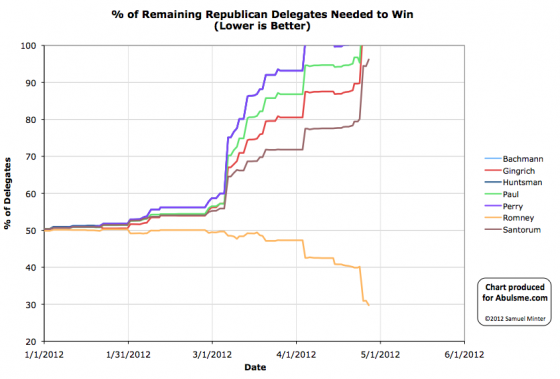
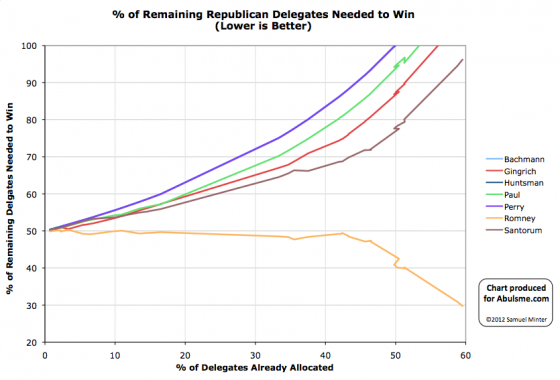
Charts from the Abulsme.com 2012 Republican Delegate Count Graphs page. When a candidate gets down to 0%, they have clinched the nomination. If they get above 100%, they have been mathematically eliminated. The first chart is by date, the second is by “% of Delegates Already Allocated”. These numbers include estimates of the eventual results of multi-stage caucus processes which will be refined as the later stages occur. First of all, I just updated Wednesday’s post to add a correction. I had made the mistake of doubting Green Papers. I thought they had missed a delegate in their count. In fact, I had misinterpreted their statement about the change. I read their new total as a delta from the election, leading me to add an extra non-existant delegate to Romney’s total in Pennsylvania. My bad. Not theirs. Worse, my first draft of Wednesday’s post actually had it right, but I switched it to the wrong answer right before posting. Bleh. Today’s updates build off the corrected numbers for Wednesday rather than the original incorrect numbers I posted. (OK, it was only off by one delegate, which is tiny in the big scheme, but still, I’m annoyed at myself. :-) ) Anyway… Three states with updates today, all via Green Papers as usual:
So total for the day: Romney +17, Paul +2, Gingrich -1 In terms of “% of remaining delegates needed to win”:
More updates from Pennsylvania and other locations as they come in. Next batch of actual contests are North Carolina, Indiana and West Virginia on May 8th. I’m guessing Romney will get the 29.7% of delegates he needs there. Yawn. |
||||||||||||||

