This is the website of Abulsme Noibatno Itramne (also known as Sam Minter).
Posts here are rare these days. For current stuff, follow me on Mastodon
|
With the final results all but inevitable, these updates will be somewhat mechanical absent something unexpected happening.
After Nebraska and West Virginia, Trump needed 22.57% of the remaining delegates to win.
In Oregon, Trump got 19 delegates, while Kasich picked up 5 and Cruz picked up 4, even though neither of them are actively running any more.
In other changes since Nebraska and West Virginia due to uncommitted delegate preference changes in Guam, finalization of the West Virginia results taking into account geographic restrictions, and an update from New York, there was a net change of Trump +6, Kasich +2, Cruz -1
So total change since Nebraska and West Virginia: Trump +25, Kasich +7, Cruz +3
So Trump actually got 71.43% of the delegates since Nebraska and West Virginia.
So while he didn’t completely sweep the delegates this week, he is still far ahead of the target pace he needs to get to 1237.
Updated graphs:
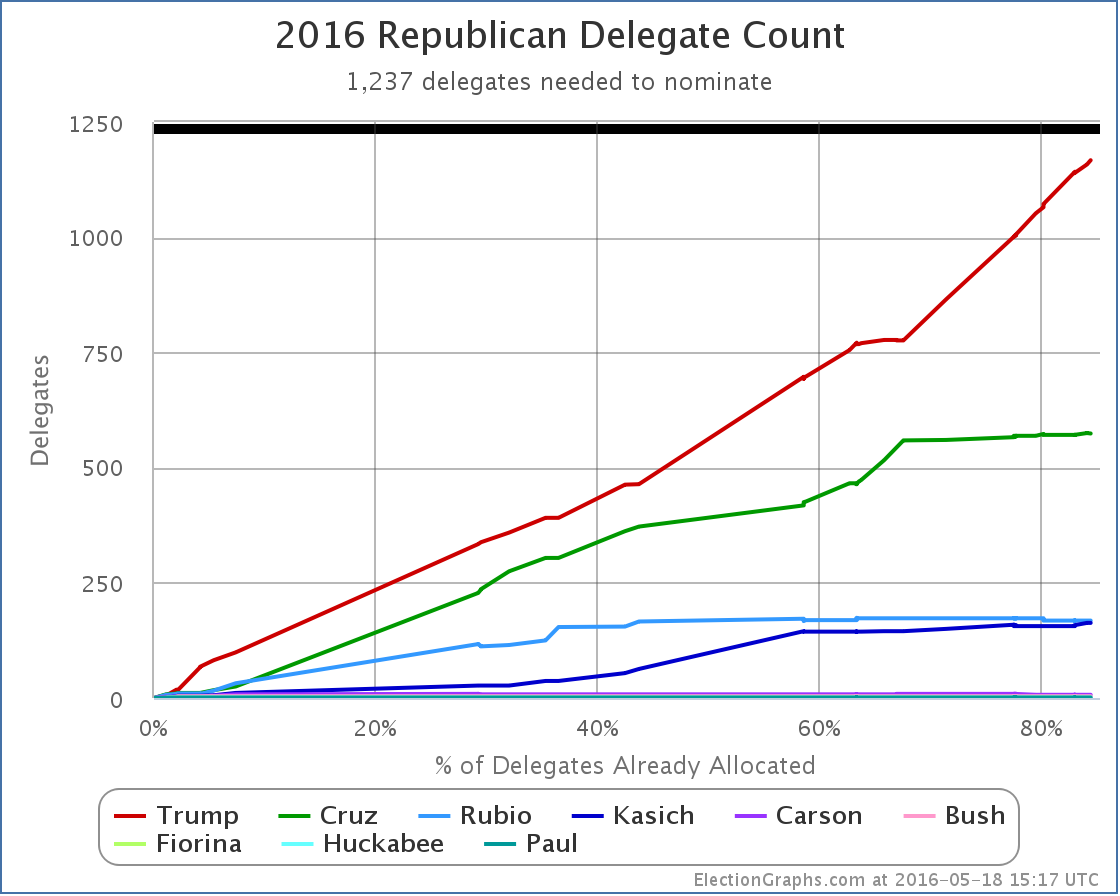
New delegate totals: Trump 1167, Cruz 574, Rubio 168, Kasich 163, Carson 7, Bush 4, Fiorina 1, Huckabee 1, Paul 1.
There are 386 delegates left. Trump needs 70 of them.
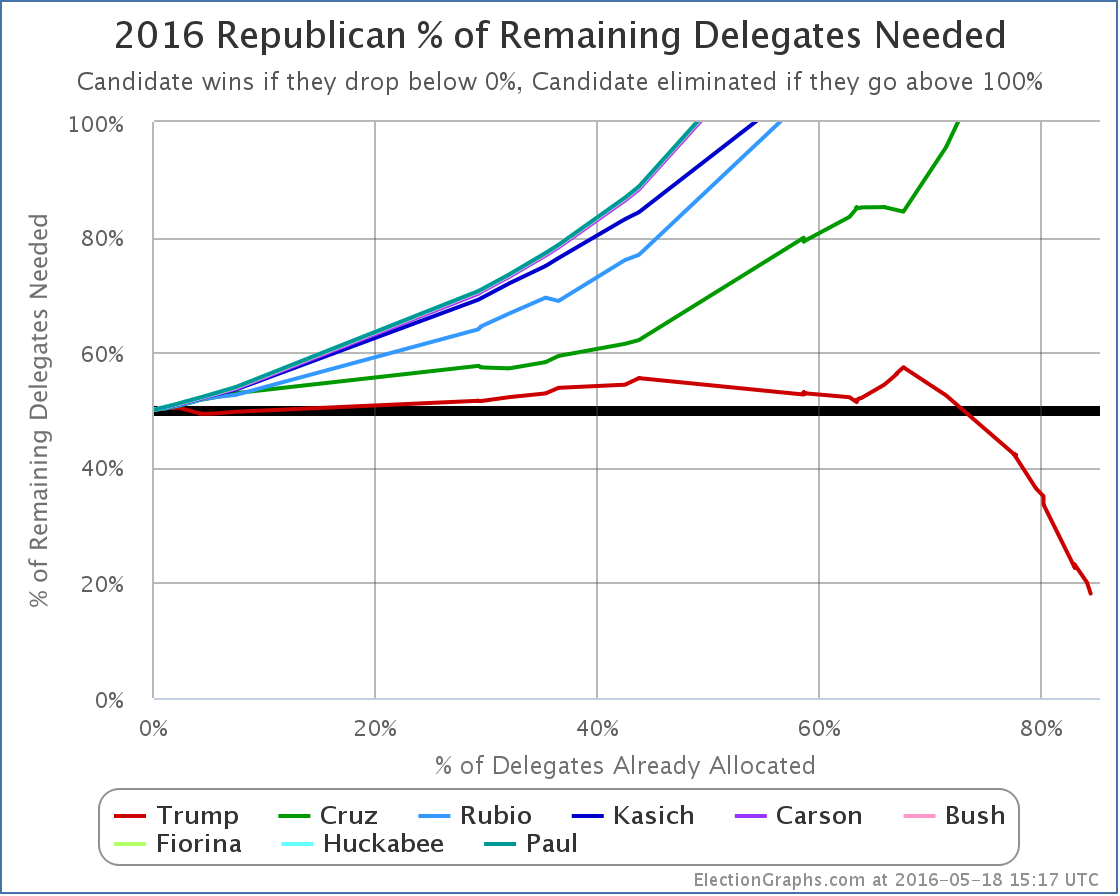
Trump now needs 18.13% of the remaining delegates to win.
Update 2016-05-22 16:12 UTC – Oregon update: Cruz +1, Kasich -1.
Update 2016-05-25 14:30 UTC – Virgin Islands update: Trump +7, Cruz -1, Rubio -2.
Note: This post is an update based on the data on ElectionGraphs.com. Election Graphs tracks both a poll based estimate of the Electoral College and a numbers based look at the Delegate Races. All of the charts and graphs seen in this post are from that site. Additional graphs, charts and raw data can be found there. All charts above are clickable to go to the current version of the detail page the chart is from, which may contain more up to date information than the snapshots on this page, which were current as of the time of this post. Follow @ElectionGraphs on Twitter or like Election Graphs on Facebook to see announcements of updates or to join the conversation. For those interested in individual general election poll updates, follow @ElecCollPolls on Twitter for all the polls as they are added.
With the final results all but inevitable, these updates will be somewhat mechanical absent something unexpected happening.
After West Virginia, Sanders needed 84.90% of the remaining delegates to win, Clinton only needed 15.29%.
In Oregon and Kentucky, Sanders got 62, Clinton got 54.
In other changes since West Virginia due to superdelegate updates, there was a net change of Clinton +1, Sanders -1.
So total change since West Virginia: Sanders +61, Clinton +55.
That is Sanders 52.59%, Clinton 47.41%.
So Clinton met her target, Sanders did not.
Updated graphs:
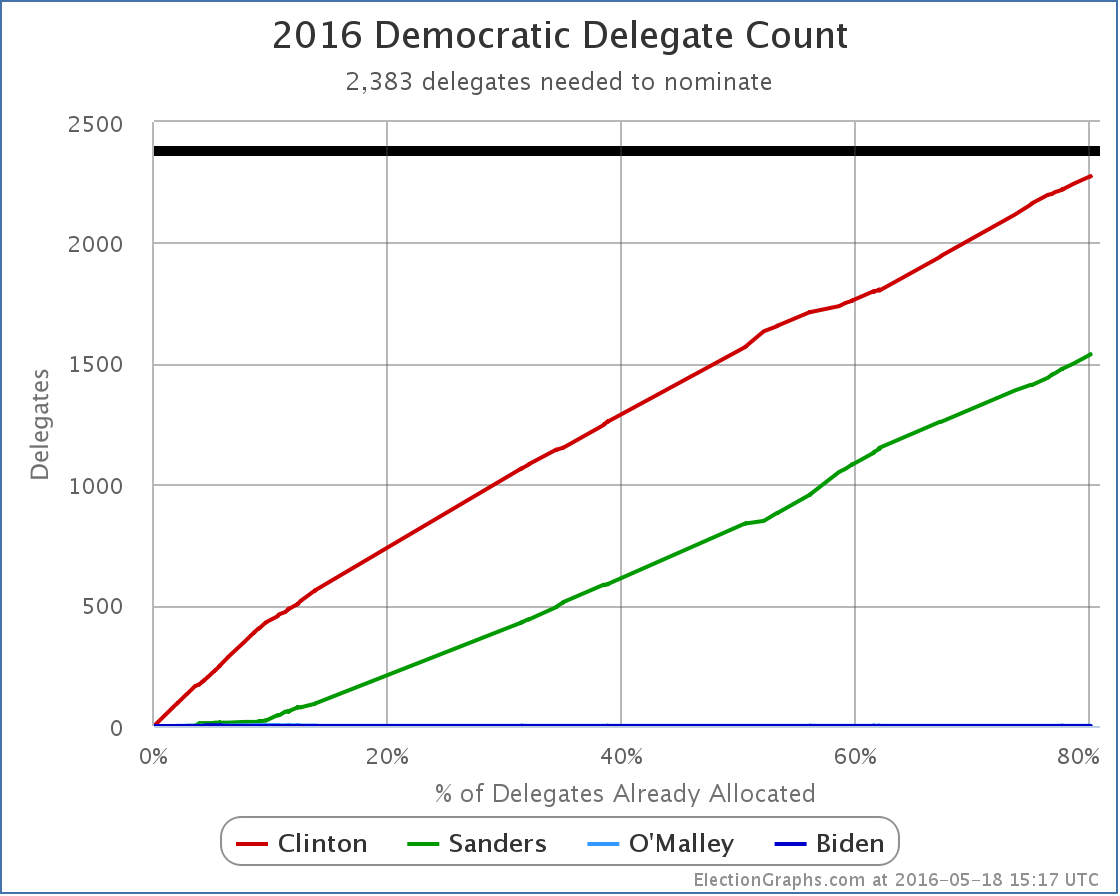
New delegate totals: Clinton 2275, Sanders 1539, O’Malley 1.
There are 950 delegates left. Clinton needs 108 of them. Sanders needs 844 of them.
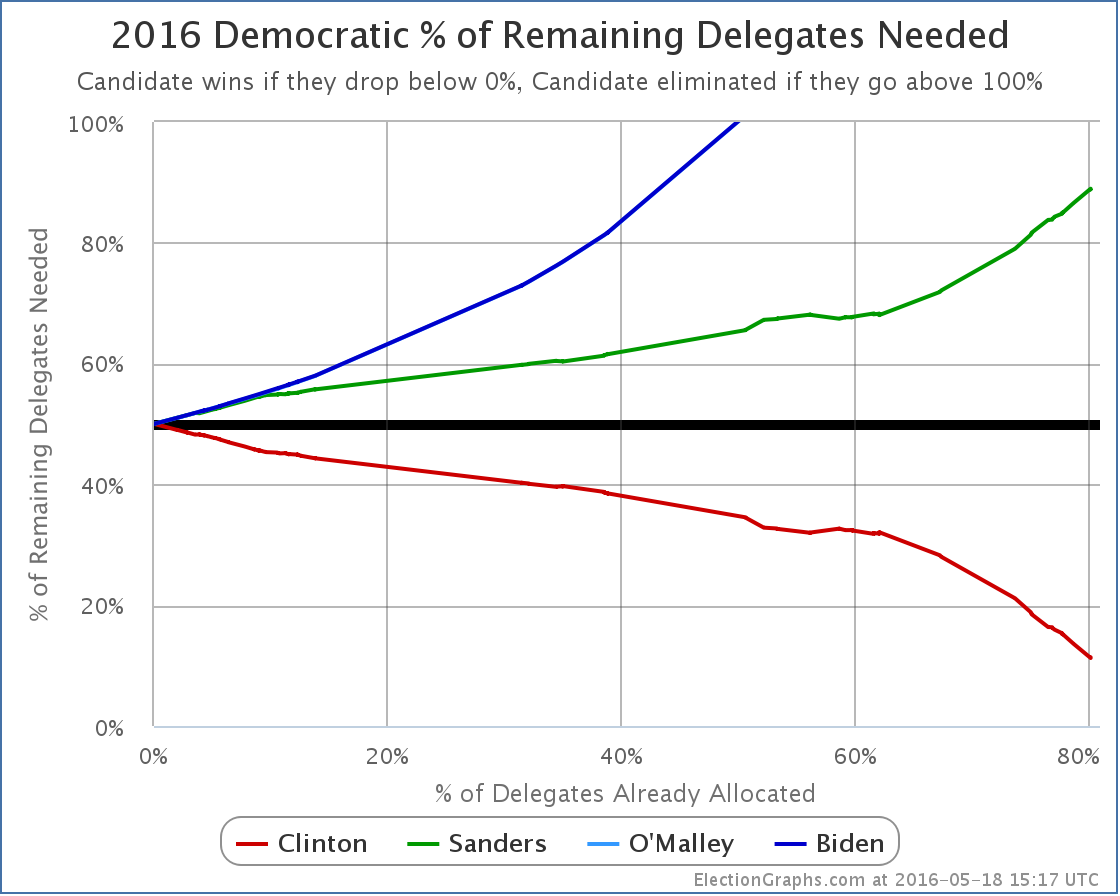
Clinton now needs 11.37% of the remaining delegates to win. Sanders needs 88.84%.
Update 2016-05-20 16:33 UTC: Superdelegate scan – Clinton +2, Sanders +2.
Update 2016-05-25 02:26 UTC: Superdelegate scan – Clinton +3.
Update 2016-05-25 02:28 UTC: Change from Maryland – Sanders +1, Clinton -1.
Update 2016-05-27 17:05 UTC: Superdelegate scan – Clinton +7, Sanders +1.
Update 2016-05-30 16:06 UTC: Superdelegate scan – Clinton +4, Sanders -1.
Update 2016-06-03 14:20 UTC: Superdelegate scan – Clinton +4, Sanders +3
Update 2016-06-03 14:22 UTC: There was a one delegate adjustment from Clinton to Sanders in Oregon as results were finalized there. I also discovered one Sanders delegate in Michigan I was missing due to a math error on my part which is now fixed. Net change: Sanders +2, Clinton -1.
Update 2016-06-05 03:25 UTC: Superdelegate scan – Clinton -1
Note: This post is an update based on the data on ElectionGraphs.com. Election Graphs tracks both a poll based estimate of the Electoral College and a numbers based look at the Delegate Races. All of the charts and graphs seen in this post are from that site. Additional graphs, charts and raw data can be found there. All charts above are clickable to go to the current version of the detail page the chart is from, which may contain more up to date information than the snapshots on this page, which were current as of the time of this post. Follow @ElectionGraphs on Twitter or like Election Graphs on Facebook to see announcements of updates or to join the conversation. For those interested in individual general election poll updates, follow @ElecCollPolls on Twitter for all the polls as they are added.
Edit 2016-06-05 05:44 UTC: Corrected a couple details of the list of superdelegate updates to match my logs of the changes that were made. I’d missed logging a couple of the updates here on this post. Dated the updates to approximately when I made the changes.
This week on Curmudgeon’s Corner Sam and Ivan talk about chickens! Just kidding. Of course they talk about Election 2016. New Hampshire. Sanders beating Clinton. Trump walking all over the other Republicans. The log jam at second place on the Republican side. What this means for the delegate race and the next couple of states on both sides. Everything you would expect! Then they wrap it up with a lightning round for some thoughts on the Zika virus, changes on Twitter, the Oregon standoff, and more!
Click below to listen or subscribe… then let us know your own thoughts!

Recorded 2016-02-11
Length this week – 1:39:01
 1-Click Subscribe in iTunes 1-Click Subscribe in iTunes
 View Podcast in iTunes View Podcast in iTunes
 View Raw Podcast Feed View Raw Podcast Feed
 Download MP3 File Download MP3 File
 Follow the podcast on Facebook Follow the podcast on Facebook
Show Details:
- (0:00:10-0:16:41) Intro
- Pi Again
- Agenda
- Ivan’s Rough Day
- Sam’s Upcoming Trip
- (0:17:26-0:55:16) Election 2016: Republicans
- New Hampshire Results
- Upcoming contests
- Rubio’s debate crash
- Kasichmentum?
- Who drops out and when?
- Gaming out South Carolina
- anti-Trumps running out of time
- Trump moving to center?
- Trump/Sanders Swing Voters
- Fighting each other instead of Trump
- Carson in South Carolina!
- (0:56:25-1:19:52) Election 2016: Democrats
- No Surprise
- Delegate Story
- South Carolina and Nevada
- What is the path for Sanders?
- Clinton indictment?
- Sanders/Clinton demographics
- Independents
- Sam’s Choices
- Santorum iSideWith
- (1:20:41-1:38:40) Lightning Round
- Book: Prince Caspian
- Zika Virus
- Twitter Changes
- Ivan iSideWith
- Oregon Standoff
We made it past Iowa! We have Iowa results! We have brand new speculation about New Hampshire and beyond! Yes, of course, the bulk of this week’s Curmudgeon’s Corner podcast is Sam and Ivan discussing where the presidential race sits in this week between Iowa and New Hampshire. We go over all of the results so far, then discuss how candidates, the media and the public are reacting to those results, and what that means for the rest of the contest. Plus, for the first time in a little while, we do a lightning round as well, covering bluetooth audio issues, Iran, the Flint water crisis, tech earnings results, and more!
Click below to listen or subscribe… then let us know your own thoughts!
Recorded 2016-02-04
Length this week – 2:12:09
1-Click Subscribe in iTunes
View Podcast in iTunes
View Raw Podcast Feed
Download MP3 File
Follow the podcast on Facebook
Show Details:
- (0:00:10-0:05:11) Intro
- Pi O’Clock Again
- Agenda
- Talking Politics
- (0:06:00-0:29:42) Republicans in Iowa
- Loser.com
- Headlines
- Delegate Totals
- Spin
- Polling Wrong?
- People Dropping Out
- Carson/Cruz blow up
- Speeches
- (0:30:45-0:43:55) Democrats in Iowa
- Close Race
- Not a Surprise
- Delegate Totals
- Spin
- Demographic Split
- (0:44:33-1:24:33) Republicans in New Hampshire and beyond
- Delegate Rules
- Delegate Hypothetical
- Will we get good New Hampshire polls?
- Contest Calendar
- Trump reacts to losing
- How will New Hampshire react to Iowa?
- Divided anti-Trump vote
- Trump Strategy
- Bush done?
- Big last minute moves?
- Gilmore
- post-New Hampshire
- Predictions
- (1:25:53-1:42:08) Democrats in New Hampshire and beyond
- Sanders will win New Hampshire
- post-New Hampshire
- Delegate Allocation
- How will Clinton react to losing?
- No Clinton Backup
- Clinton emails
- Clinton collapse scenarios
- (1:43:24-2:11:49) Lightning Round
- Car Bluetooth Audio
- Movie: Thomas and the Magic Railroad (2000)
- Iran Deal Implementation
- Flint Water Crisis
- Oregon Militia Standoff Ended
- Apple Earnings
- Alphabet Market Cap
- Feedback on Performance Reviews
- Feedback on Sam’s Writing
- Growing Show


|
Romney |
Obama |
| Romney Best Case |
264 |
274 |
| Current Status |
206 |
332 |
| Obama Best Case |
205 |
333 |
Between 04:15 and 04:30 UTC, three more states were called. Missouri for Romney, and Oregon and Ohio for Obama. All three of these were fully expected, but Ohio put Obama over 270.
CNN waited until they called Ohio at 04:18 UTC to call the election, even though based on the polls by the time we got to election day, Ohio wasn’t even close. Once Iowa was called 9 minutes earlier, Romney had no more ways to win.
At this point, the only question is the margin of Obama’s victory.
As of this update, the five poll average hasn’t missed a state yet. Four states and two congressional districts to go.
(Of the close ones… there is also Alaska and Nebraska’s 3rd, but those will certainly go to Romney.)
Edit 2012 Nov 7 05:13 to add that last parenthetical note.


Charts from the Abulsme.com 2012 Republican Delegate Count Graphs page. When a candidate gets down to 0%, they have clinched the nomination. If they get above 100%, they have been mathematically eliminated. The first chart is by date, the second is by “% of Delegates Already Allocated”. These numbers include estimates of the eventual results of multi-stage caucus processes which will be refined as the later stages occur.
Today we have some updates to yesterday’s Oregon results.
First of all, it turns out Santorum gets one more delegate than it looked like yesterday, and Gingrich gets one less.
Second, the remaining two Oregon superdelegates stated they will echo the primary results and support Romney.
New summary for Oregon: Romney 21, Santorum 3, Paul 3, Gingrich 1
So net for the day: Romney +2, Santorum +1, Gingrich -1
So Romney’s % of remaining needed to win drops from 21.4% to 21.2%.
He needs 167 more delegates to get to the 1144 magic number by my estimate.
(My estimate uses the Green Papers Soft Count plus the DCW Superdelegate Count).


Charts from the Abulsme.com 2012 Republican Delegate Count Graphs page. When a candidate gets down to 0%, they have clinched the nomination. If they get above 100%, they have been mathematically eliminated. The first chart is by date, the second is by “% of Delegates Already Allocated”. These numbers include estimates of the eventual results of multi-stage caucus processes which will be refined as the later stages occur.
Today we have results from Oregon. Prior to today we had one superdelegate in Oregon for Romney and 27 TBD. We now have Romney 19, Paul 3, Santorum 2, Gingrich 2, TBD 2. So for the day Romney +18, Paul +3, Santorum +2, Gingrich +2.
Romney got 72.0% of today’s delegates, way more than the 23.0% he needed in order to be on track to clinch the nomination. So the march goes on.
Overall totals at this point: Romney 975, Santorum 260, Gingrich 145, Paul 117, TBD 789
I should also mention that a couple days ago Paul announced he would not be campaigning in the remaining primary states. Contrary to some of the headlines, he did not suspend his campaign like Santorum and Gingrich have. His campaign is still actively working the delegate process in the states where that is possible. He just isn’t dedicating any resources to trying to win votes in the remaining states where he has no chance of winning. Any efforts are concentrated on the actual process of delegate selection, which has basically been his strategy all along. Effectively though, by the nature of the memo the campaign put out, regardless of what was intended, the effect is that what little attention was still being given to him now fades away too. Especially since he also essentially promised to “behave” at the convention and not cause trouble.
So we now just wait for Romney to finish collecting the last 169 delegates he needs to win. Next up, Kentucky and Arkansas on the 22nd.


Chart and map from the Abulsme.com 2012 Electoral College Prediction page. Both assume Obama vs Romney with no strong third party candidate. Both show polling as it currently exists. Things will change before election day. On the map red is Romney, blue is Obama, gold states are too close to call. Lines on the chart represent how many more electoral votes a candidate would have than is needed to tie under several different scenarios. Up is good for Obama, Down is good for Romney.
One state changing status today, and once again it is a move in Romney’s direction:

Obama’s lead in the five poll average drops from 12.1% to 9.7%. So we no longer classify it as “Strong Obama”, but rather “Weak Obama”. Now, the average is still well over 5% (despite the most recent poll) so Oregon is still nowhere near being a swing state. In the last year there hasn’t been a single poll showing Romney leading in Oregon. But the lead is no longer so big that Obama would be safe completely ignoring the state. Romney could cause some heartburn for Obama there if he put some effort into the state.
There have also only been five Oregon polls in the last year. If additional polling shows the current status is closer to the most recent poll than the previous four, and Romney continues to make gains, then Oregon may well move into swing state status later in the race.
Since Oregon is neither entering or leaving swing state status, the summary stays the same:
|
Romney |
Obama |
| Romney Best Case |
276 |
262 |
| Current Status |
220 |
318 |
| Obama Best Case |
170 |
368 |
Edit 2012 May 20 06:30 UTC – Fixed Map, SC was incorrectly colored as a swing state, it is now correctly colored as “Weak Romney”.
|
|


