- 06:52:42 Poll Added: YouGov w/4P in FL from 2016-06-21 to 2016-06-24 – Clinton 44% to Trump 41% https://t.co/wAwb3ZNORW
- 07:01:43 Full 4P results logged: YouGov w/4P in FL from 2016-06-21 to 2016-06-24 – Clinton 44% to Trump 41% to Johnson 3% to Stein 1%
- 07:08:47 Poll Added: YouGov w/4P in CO from 2016-06-21 to 2016-06-24 – Clinton 40% to Trump 39% https://t.co/CbB6vTB3u3
- 07:15:19 Full 4P results logged: YouGov w/4P in CO from 2016-06-21 to 2016-06-24 – Clinton 40% to Trump 39% to Johnson 4% to Stein 1%
- 07:21:47 Poll Added: YouGov w/4P in WI from 2016-06-21 to 2016-06-24 – Clinton 41% to Trump 36% https://t.co/rxvvjETdiy
- 07:24:05 Full 4P results logged: YouGov w/4P in WI from 2016-06-21 to 2016-06-24 – Clinton 41% to Trump 36% to Johnson 3% to Stein 1%
- 07:27:04 Poll Added: YouGov w/4P in NC from 2016-06-21 to 2016-06-24 – Clinton 44% to Trump 42% https://t.co/EeVrctC5UF
- 07:27:09 Full 4P results logged: YouGov w/4P in NC from 2016-06-21 to 2016-06-24 – Clinton 44% to Trump 42% to Johnson 2% to Stein 1%
- 07:41:30 Poll Added: PPH/MST in ME-All from 2016-06-15 to 2016-06-21 – Clinton 42% to Trump 35% https://t.co/jFDO56M3jV
- 07:44:42 Poll Added: PPH/MST in ME-CD1 from 2016-06-15 to 2016-06-21 – Clinton 48% to Trump 33% https://t.co/fSlQ9baLLg
- 07:47:52 Poll Added: PPH/MST in ME-CD2 from 2016-06-15 to 2016-06-21 – Clinton 36% to Trump 37% https://t.co/6nNzyz3eg4
- 07:58:33 Poll Added: Hendrix w/3P in AR from 2016-06-21 to 2016-06-21 – Clinton 36% to Trump 47% https://t.co/XSQuLYfVX5
- 07:58:38 Full 3P results logged: Hendrix w/3P in AR from 2016-06-21 to 2016-06-21 – Clinton 36% to Trump 47% to Johnson 8%
- 07:58:45 Clinton vs Trump state category change: AR has moved from Strong Trump to Solid Trump https://t.co/XSQuLYfVX5
- 08:20:16 Poll Added: Saint Leo in FL from 2016-06-10 to 2016-06-16 – Clinton 50.1% to Trump 35.3% https://t.co/9EOjgRoJ6j
- 08:23:17 Poll Added: Saint Leo w/3P in FL from 2016-06-10 to 2016-06-16 – Clinton 45.8% to Trump 33.1% https://t.co/dA0reaHccj
- 08:23:22 Full 3P results logged: Saint Leo w/3P in FL from 2016-06-10 to 2016-06-16 – Clinton 45.8% to Trump 33.1% to Johnson 5.9%
- 08:23:28 Clinton vs Trump state category change: FL has moved from Weak Clinton to Strong Clinton https://t.co/dA0reaYN3R
- 08:28:04 Clinton vs Trump tipping point change: Clinton by 3 in FL -> Clinton by 4 in OH https://t.co/2hHiW37kHV
- 08:28:05 Trump best case vs Clinton has changed: Clinton 231 to Trump 307 -> Clinton 260 to Trump 278 https://t.co/2hHiW37kHV
- 08:41:12 That’s it for today. Polls added in FL/CO/WI/NC/ME-All/ME-CD1/ME-CD2/AR. There was a notable change, so @ElectionGraphs blog post later.
Since the last update, which was only a day ago, new poll data was added for Florida, Colorado, Wisconsin, North Carolina, Maine (at large and each congressional district), and Arkansas. The Colorado poll was much needed as it has been under polled. Arkansas and Maine as well. But only the Florida poll made a difference. Specifically, the polls in question actually covered a timeframe from earlier in the month, so the last couple weeks of the charts are modified.
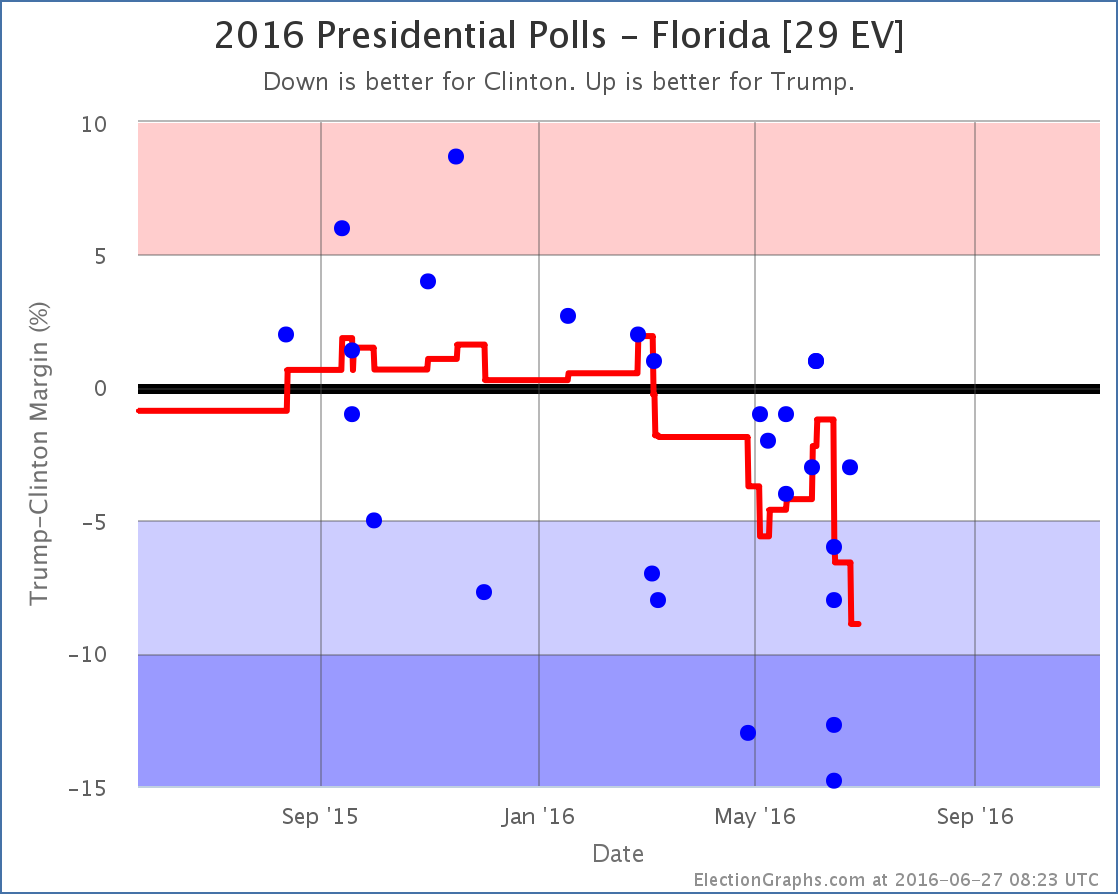
The poll average in Florida now only covers two weeks of polling. We are definitely in the general election season. The last two weeks of polls have not been kind to Trump in Florida. With this update earlier polls showing Florida close fall off the calculation and so the average drops rapidly. The two worst results for Trump in the current average were the ones added in this update. They are from Saint Leo University (one including Johnson as an option and one without). These are the 1st and 3rd worst numbers Trump has ever had in Florida. They may prove to be outliers. We’ll see what the next polls bring. For the moment though, Clinton’s lead in Florida grows to 8.9%. This is a rapid drop and takes Florida from “Weak Clinton” to “Strong Clinton”. So we take Florida out of the list of potential Trump states in his best case.
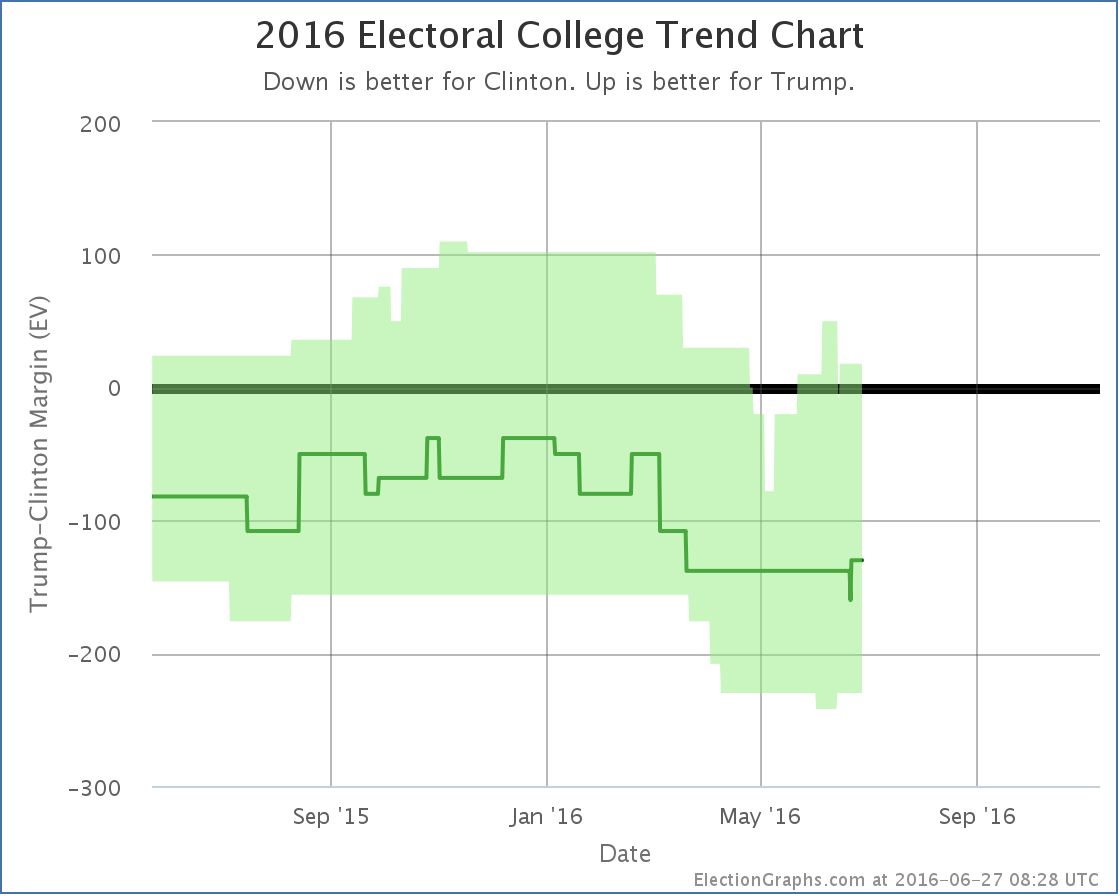
As mentioned, the timeframes covered by the Florida polls that were just added and which caused the change are older… June 10-16.. so the drop in the best case from Florida actually gets inserted before the bump up caused by Trump getting closer in Virginia. So the chart now actually shows a huge drop due to Florida, then a day later the bump up caused by Virginia. With this update Trump’s best case dropped from a 76 electoral vote win to a 18 electoral vote win, but that 78 vote win is actually wiped off the chart entirely since the Florida change actually happened before the Virginia one. Since Florida was the tipping point state, the tipping point also moves:
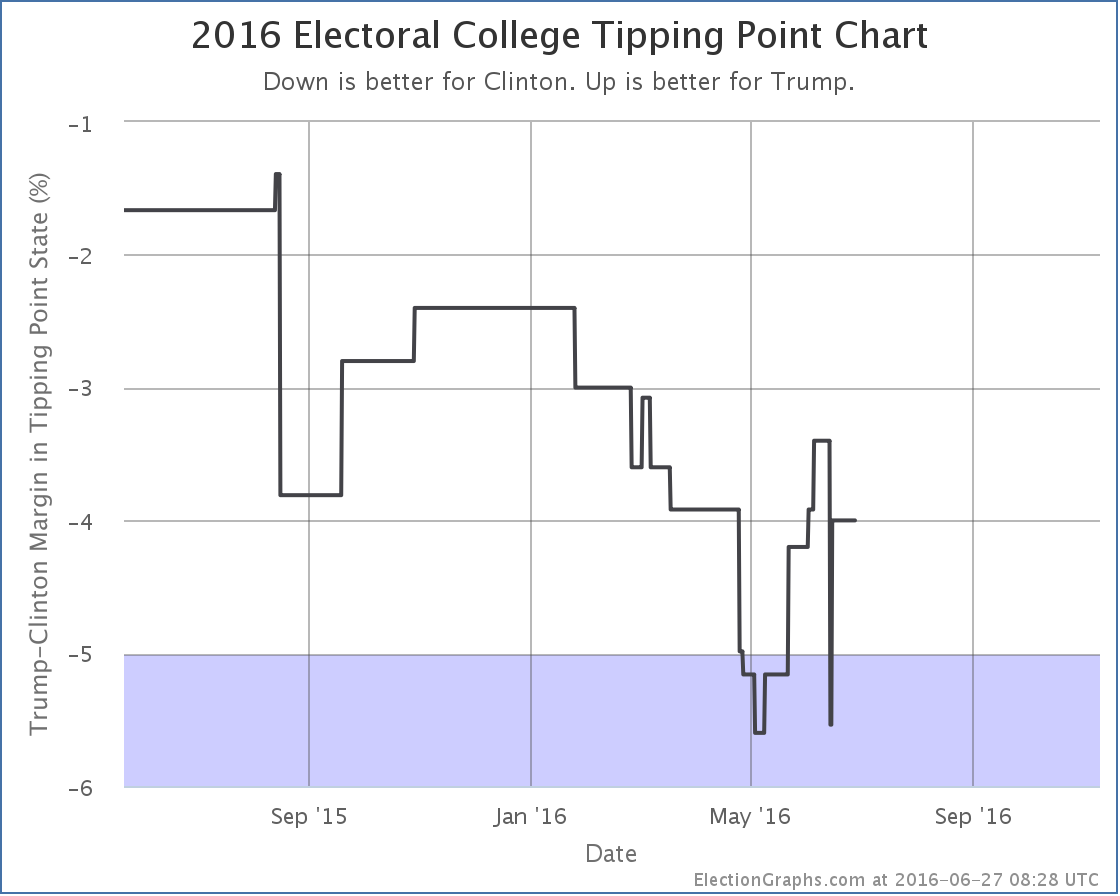
As with Trump’s best case, the tipping point now shows a big drop from Florida, then a gain a day later when Virginia moved in the opposite direction. In the end this update causes the tipping point to move from Clinton by 3.0% in Florida to Clinton by 4.0% in Ohio. And once again that previous peak is just wiped off the chart because the Florida change happened before Virginia. Just yesterday I noted that when looking over a two month time horizon 3 out of the 4 metrics Election Graphs tracks have moved in Trump’s direction, and the fourth was flat. This is still true today, and it is even true if you only look at a one month time horizon, but without Florida those gains are lessened significantly. With today’s updates however, you can now start to see some movement away from Trump in the last two to three weeks. We will not know for a while yet though if this is the start of a larger trend toward Clinton, or if Trump will bounce back. Without Florida in play, to win Trump has to almost sweep the states where Clinton leads by less than 5%… Arizona, Pennsylvania, Iowa, Virginia, Nevada and Ohio… he can afford to lose one of the small 6 EV states (Iowa and Nevada)… as well as holding all the states where he has only a narrow lead. That is a tall order given current polling. 134.3 days until polls start to close on Election 2016. Note: This post is an update based on the data on ElectionGraphs.com. Election Graphs tracks both a poll based estimate of the Electoral College and a numbers based look at the Delegate Races. All of the charts and graphs seen in this post are from that site. Additional graphs, charts and raw data can be found there. Follow @ElectionGraphs on Twitter or like Election Graphs on Facebook to see announcements of updates or to join the conversation. For those interested in individual general election poll updates, follow @ElecCollPolls on Twitter for all the polls as they are added. If you find the information in these posts interesting or useful, please consider visiting the tip jar. Edit 17:40 UTC to add “Without Florida in play…” paragraph near the end. Edit 18:55 UTC to acknowledge that Trump could actually afford to lose one of the 6 EV states.
Since the last update there have only been polls in North Carolina and Texas, but North Carolina makes a difference:
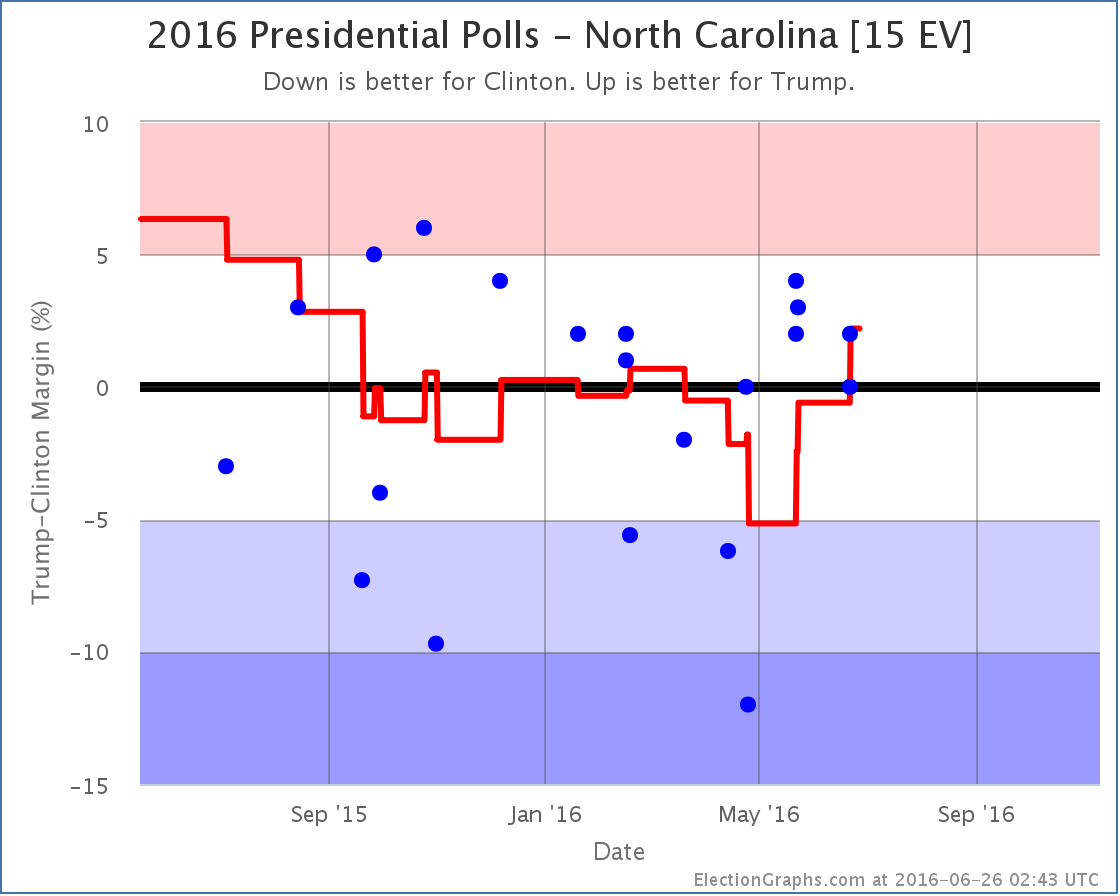
A particularly good poll for Clinton from April rolls off the average and now all the recent polls have Trump ahead or tied in North Carolina. The average is now a 2.2% Trump lead. North Carolina has been back and forth between Clinton and Trump several times over the last year, but Trump’s position at the moment is now better than it has been since last September. Only a month ago, Clinton was at her best position in the last year. Is this an actual dramatic swing toward Trump in North Carolina? Maybe. It is also possible that there is just highly volatile polling, and Clinton had a good run, and now Trump is having a good run. The bottom line is that North Carolina has spent all but a handful of weeks in the last year with neither candidate having a lead of more than 5%. In other words, it is a close state that could go either way. But for now, Trump is once again in the lead, so North Carolina goes into his column for the expected results:
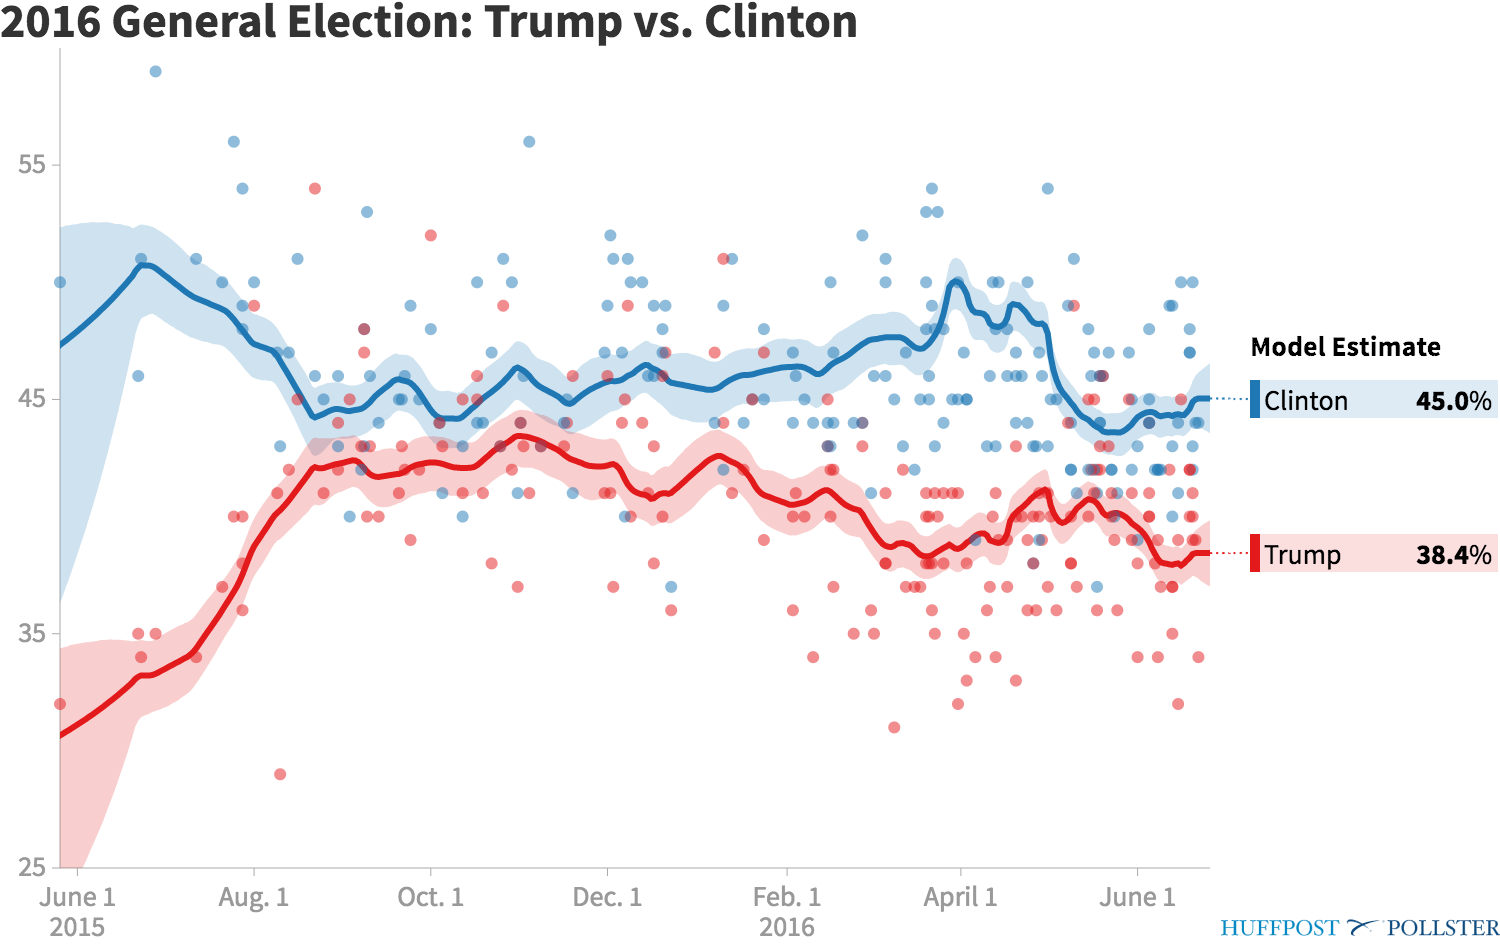
Since North Carolina has more electoral votes than Arizona, this more than reverses the movement of the expected result from a few days ago when Arizona flipped (just barely) to the blue side. Looking back and comparing now with exactly two months ago, we see that Trump’s best case has improved from a Clinton 20 EV win to a Trump 76 EV win. The “expected” case has improved from a 138 EV loss to a 130 EV loss. Clinton’s best case has stayed the same. The tipping point has also moved from Clinton by 5.2% to Clinton by 3.0%. So in 3 out of 4 measures, Trump has improved. In the other there has been no change. In the Pollster national poll average over the same time period Trump has gone from being behind by 7.4% to being behind by 6.6%. Wait… what was that last one? Hasn’t everybody been talking about how Trump has been collapsing in the national polls? But he has actually gained ground in the past two months! What is going on here? Here is the national chart from Pollster:
How much and in what direction the gap has changed of course all depends on what timeframes you are comparing. Trump had narrowed the national gap with Clinton to only about 3.2% in mid May. (The RCP average actually had him very slightly ahead at the peak.) Since then, he has fallen back. But he is still better off than he was in late April. And he has improved even more dramatically if you compare to late March. So the longer term national trend is the gap between Trump and Clinton narrowing, despite the opposite movement in the last month. With the high resolution polling on the national picture, you could see the “Trump Bump” when after securing the nomination Trump closed the gap and then fell back again. With the slower state by state picture, that essentially may have happened too quickly for it to be visible. Overall Clinton is clearly in a dominant position over Trump. But Trump has indeed been catching up in a number of states. He hadn’t actually pulled a state over to his side since February though. Just as it is now, it was also North Carolina back then… and that time it only lasted a month or so before the state went blue again. We will see soon enough if North Carolina stays red longer this time, and if Trump can pull more “Weak Clinton” states to his side. Pulling back Arizona would be the obvious first target, followed by Pennsylvania, Iowa and Florida. With those four states, Trump would take an overall lead for the first time. That is all it would take. Four states. Of these Trump is furthest behind in Florida, but he is only behind by 3.0% there. With all the talk of how dire Trump’s situation is, he really isn’t that far back. If Trump has a few good weeks and Clinton has a few bad weeks, that can change quickly. Keep watching. 135.8 days until the polls start closing on election day. Note: This post is an update based on the data on ElectionGraphs.com. Election Graphs tracks both a poll based estimate of the Electoral College and a numbers based look at the Delegate Races. All of the charts and graphs seen in this post are from that site. Additional graphs, charts and raw data can be found there. Follow @ElectionGraphs on Twitter or like Election Graphs on Facebook to see announcements of updates or to join the conversation. For those interested in individual general election poll updates, follow @ElecCollPolls on Twitter for all the polls as they are added. If you find the information in these posts interesting or useful, please consider visiting the tip jar.
This week on Curmudgeon’s Corner, Sam and Ivan’s big topics are the gun control debate and the apparent Trump campaign implosion. Other topics are kid’s summer activities, Brexit (recorded before the vote), and the process of choosing Presidential Electors. For a change of pace, Sam wraps it up with interviews of several delegates to the 2016 Washington State Democratic Convention. Click below to listen or subscribe… then let us know your own thoughts!
Length this week – 2:42:20
Show Details:
Note: Timestamps are accurate, but many audio players are not very precise on the timestamps they show, so depending on your player, if you scan to a specific time, you may not get exactly what is shown above and may have to scan back or forward a bit to get what is expected. |
||