This is the website of Abulsme Noibatno Itramne (also known as Sam Minter).
Posts here are rare these days. For current stuff, follow me on Mastodon
|
Today’s update (which included a Detroit News poll in MI and Quinnipiac polls in Florida, Ohio and Pennsylvania) brings seven changes of note to the five best polled candidate pairs. Plus Clinton vs Bush once again takes the top spot as the best polled candidate pair, but there isn’t much else to say about that. As usual, click on any of the charts for more details from election2016.abulsme.com or follow @ElecCollPolls on Twitter for detailed poll information as I add it.
Tipping Point Moves
Five of those seven changes are tipping point changes. (Reminder: The tipping point is the margin in the state that would put the winning candidate “over the top” in the electoral college.) The tipping point changed for all five of the candidate pairs, so instead of looking at them individually, lets look at the comparison:
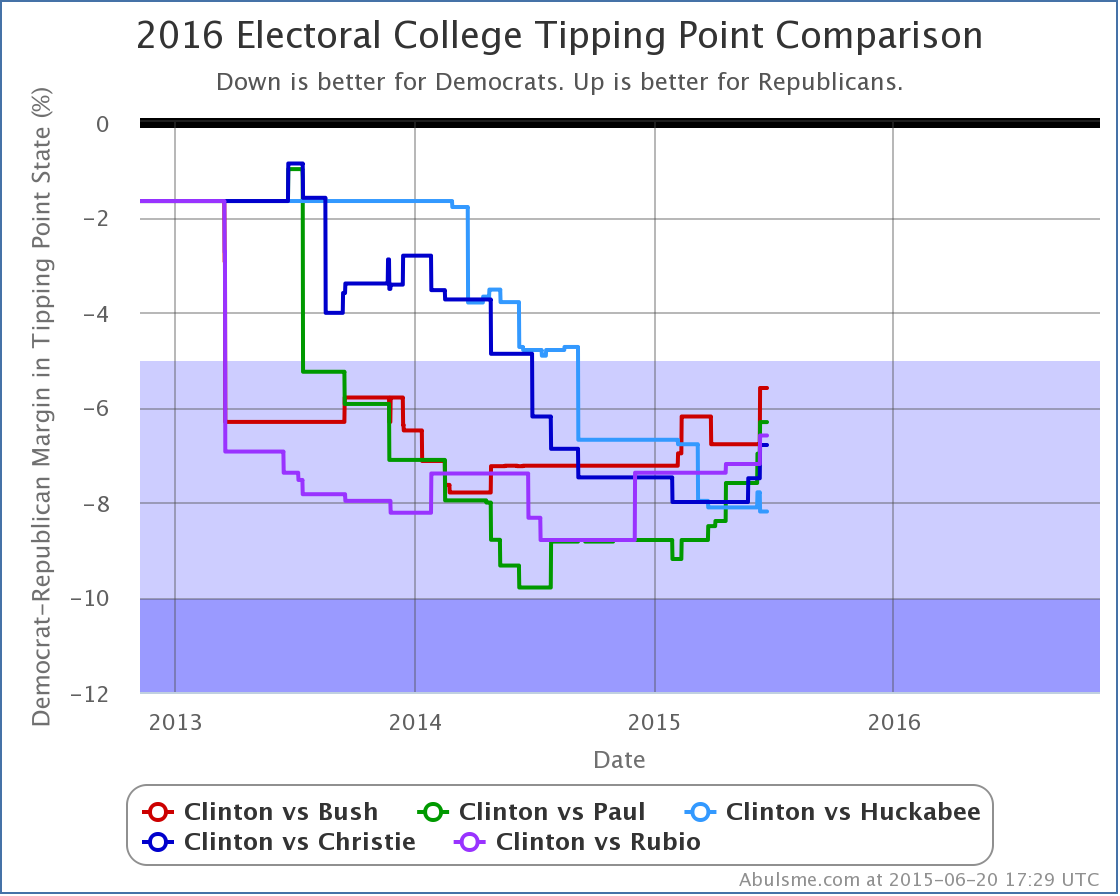
Looking both at the most recent change, and also at the change over the last three months, Bush, Paul, Christie and Rubio have all improved vs Clinton. Only Huckabee’s situation has worsened. For the candidates that are improving, the movement seems to be accelerating.
Bush’s tipping point specifically is down to only 5.6%. This still translates into a “Strong” lead for Clinton according to the categories I have defined, but we’re getting pretty close to the 5.0% boundary. Just a few more good polls for Bush in the right states, and the tipping point could move into the “Weak Clinton” zone, meaning that if Bush managed to win all of the close states (including the ones where Clinton is a little ahead) he would win. At that point, we would have an actual competitive race. Clinton would still be ahead, but a Bush win would be within the realm of reasonable possibility.
Clinton vs Bush
In addition to the tipping point changes, a couple of states changed categories. First up, Bush in Florida.
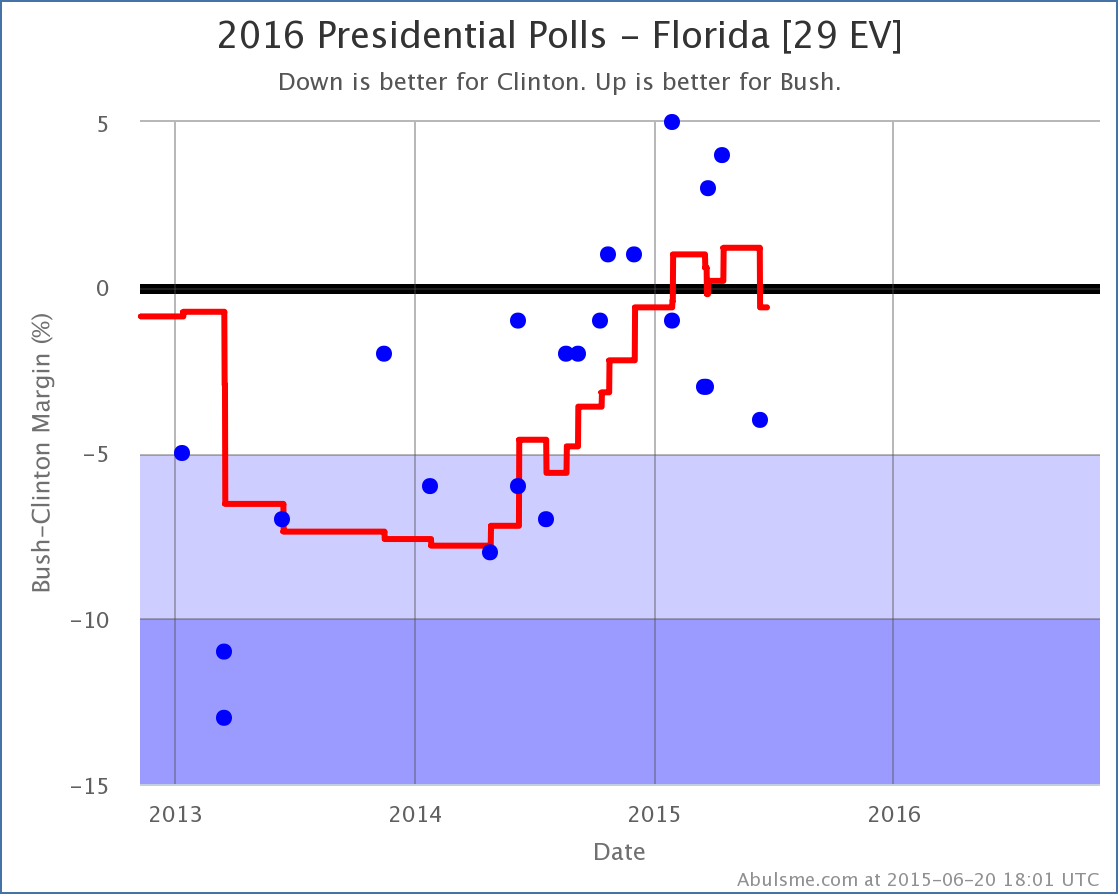
Florida moves from just barely Bush, to just barely Clinton. Bottom line, in this paring, Florida is close. Right now this is true for only Bush and Rubio. The other three Republican candidates in the top five polled pairs trail Clinton badly:
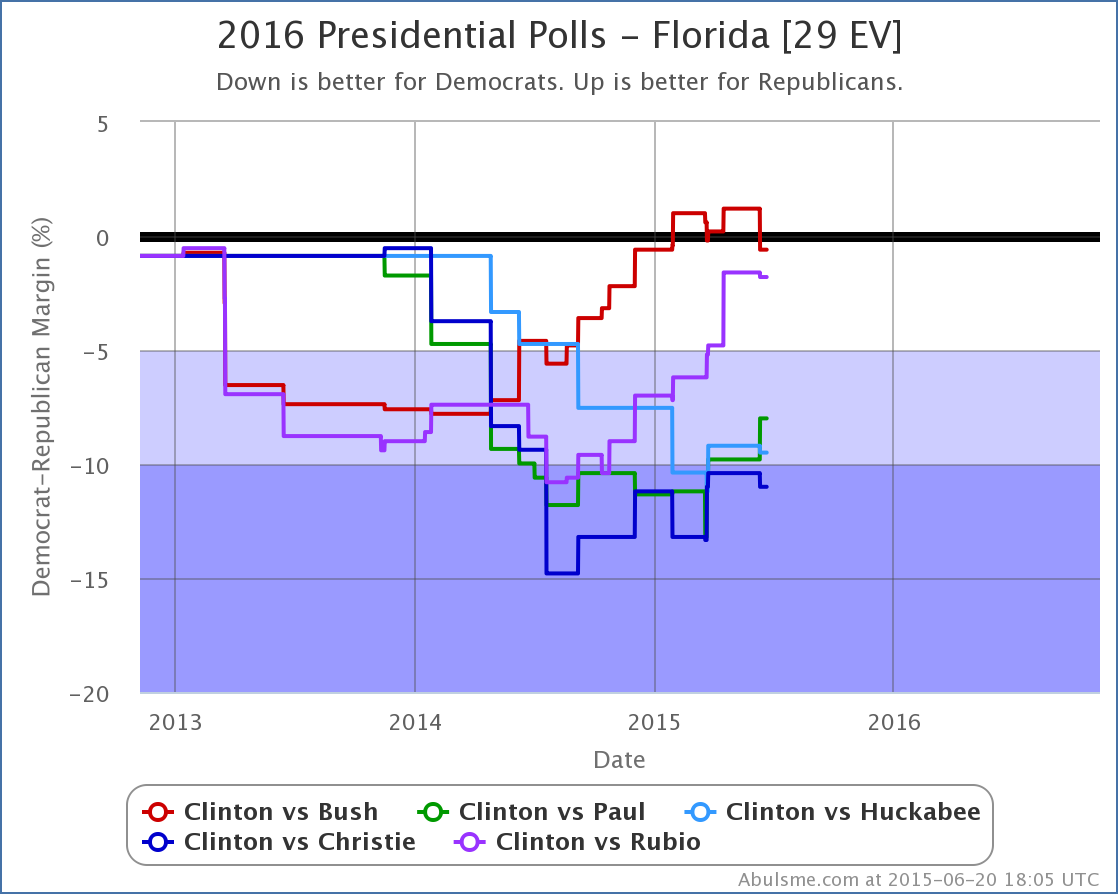
For Bush though, for the moment, Florida slips off the list of states he is ahead in, and his “expected case” drops:
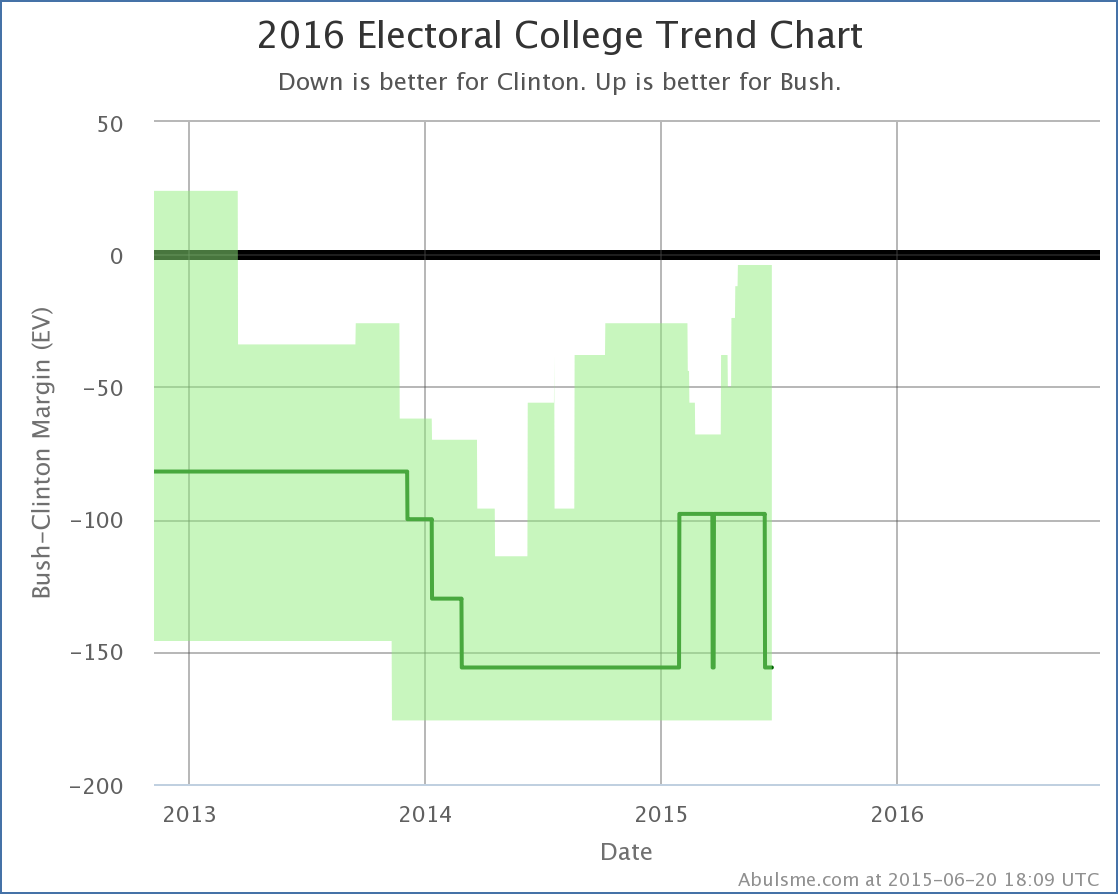
This brings Bush’s “expected” result back to Clinton 347 to Bush 191, a 156 electoral vote loss. (This is the same margin at the moment as Huckabee, Christie and Rubio… only Paul differs right now, losing by only 138 electoral votes because unlike the others, Paul is ahead in Colorado.)
Clinton vs Paul
The other category change is that in Clinton vs Paul, Ohio moves from Strong Clinton to Weak Clinton:
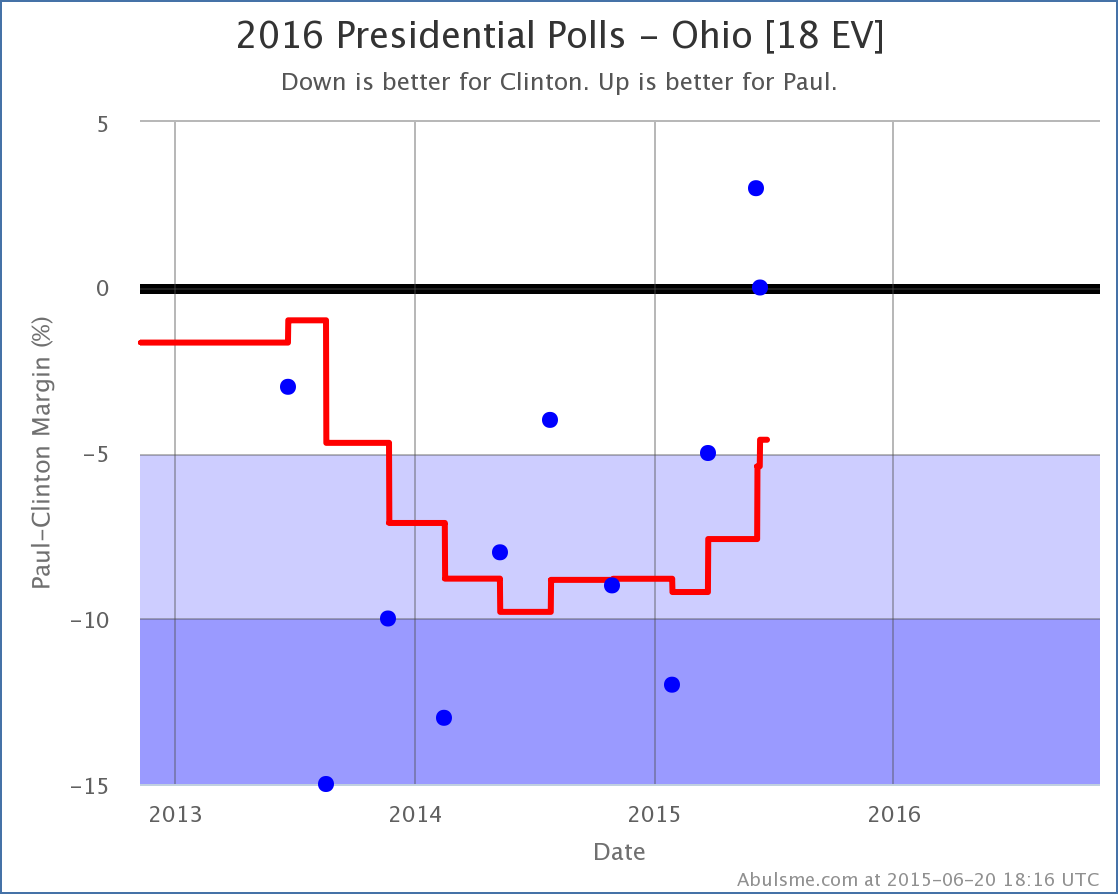
The last two polls actually show Paul ahead in Ohio. The average, which covers almost 8 months of polls at the moment, isn’t there yet, but it is moving in Paul’s direction. Ohio is looking closer and closer.
And that isn’t just Paul. If we do the comparison in Ohio, we see this movement is broader:
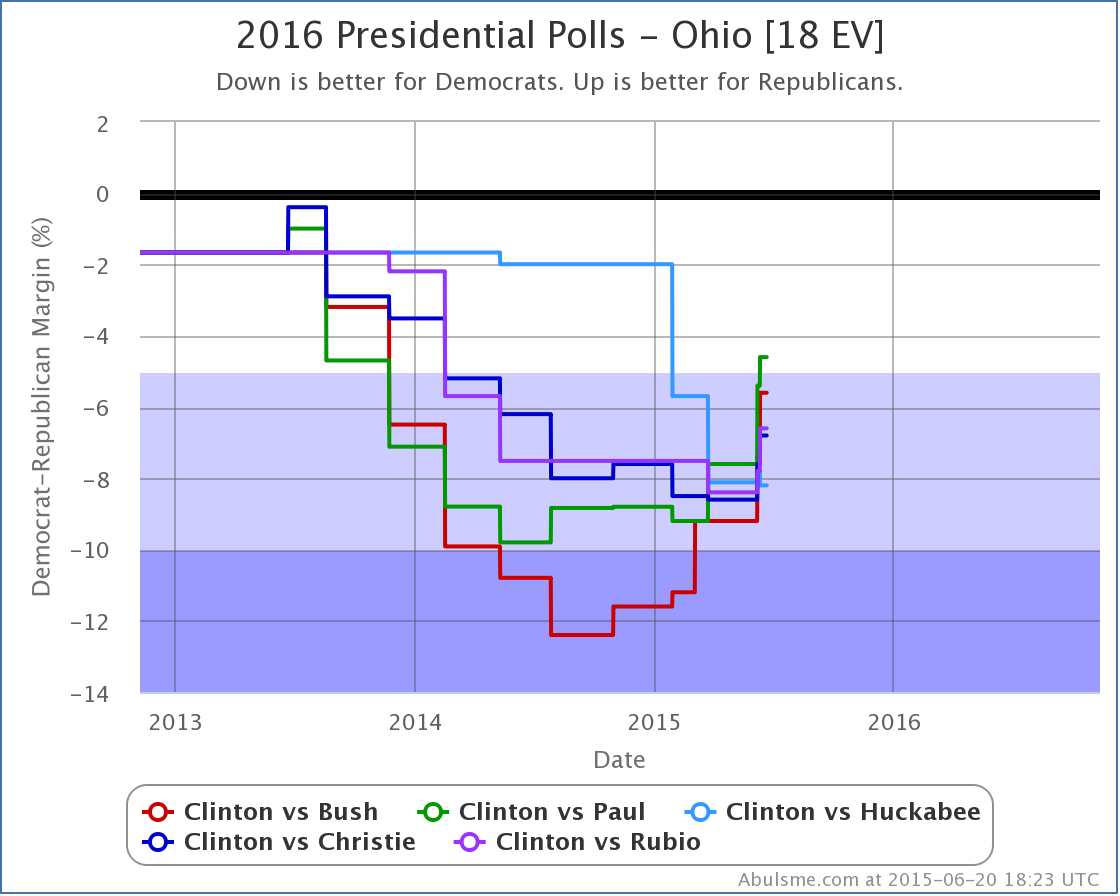
Once again, everybody except Huckabee is improving against Clinton. Or perhaps it would be better to say that Clinton is falling. Either way, Ohio is looking closer than it did. Paul is the first of these five candidates to move Ohio into the “potential win” category according to my classifications, but Bush isn’t far behind.
For Paul, this improves his “best case” where we give him all of the states he is ahead in, plus all the states where Clinton’s lead is less than 5%:
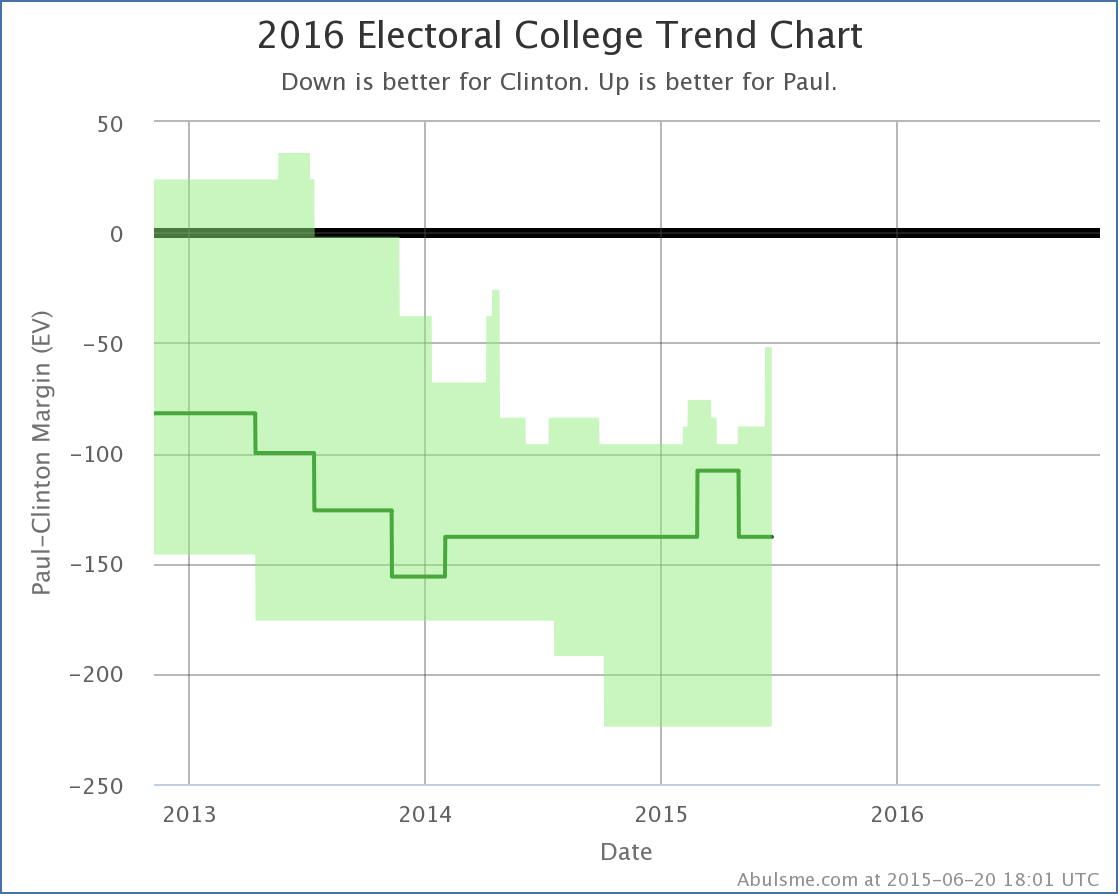
In his “best case” Paul now only loses to Clinton by 52 electoral votes. This is Paul’s best best case since I officially launched this analysis after the November election.
Pennsylvania
The polls this time around in Michigan didn’t change anything, but the ones in Pennsylvania are worth mentioning even though there were no category changes for any of the five candidate pairs.
Brandon Finnigan (@ConArtCritic) of the Ace of Spades HQ Decision Desk election tracking site tweets constantly about how Republicans should be targeting Pennsylvania as the keystone (get it?) to their election strategy. In his recent article “How The GOP Could Win Pennsylvania” he outlines the argument. So lets look at how the state is going given current polling. (Which of course will change a lot before we get to the election.)
Moves in Pennsylvania did contribute to some of the tipping point changes we talked about today, and when we look at Pennsylvania, we are seeing what looks like clear movement toward the Republicans, even though it isn’t quite switching categories yet:
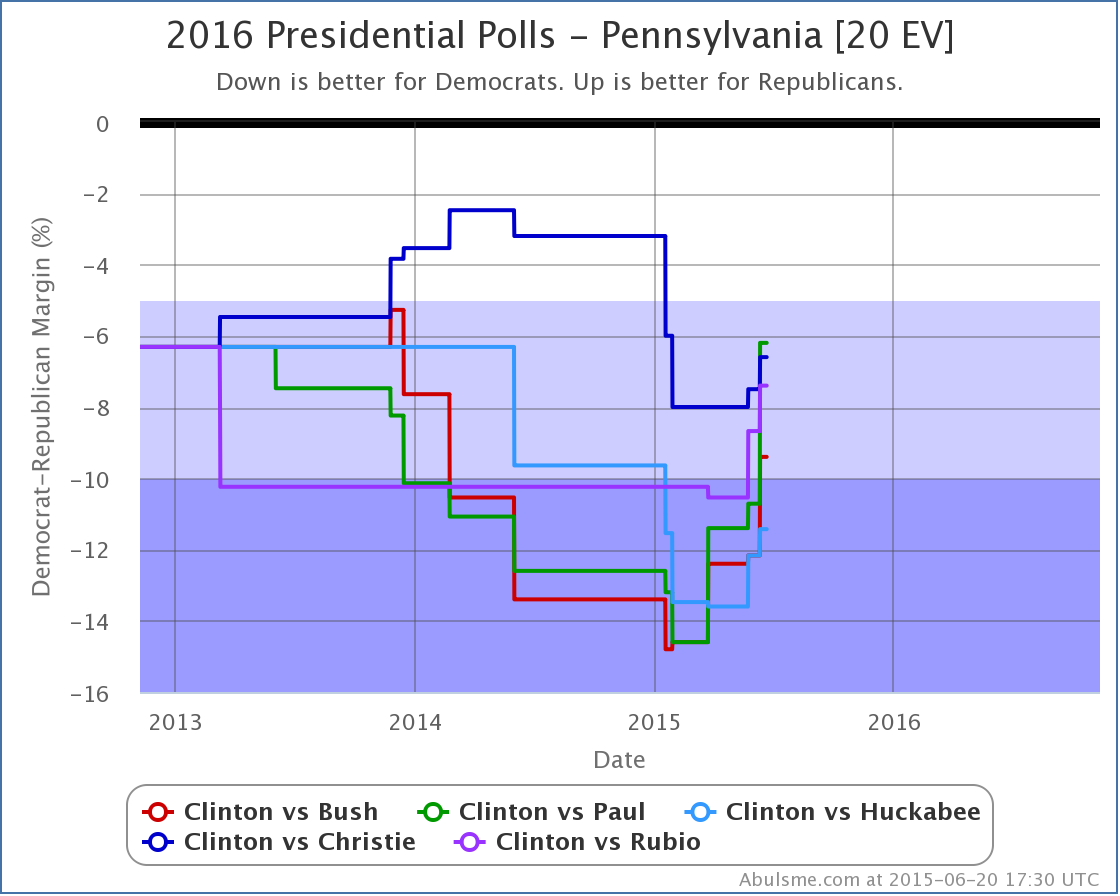
All five candidates have improved against Clinton in the last three months, some of them by large margins. Paul went from down by 14.6% in March, to down by only 6.2% right now. That is a huge move!
Now, this probably isn’t because any of the candidates are specifically targeting Pennsylvania at this point, but more likely just a reflection of Clinton’s overall decline nationally. None of the candidates have made it close in my poll averages yet, but Clinton’s margins have been narrowing rapidly.
Finnigan is certainly right that if the Republicans can make Pennsylvania close, let alone turn it red, this probably means an overall Republican victory in the electoral college, because whatever they did that could flip Pennsylvania would almost certainly flip other blue states that currently are closer than Pennsylvania as well.
Now, does that mean targeting Pennsylvania specifically rather than going after those closer states first is the best strategy? I don’t know.
For Bush for instance, if you start with the states he is already ahead in and then see which states he would need to flip to win, you get this list (in order by how far behind Bush is right now in my poll averages):
At that point Bush would have enough electoral votes to win. To get to Pennsylvania on this list, you’d have to also go past Minnesota, Nevada, Wisconsin, and Michigan. Then Pennsylvania.
Would it be better to concentrate directly on the seven states above? Or is jumping forward to Pennsylvania’s 20 electoral votes somehow an easier path? If Pennsylvania is specifically more vulnerable due to some of the factors Finnigan mentions, then maybe.
I think Finnigan’s point is broader than that though. It isn’t that Pennsylvania is a better target than Ohio or Colorado, although maybe it is. It is more that if the Republicans took Pennsylvania seriously, and did everything they needed to do to win Pennsylvania, then those same things could be applied more broadly, and a lot of other states would move too, and the Republicans would not just win, but win clearly, not a “just barely” sort of win like they got in 2000 and 2004.
The movement we’re seeing so far does show that Pennsylvania is movable. Can it move enough to make it red? I have my doubts absent the Democratic candidate simply collapsing on a nationwide basis. But Pennsylvania might be worth watching anyway…
Bottom Line
Aside from Florida moving her direction but remaining pretty close, and Huckabee generally not doing well, Clinton seems to be continuing to weaken against most Republicans. This reflects the campaign beginning to get under way in earnest, and the name recognition gap slowly diminishing. The question is where this trend ends. After a few debates happen, do we reach some sort of steady state Clinton lead a bit narrower than it is today, or do the Republicans continue to gain on her until we really have a race that could go either way, or even with Republicans in the lead?
As usual, stay tuned. 507 days to go!
Note: This post is an update based on the data on my 2016 Electoral College Analysis Site. All of the charts and graphs seen here are from that site. Graphs, charts and raw data can be found there for the race nationally and in each state for every candidate combination that has been polled at the state level. In addition, comparisons of the best polled candidate combinations both nationally and each in each state are available. All charts above are clickable to go to the current version of the detail page the chart is from, which may contain more up to date information than the snapshots on this page, which were current as of the time of this post. Follow @ElecCollPolls on Twitter for specific poll details as I add them.
Edit 23:07 UTC to add some additional links to the election site and Twitter.
This last week brought a new set of Ohio results from PPP. With this poll Clinton lost significant ground against basically all opponents in the averages. Concentrating as we usually do on the five best polled candidate combinations, this is what we see:
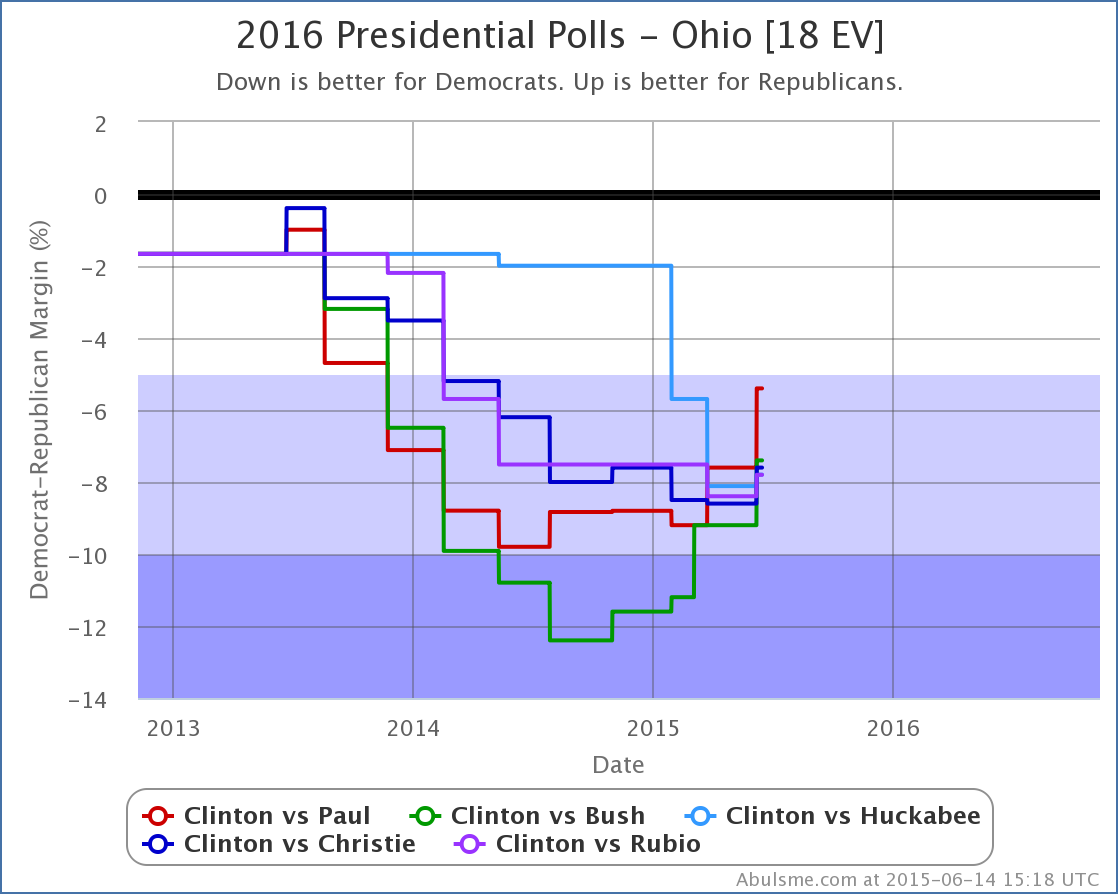
All five of these candidates improved against Clinton based on this latest poll. Looking back a little and comparing now with three months ago, we see that Paul, Bush and Christie have improved their positions, while Rubio and Huckabee have fallen further behind. Of these, Paul has moved the most, from down by 9.2% in March, to only down by 5.4% now, a gain of 3.8%. Paul now does the best of these five candidates against Clinton in Ohio.
Ohio is not a good place for Clinton to be losing ground. Ohio’s 18 electoral votes can make a huge difference. Many paths for Republican victory require Ohio. And the losses here are quite possibly indicative of similar slippage in other states that haven’t been polled enough lately to see it yet. This is not a happy trend for Team Clinton.
Lets switch to looking nationally. Do we see loss of ground there too?
These changes in the Ohio average directly change the tipping point for two of the five candidates, Paul and Huckabee. Paul moves from being down by 7.6% with the tipping point in Ohio, to only being down 7.0% in Minnesota. Meanwhile Huckabee moves from being down 8.1% with the tipping point in Ohio, to being down 7.8%, with his tipping point still in Ohio.
But lets look again at all five candidates against Clinton over not just this change, but the last few months:
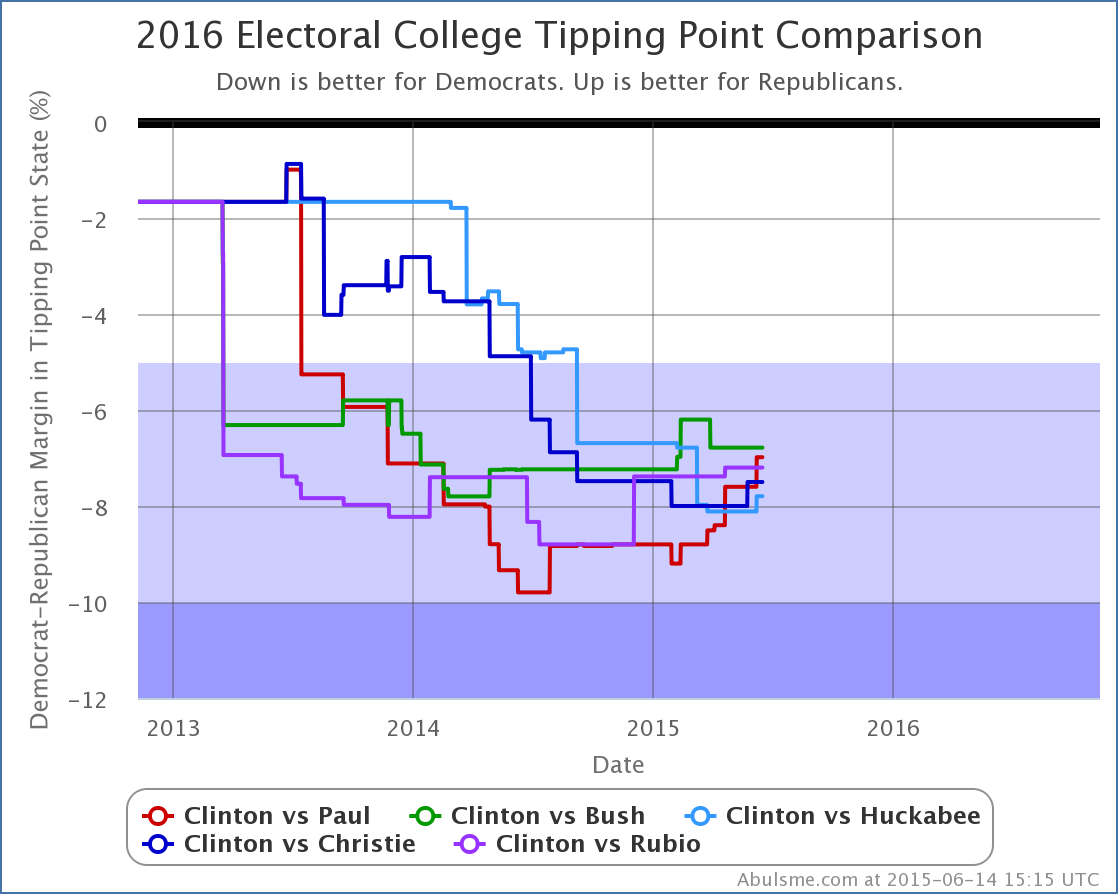
Once again lets compare now to three months ago. Remember, the tipping point essentially represents how much national public opinion needs to move to flip the electoral college result. Paul, Huckabee, Christie and Rubio have all improved since March. Only Bush has declined in that timeframe. (Bush is still better than he was six months ago though.)
Also once again, Paul has improved the most against Clinton during that the last three months, going from down 8.8%, to only down 7.0%.
And yes, yes, all five of these candidates are still way behind. But the overall movement seems to be in the Republican’s favor at the moment. If these trends continue, before too long we may have an actual race on our hands instead of a Clinton blowout!
As I noted in the latest Curmudgeon’s Corner podcast, the real media bias is toward having an exciting race, and while I’m not “the media” I am not immune to this bias… a closer race is a more fun race to watch… so I’ll always be rooting for whoever is behind. :-)
Seriously though, when I posted my first analysis of the 2016 race on this site in November, I mentioned that we should expect tightening, and that Clinton would most likely never again look as good as she did then. The general public had barely heard of most of the non-Clinton candidates, she had come off her Secretary of State stint with fairly high approval ratings, and the campaign against her had yet to start in earnest… and she had been keeping quiet, so fewer opportunities for her to make mistakes too.
As things get in to gear, all of those things change. We’ve just seen the very beginnings of this, and already there is a visible impact in Clinton’s lead. Her lead is still a healthy one, but we’re definitely seeing the signs of the battle starting to be engaged.
513 days to go.
Note: This post is an update based on the data on my 2016 Electoral College Analysis Site. All of the charts and graphs seen here are from that site. Graphs, charts and raw data can be found there for the race nationally and in each state for every candidate combination that has been polled at the state level. In addition, comparisons of the best polled candidate combinations both nationally and each in each state are available. All charts above are clickable to go to the current version of the detail page the chart is from, which may contain more up to date information than the snapshots on this page, which were current as of the time of this post.
With today’s batch of polls added, Clinton vs Paul goes back to being the “best polled” candidate combination by my metric and thus is again the default view on election2016.abulsme.com. No status changes on Clinton vs Paul though.
There were however two other status changes of note that I’ll highlight here. (There were status changes below the five best polled candidate combinations as well, see @ElecCollPolls for those, or for details of the specific polls added today.)
Clinton vs Huckabee
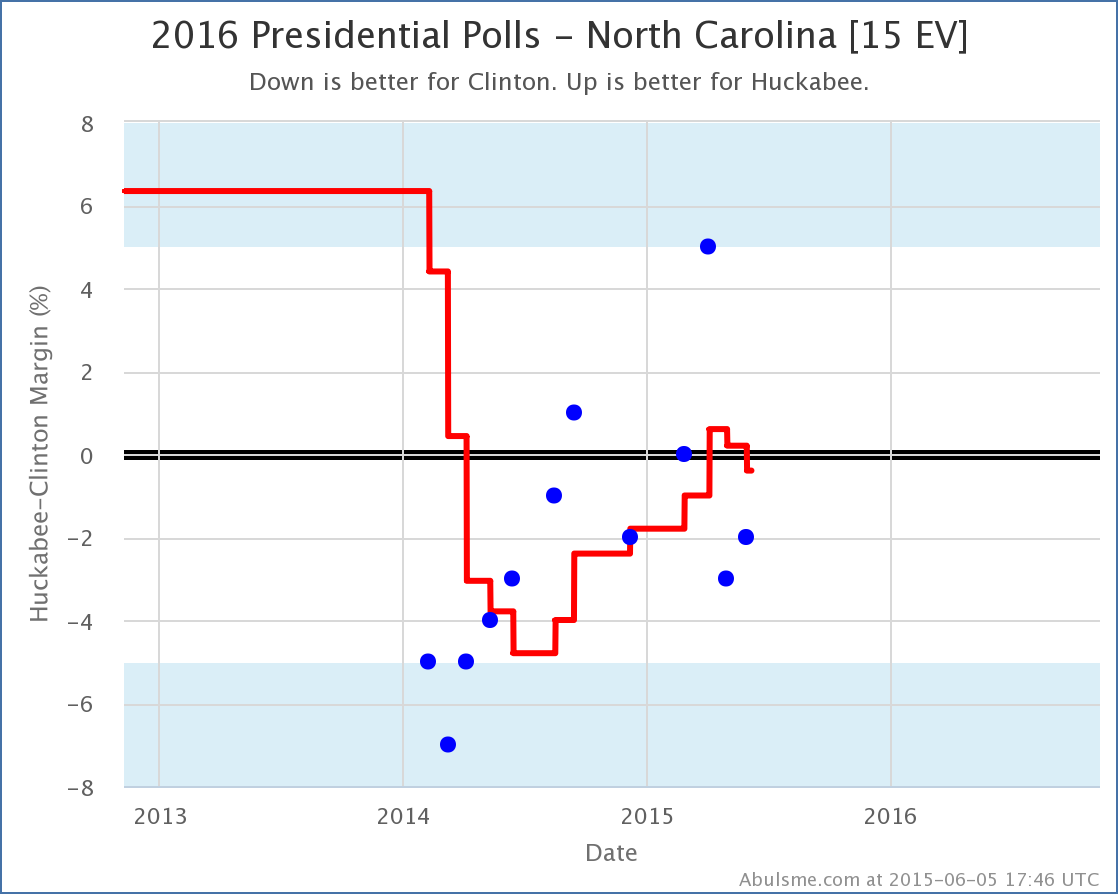
After a flirtation in April and May with actually leading Clinton in North Carolina, the state moves from just barely Huckabee, to just barely Clinton. Either way, North Carolina looks close in this matchup for the moment. This does however change the “expected” result in this match up in Clinton’s favor:
With this, the expected result… where each candidate wins all the states where they are currently ahead… returns to Huckabee losing by 156 electoral votes. (Specifically Clinton 347, Huckabee 191.) This has been the “expected” Clinton vs Huckabee result for most of the last year.
Clinton vs Christie
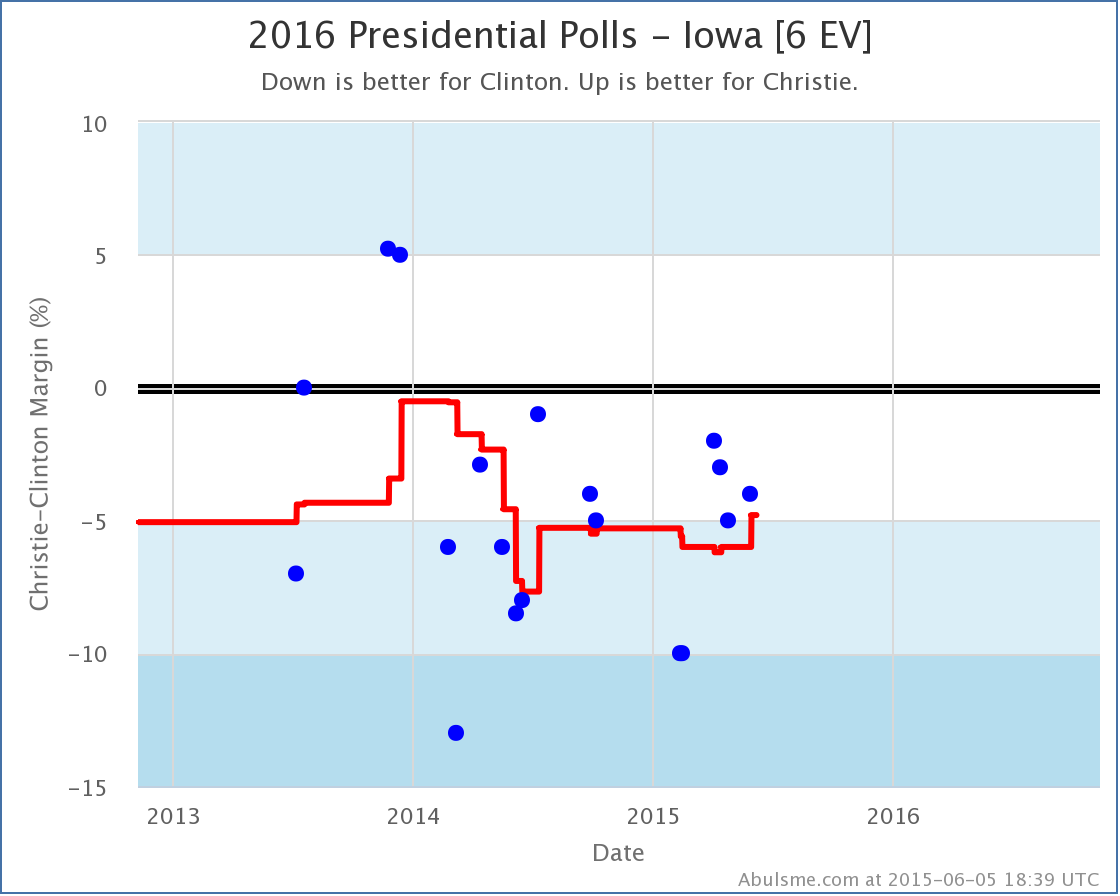
With the latest poll, the poll average for Clinton vs Christie in Iowa show’s Clinton’s lead below 5% for the first time since almost exactly a year ago. A 4.8% lead is still nothing to sneeze at, but it is close enough that we now allow for the possibility of Christie winning Iowa in our range of reasonably possible outcomes, so Christie’s “best case” improves:
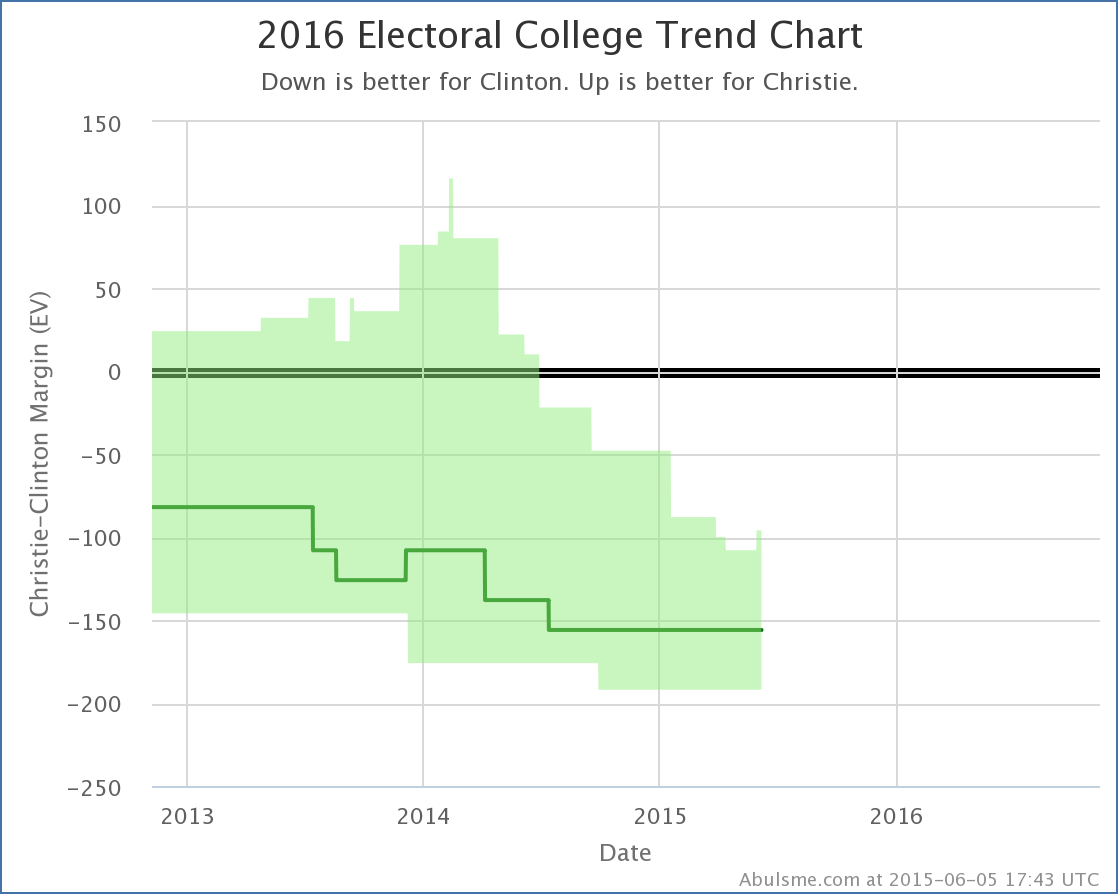
That bump in the top right of the green envelope is the improvement we’re talking about here. Christie’s best case is still a 96 electoral college loss to Clinton. Along with his tipping point improvement that I noted on Saturday though, this makes two moves in Christie’s direction in a week, so maybe there is some new momentum in his direction? Nah, probably not, right?
The Others
There may or may not be a specific move toward Christie, but lets look at the comparison chart in Iowa for all five of the “best polled” candidate combinations…
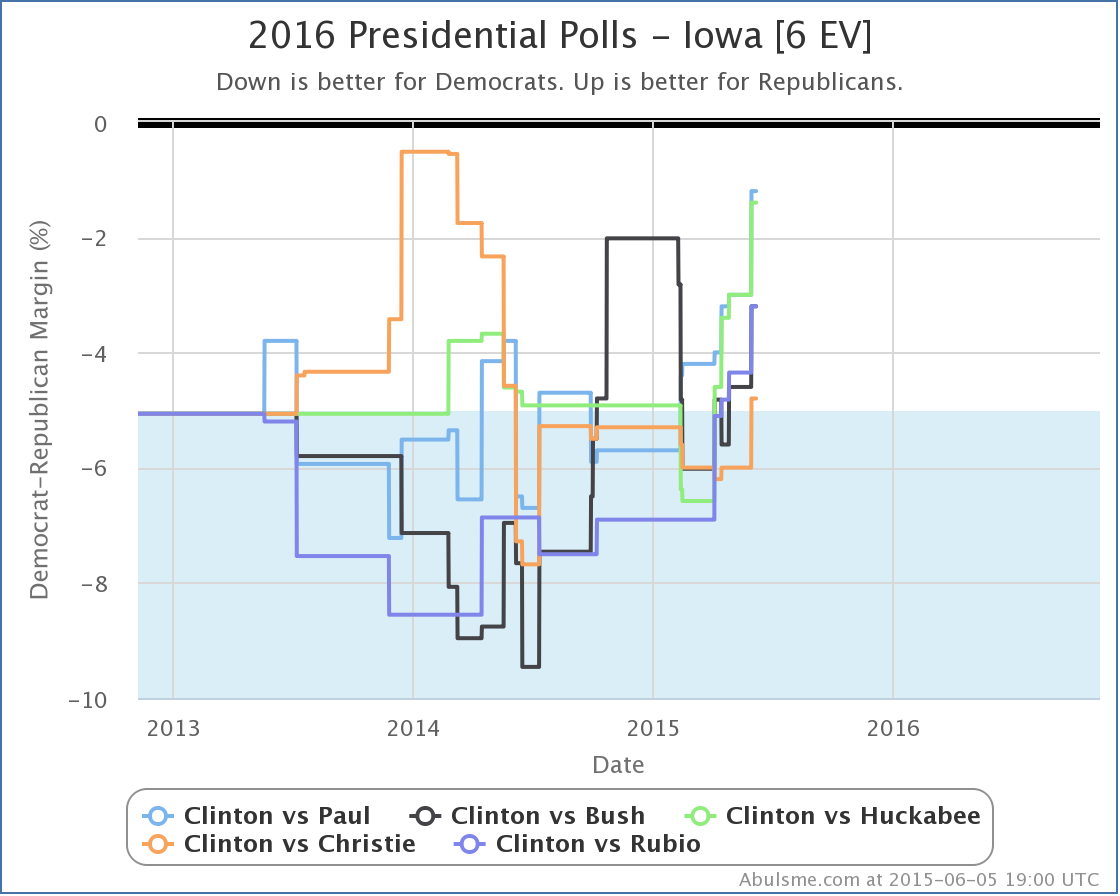
Hmm, definitely looks like some movement there in the last couple months.
Clinton’s lead seems to be evaporating in Iowa vs all five of these Republican challengers. But isn’t she spending all sorts of time in Iowa right now? Of course, Iowa gets attention due to the caucus of course, not an much for the general election, but still. This isn’t a good trend for Clinton.
There is no clear move like this on any of my national trend lines yet, but those take some time to move given that you need polling from a lot of states. But Iowa is one of the most polled states, so this could be a warning sign for Clinton’s broader situation.
522 days until the polls start closing. Plenty of time for drama and movement. Stay tuned!
Note: This post is an update based on the data on my 2016 Electoral College Analysis Site. All of the charts and graphs seen here are from that site. Graphs, charts and raw data can be found there for the race nationally and in each state for every candidate combination that has been polled at the state level. In addition, comparisons of the best polled candidate combinations both nationally and each in each state are available. All charts above are clickable to go to the current version of the detail page the chart is from, which may contain more up to date information than the snapshots on this page, which were current as of the time of this post.
In the latest Curmudgeon’s Corner Sam and Ivan talk about:
* Hiding Things
* Patriot Act Drama
* Election 2016
* Economy Update
* Lightning Round

Recorded 2015-06-04
Length this week – 1:35:58
 1-Click Subscribe in iTunes 1-Click Subscribe in iTunes
 View Podcast in iTunes View Podcast in iTunes
 View Raw Podcast Feed View Raw Podcast Feed
 Download MP3 File Download MP3 File
 Follow the podcast on Facebook Follow the podcast on Facebook
I added some recent results from PPP in Pennsylvania today. PPP polled 13 candidate combinations. Of these only one resulted in a change worth noting in one of our top five best polled candidate combinations. (I consider it a change worth noting if the expected electoral result changes, or the “best case” of one of the two candidates changes, or the tipping point changes.)
Clinton vs Christie
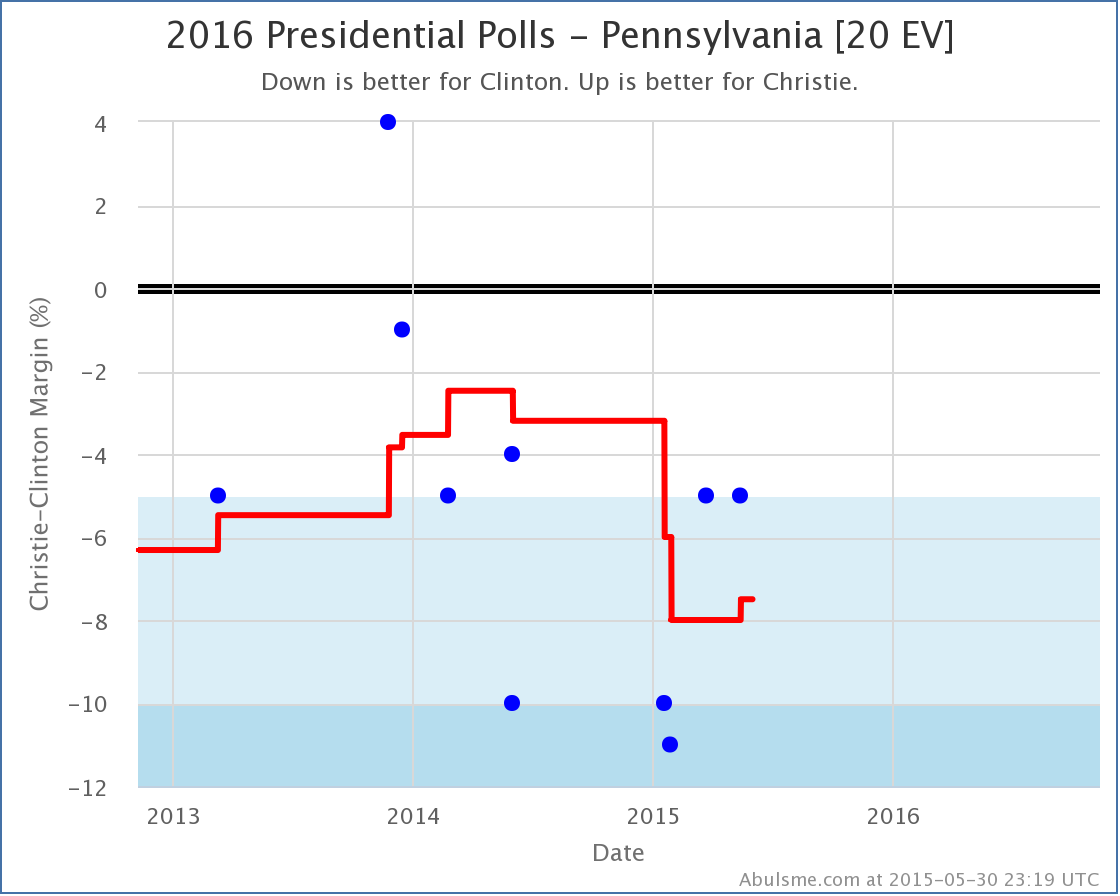
The polling average (which actually contains 6 polls right now rather than the usual five since there is a tie for fifth oldest poll by middate) still shows Clinton with a “Strong” lead, but slightly less of a lead than before. The state doesn’t change categories though, it isn’t close to a “Weak Clinton” state. But it turns out that in Clinton vs Christie, Pennsylvania was the tipping point state, so the topping point changes.
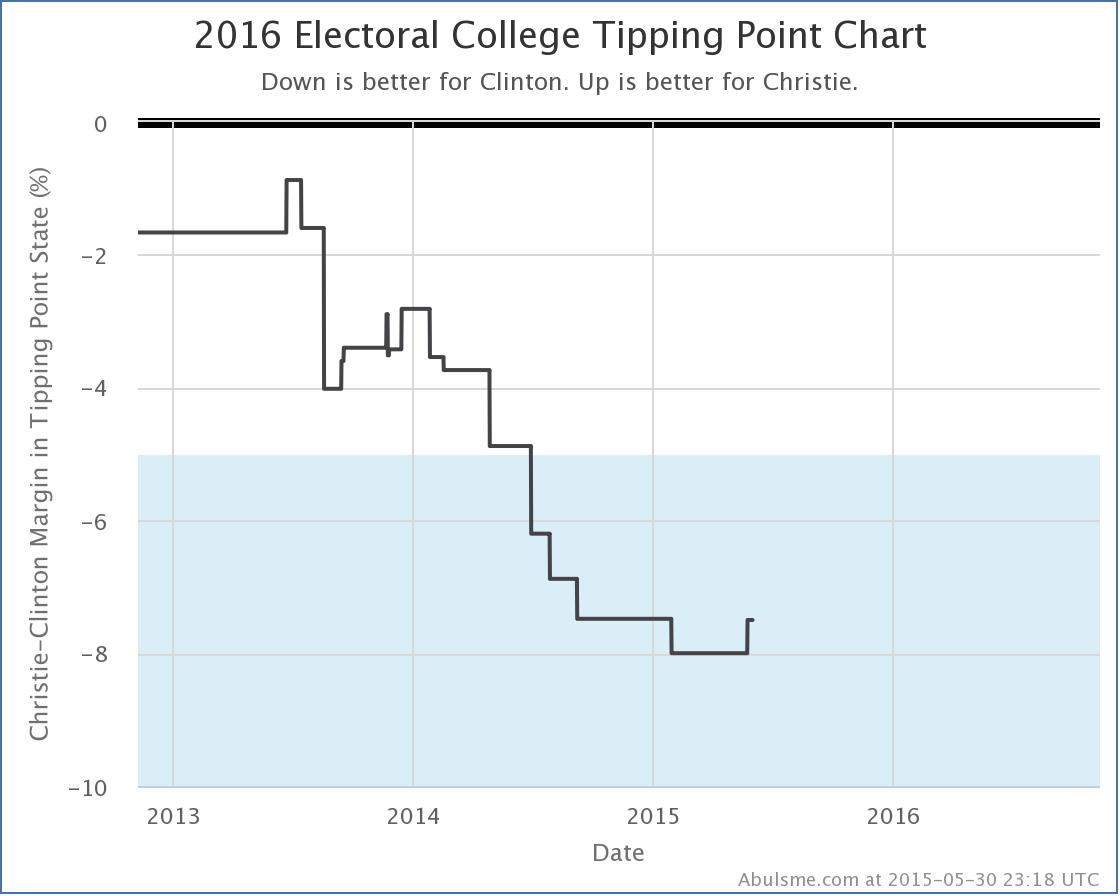
For those who don’t remember, the tipping point is determined by sorting the states by the support level of the candidates, and then seeing which state is the one that would put the winning candidate over the edge. By then looking at the margin in that state, you see how far ahead polls would have to swing on a national basis to change the outcome of the election. In other words, this is a bit like looking at national popular vote numbers, but taking into account the structure of the electoral college. More than most of the other numbers I look at, this represents how far ahead (or behind) a candidate is.
In this case, the tipping point was Pennsylvania, where Clinton was ahead by 8.0%. With the new poll added, the tipping point is still Pennsylvania, but Clinton’s lead is down to 7.5%.
This is the first improvement for Christie in ANY of the metrics I track for Clinton vs Christie since February of last year. Is this the sign of a resurgence for Christie? I kind of doubt it. That ship may have sailed. But it may represent him getting to the point where he won’t get any lower.
The Others
It is worth looking at how some of the other candidates are doing in Pennsylvania though. Here are the Pennsylvania trends for the five best polled candidate combinations at the moment:
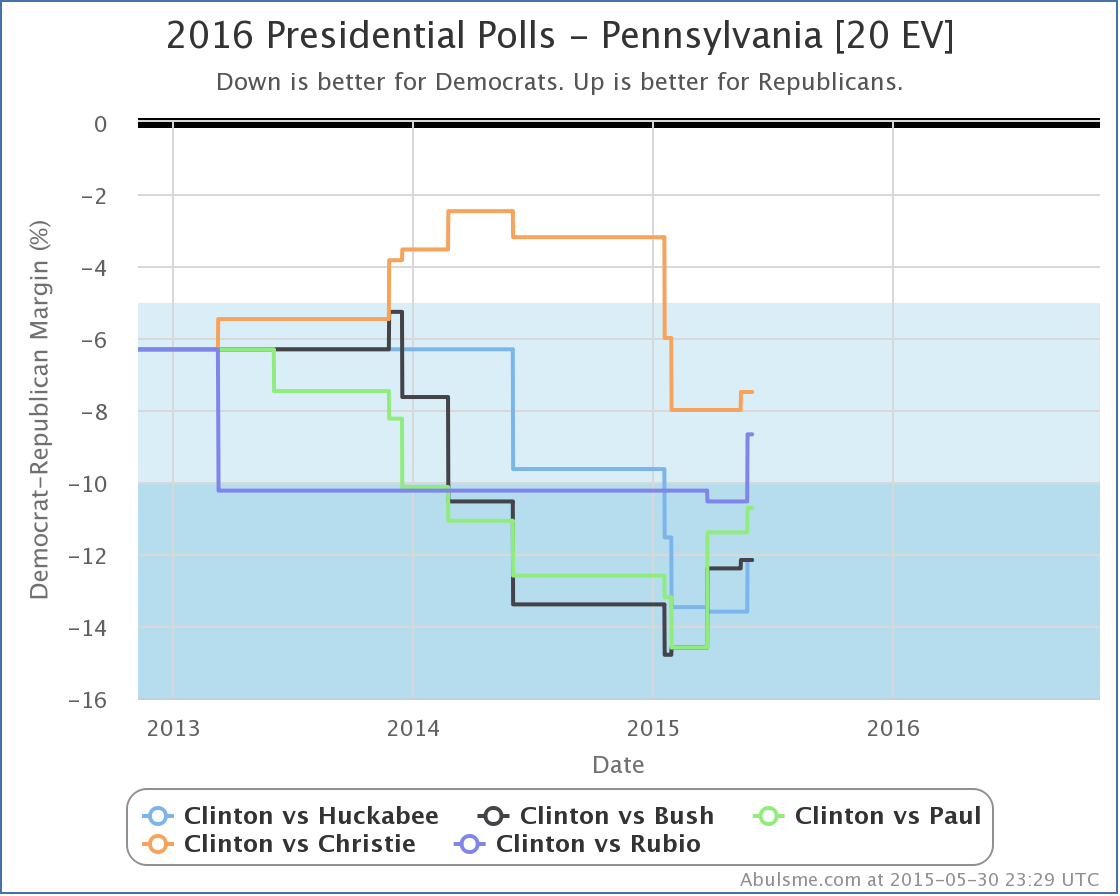
With Christie now enjoying an upward tick of his own, all five Republicans have been improving in Pennsylvania in the last month or so. Bush, Paul and Rubio are all better off than they were at the November elections as well. (Huckabee and Christie are still down from where they were at that point despite the bump in the last month.)
Some of the most recent individual polls in Pennsylvania actually have the state close for some of these candidates against Clinton, but the average isn’t there yet. It is showing movement though. So it is certainly possible we will see further polls confirm Pennsylvania getting closer. Pennsylvania is a big state (20 electoral votes). If Pennsylvania is in play, it opens up a lot more possibilities for the Republicans. So keep an eye on the polls here.
Note: This post is an update based on the data on my 2016 Electoral College Analysis Site. All of the charts and graphs seen here are from that site. Graphs, charts and raw data can be found there for the race nationally and in each state for every candidate combination that has been polled at the state level. In addition, comparisons of the best polled candidate combinations both nationally and each in each state are available. All charts above are clickable to go to the current version of the detail page the chart is from, which may contain more up to date information than the snapshots on this page, which were current as of the time of this post.
Today’s new poll from Gravis in North Carolina scrambles up the “five best polled candidate combinations” by the metric I use a bit, with Clinton vs Huckabee now the “best polled”, followed by Clinton vs Bush, Clinton vs Paul, Clinton vs Christie and Clinton vs Rubio. (This is basically because Clinton vs Huckabee is now very close in a state that has been very well polled.)
That’s just bookkeeping though, there was one status change of note:
Clinton vs Paul
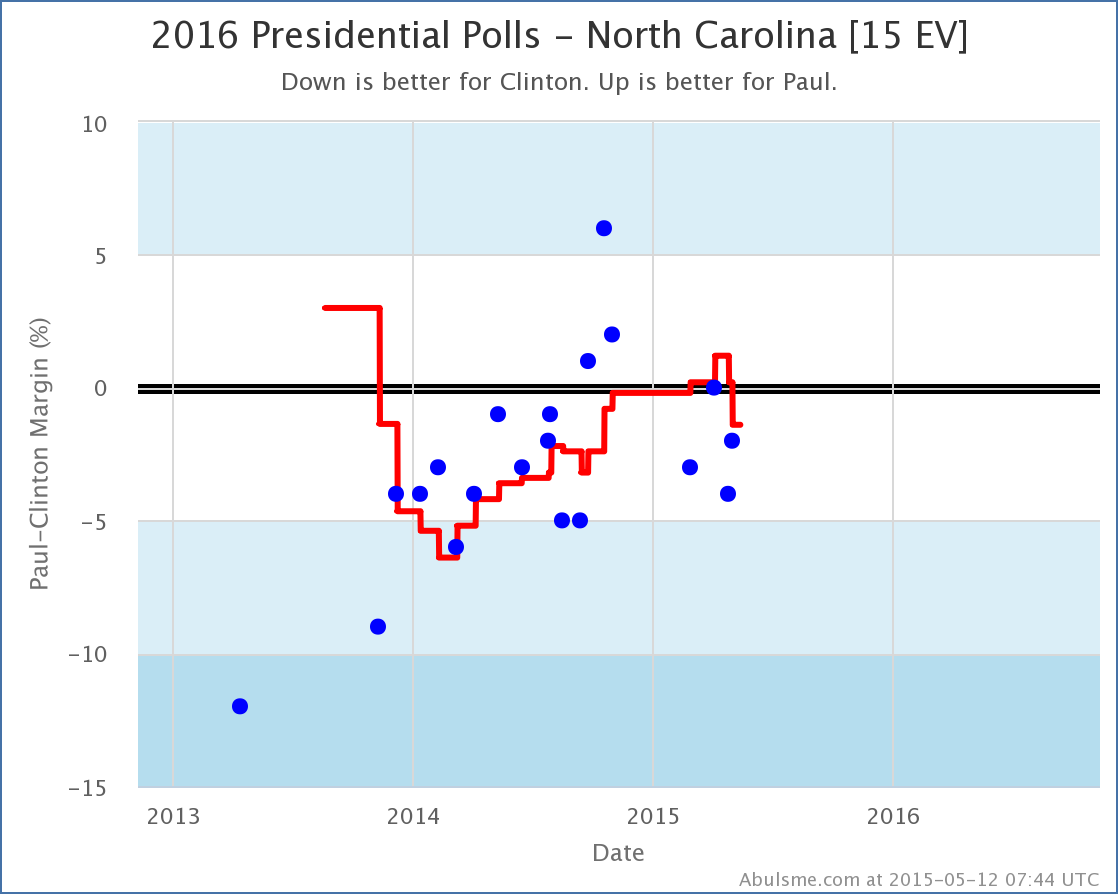
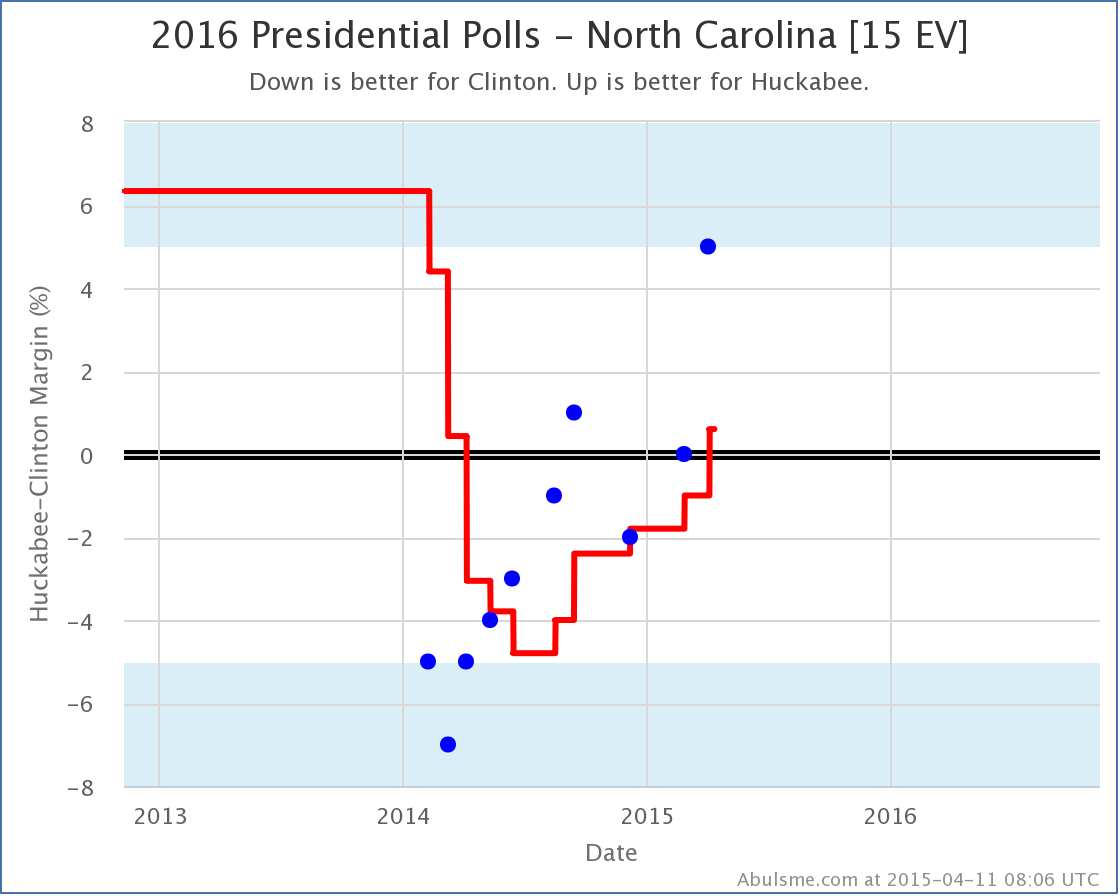
The newest poll in North Carolina bumps a poll from last October that had Paul ahead by 6% out of the poll average. With that poll gone, the average changes from Paul ahead by 0.2% to Clinton ahead by 1.4%. But the bottom line here is that all but one poll in the past year shows less than a 5% gap between Paul and Clinton. This is a close state. Yes, all but a few have shown Clinton ahead, so calling this “Weak Clinton” seems fair, even if you go beyond the last five polls. But it is close, and could flip back to Paul easily enough.
For now though, North Carolina returns to the Clinton side of the fence, and so the “Expected Case” moves 30 electoral votes toward Clinton:
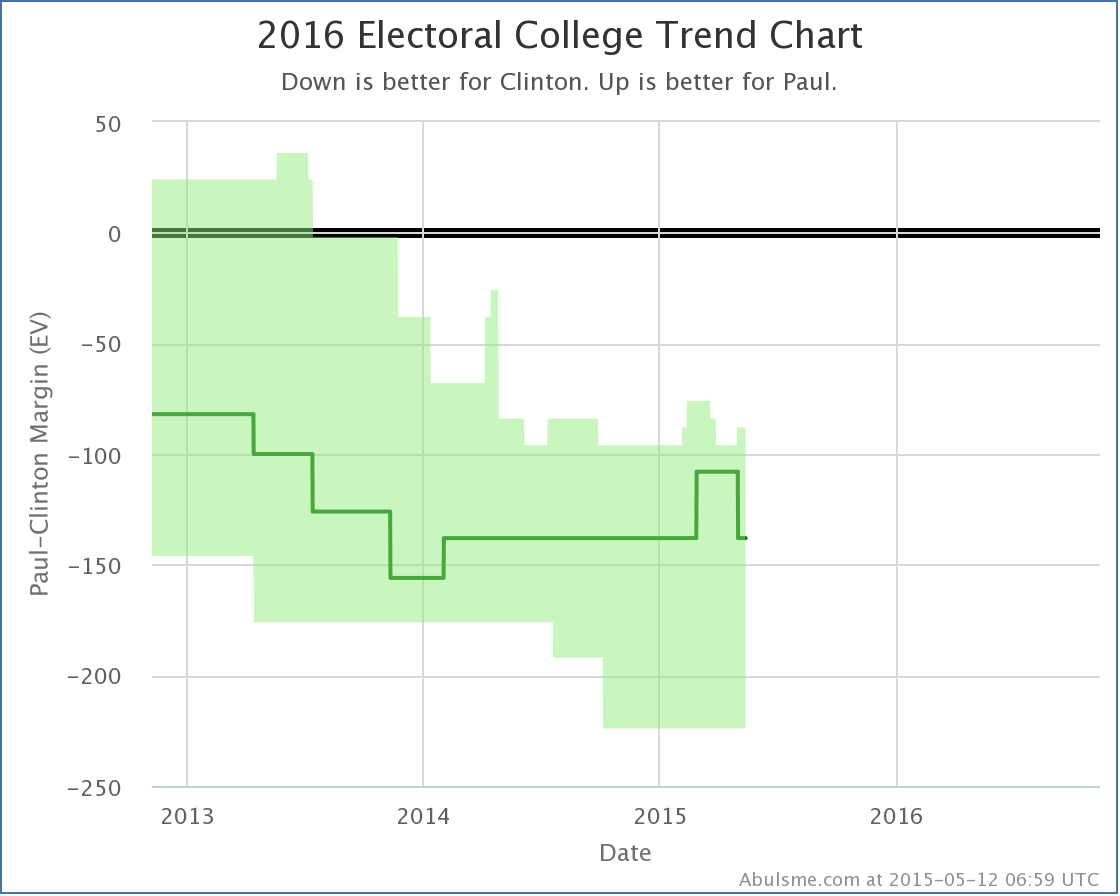
With this Paul is back to losing to Clinton by 138 electoral votes, which is where he has been for most of the last year.
Note: This post is an update based on the data on my 2016 Electoral College Analysis Site. All of the charts and graphs seen here are from that site. Graphs, charts and raw data can be found there for the race nationally and in each state for every candidate combination that has been polled at the state level. In addition, comparisons of the best polled candidate combinations both nationally and each in each state are available. All charts above are clickable to go to the current version of the detail page the chart is from, which may contain more up to date information than the snapshots on this page, which were current as of the time of this post.
Edit 15:20 UTC to fix a typo.
In the latest Curmudgeon’s Corner with Sam and IvГЎn:
* Election 2016
* Tesla House Battery
* Israeli Coalition
* Lightning Round
Recorded 2015-05-07
Length this week – 1:17:49
1-Click Subscribe in iTunes
View Podcast in iTunes
View Raw Podcast Feed
Download MP3 File
Follow the podcast on Facebook
Today there were tons of new polls added to my tracking site. The new polling once again put Clinton vs Paul as the “best polled” candidate pair combination, once again swapping places with Clinton vs Bush to be the default displayed on election2016.abulsme.com. But in the end there were only three status changes on the five candidate pairs with the best polling. Today all three of these changes favor Clinton.
Clinton vs Bush
A new Gravis poll in Iowa increases Clinton’s lead once again to over 5%:
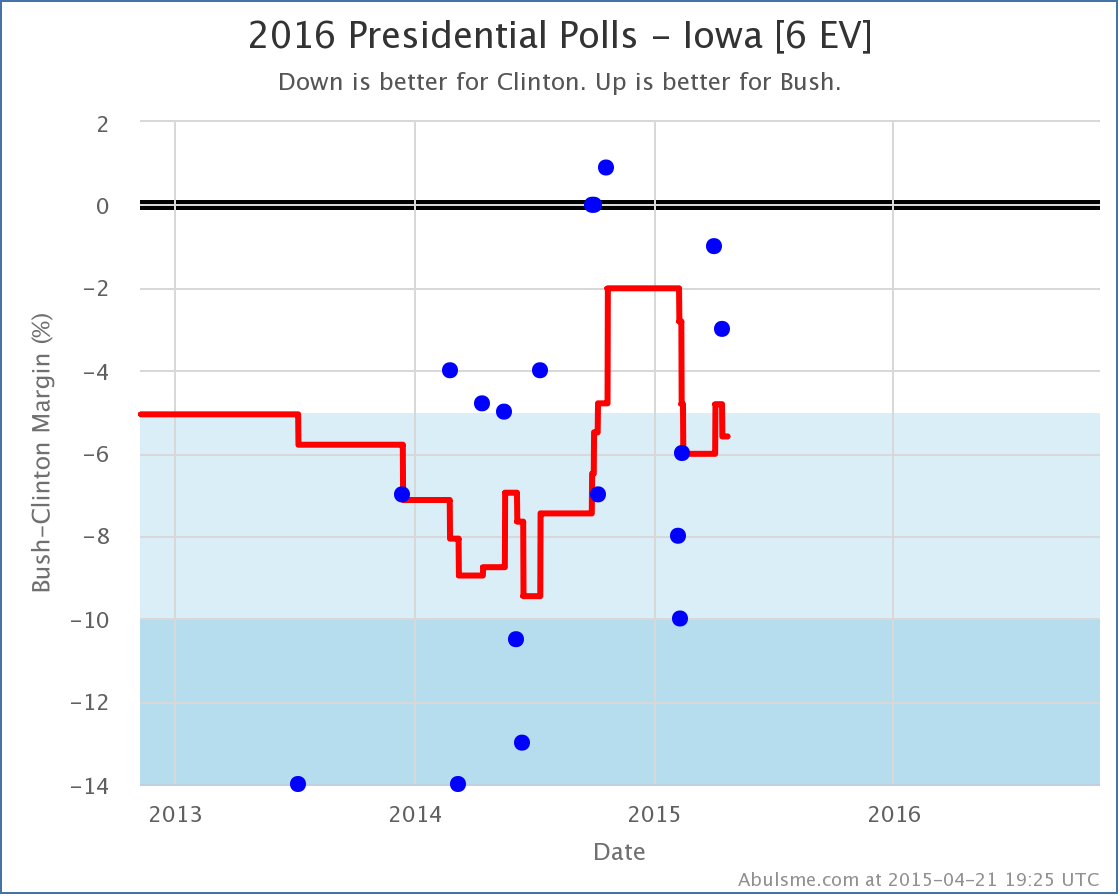
This in turn lowers Bush’s best case from losing to Clinton by 38 electoral votes, to losing by 50 electoral votes:
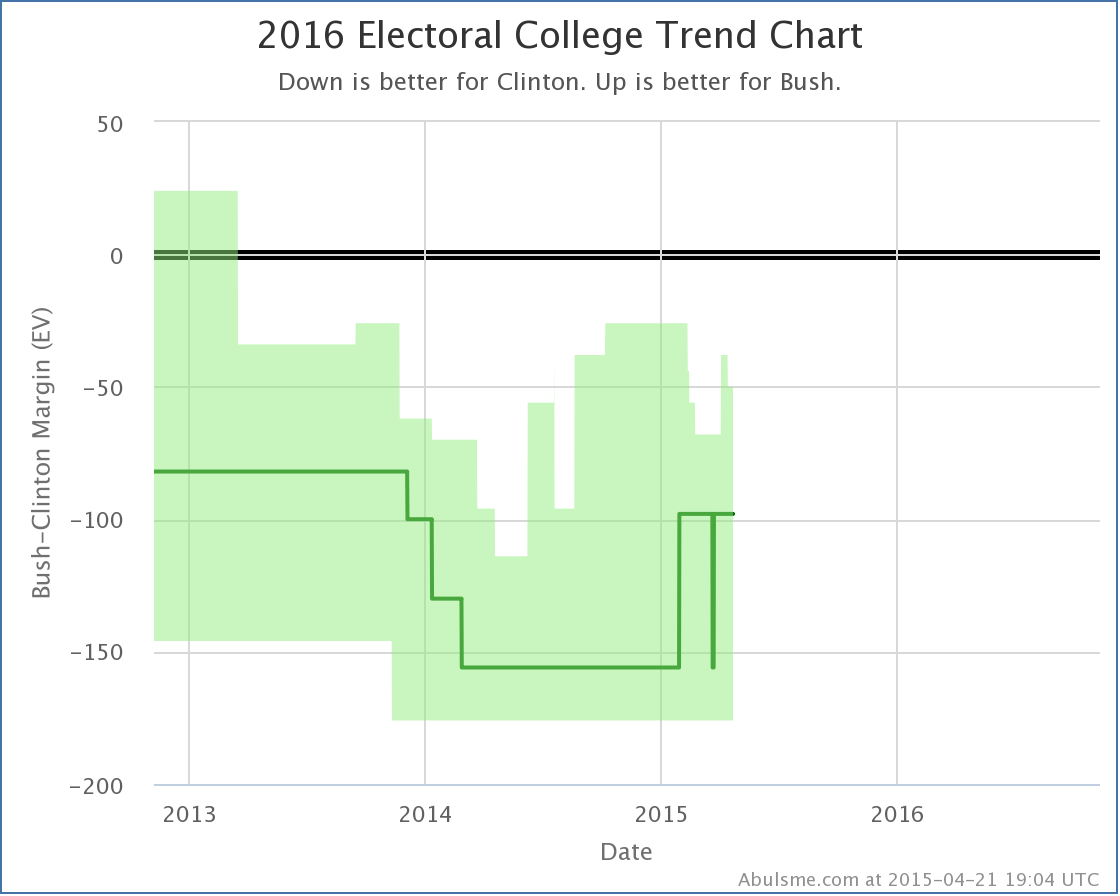
Iowa has been bouncing back and forth over the line between Weak Clinton and Strong Clinton though, so don’t be surprised for this to change again as new polling comes out.
Clinton vs Christie
A new PPP poll in New Hampshire shows Christie trailing Clinton by 15%. Before this poll, the worst Christie had done in New Hampshire against Clinton was being behind by 5%. So this certainly looks like a potential outlier:
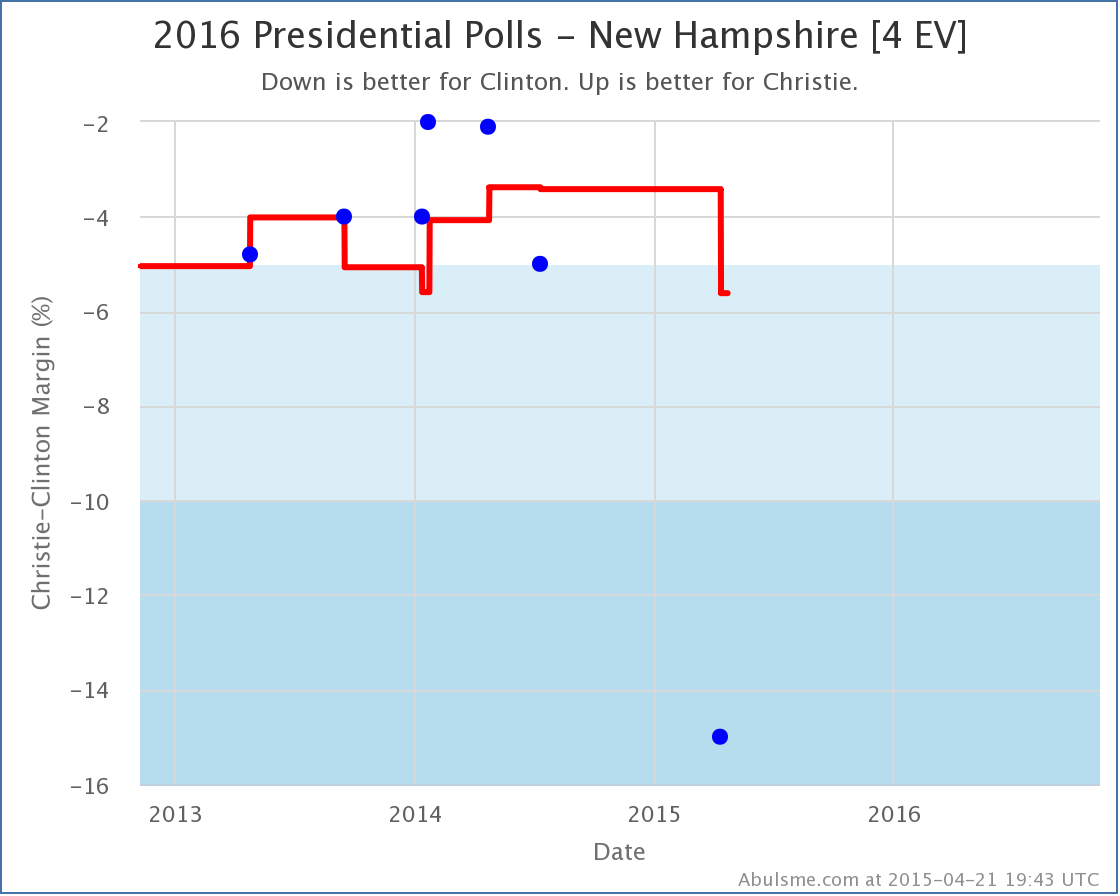
On the flip side, the last polling for Clinton vs Christie in New Hampshire was way back in July, and Christie has been slipping in almost every poll he appears in. So this may also be indicative of a real movement. As usual, the only way to confirm will be with additional polls.
For the moment, with the poll average showing a 5.6% Clinton lead, I remove New Hampshire from the “possible” list for Christie, which moves his best case from losing to Clinton by 100 electoral votes, to losing by 108 electoral votes:
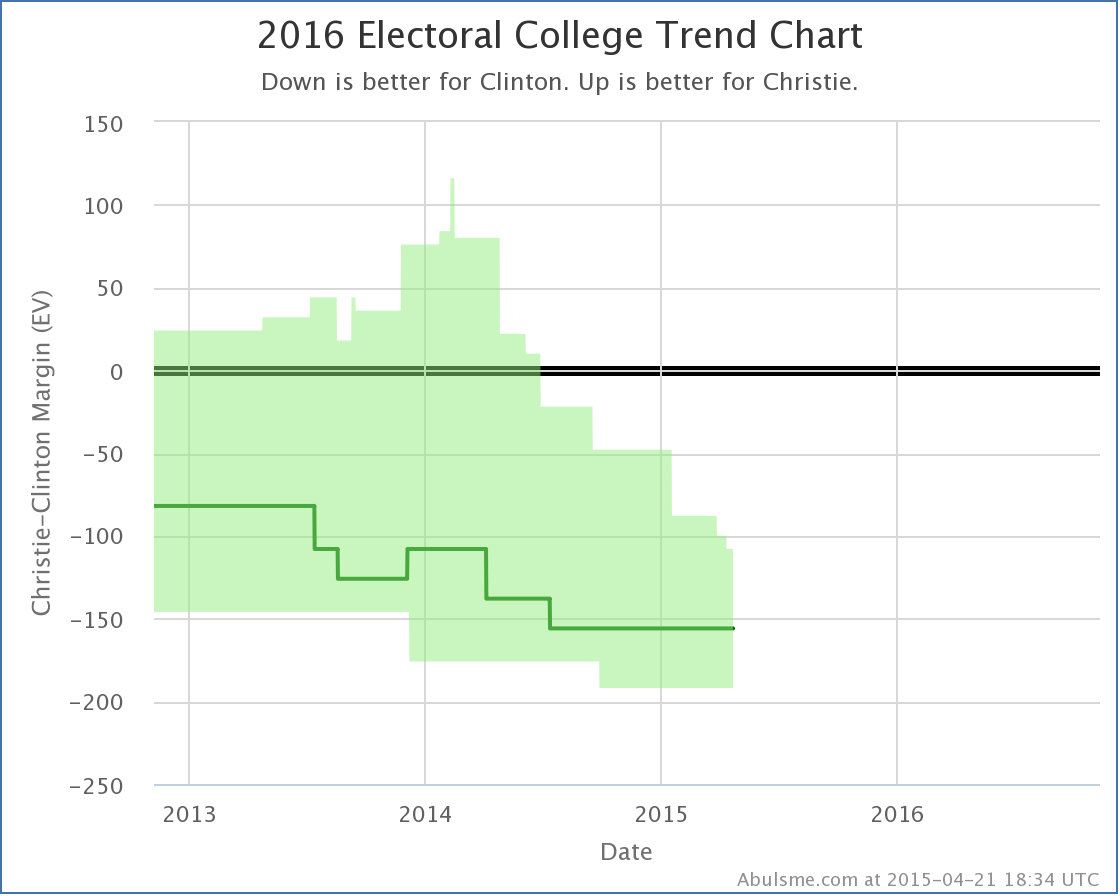
The last time Christie saw any state change categories in his direction vs Clinton was more than a year ago in February 2014. Christie’s general election prospects seem dimmer and dimmer as time goes on. Of course, although I won’t track the nomination races until there are actual delegates to count, if you look at polling for the Republican nomination, you’ll note that the trends look the same there, so Christie may not have to worry that much about his general election prospects.
Clinton vs Huckabee
The same PPP poll in New Hampshire mentioned above is only the second Clinton vs Huckabee poll conducted in New Hampshire, but it is enough to move the average to a greater than 5% Clinton lead:
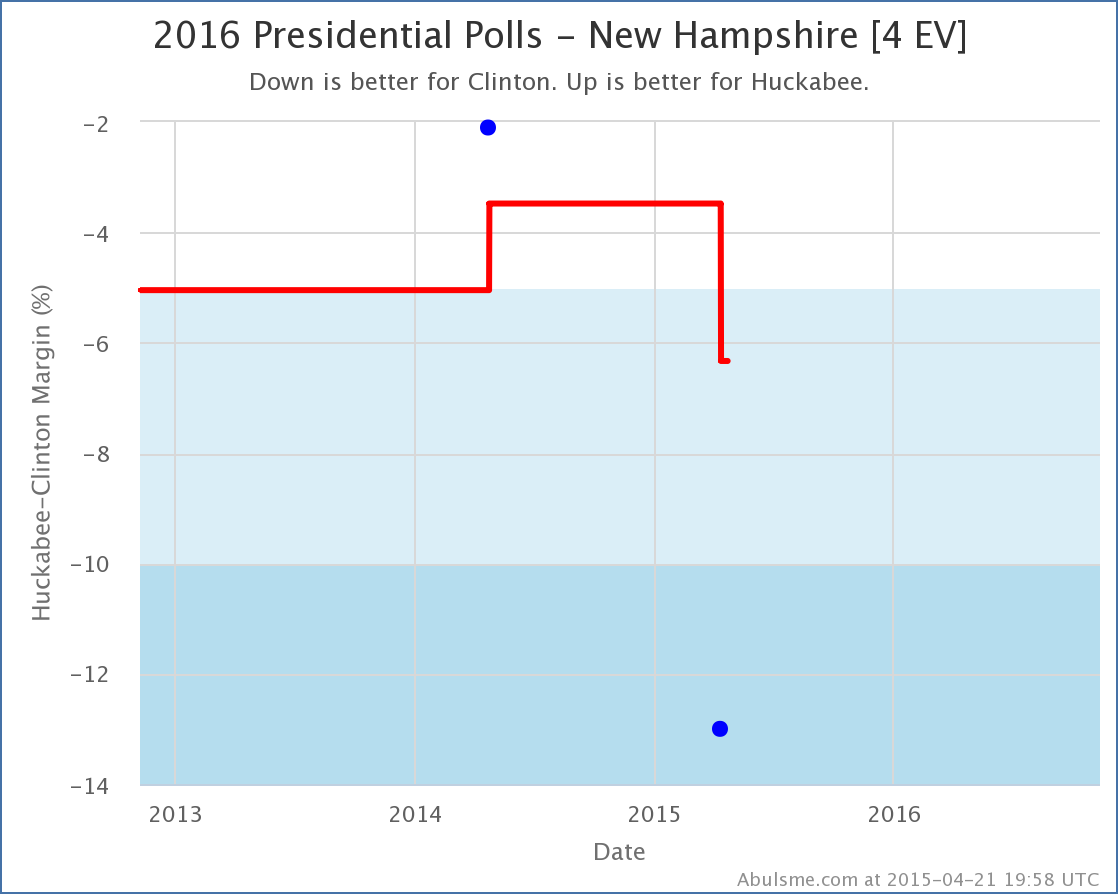
And this moves Huckabee’s best case against Clinton from losing by 76 electoral votes, to losing by 86 electoral votes:
Comparison
Looking at the “best case” of each of the five “best polled” challengers to Clinton over time:
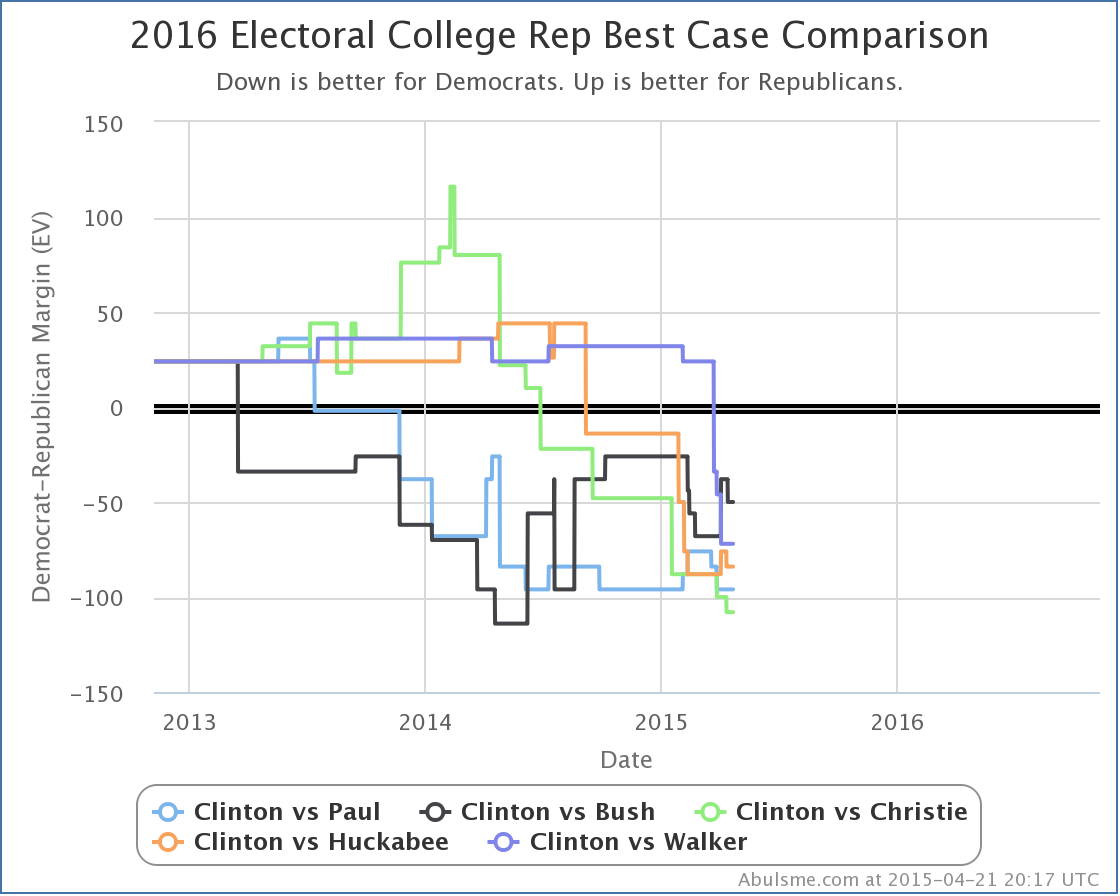
Since the 2014 elections, Paul is flat. Bush, Christie, Huckabee and Walker are all down. Which means that so far, NONE of these candidates have actually been expanding the list of states that are actually in contention. Now, some other metrics have shown some movement toward some of these candidates, but this is a critical one. The Republicans can’t win without first making more currently blue states close.
Clinton vs Ryan, Clinton vs Rubio, and Clinton vs Cruz are the #6, #7 and #8 best polled candidate combinations. They are way behind the five above in polling quality by my metric, but feel free to take a look if any of those candidates are of interest… just interpret the results with caution.
Note: This post is an update based on the data on my 2016 Electoral College Analysis Site. All of the charts and graphs seen here are from that site. Graphs, charts and raw data can be found there for the race nationally and in each state for every candidate combination that has been polled at the state level. In addition, comparisons of the best polled candidate combinations both nationally and each in each state are available. All charts above are clickable to go to the current version of the detail page the chart is from, which may contain more up to date information than the snapshots on this page, which were current as of the time of this post.
Today I added results from PPP’s latest polling of North Carolina to my database. They polled 11 different candidate combinations, but only one of these resulted in a significant change to one of the five best polled candidate combinations. So lets hit that quickly:
Clinton vs Huckabee
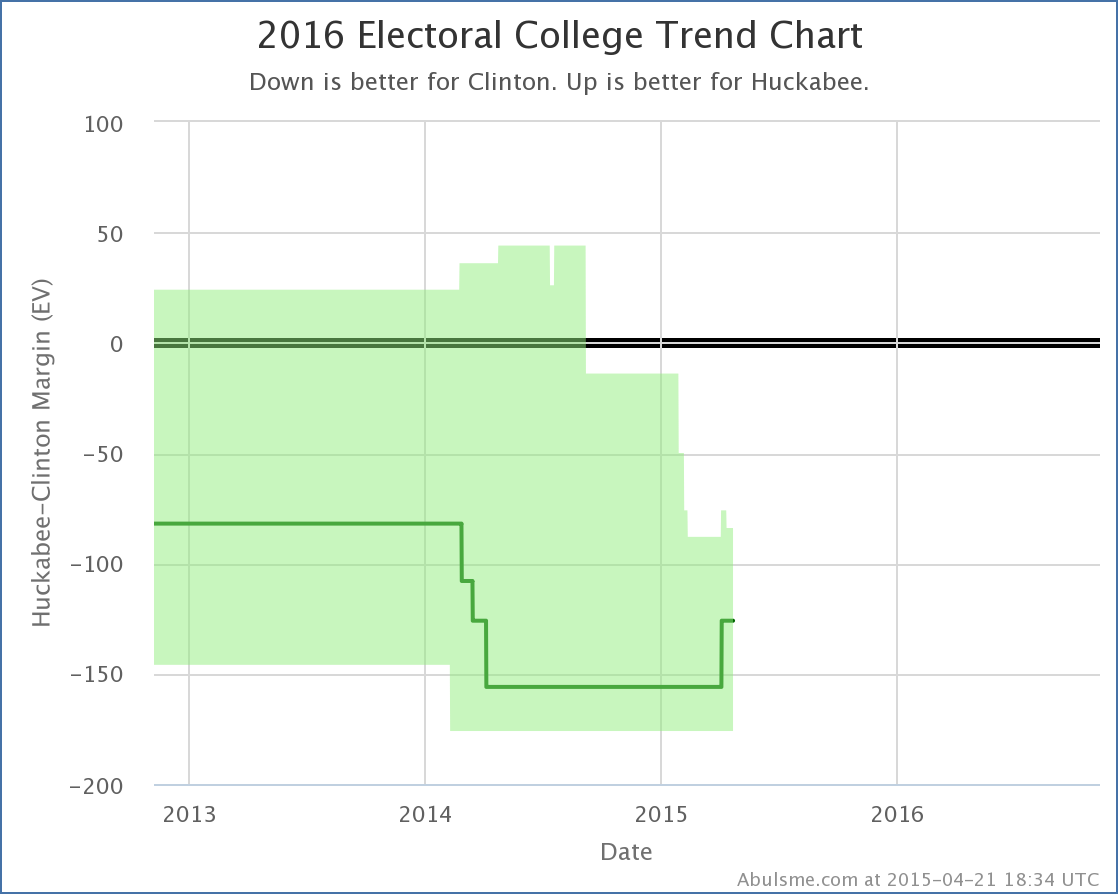
Yup, that newest poll may or may not prove to be an outlier, but that looks like a real trend, with Huckabee gaining a lot of ground vs Clinton over the last year, and now Huckabee takes the lead, just barely. This changes Huckabee’s expected result vs Clinton:
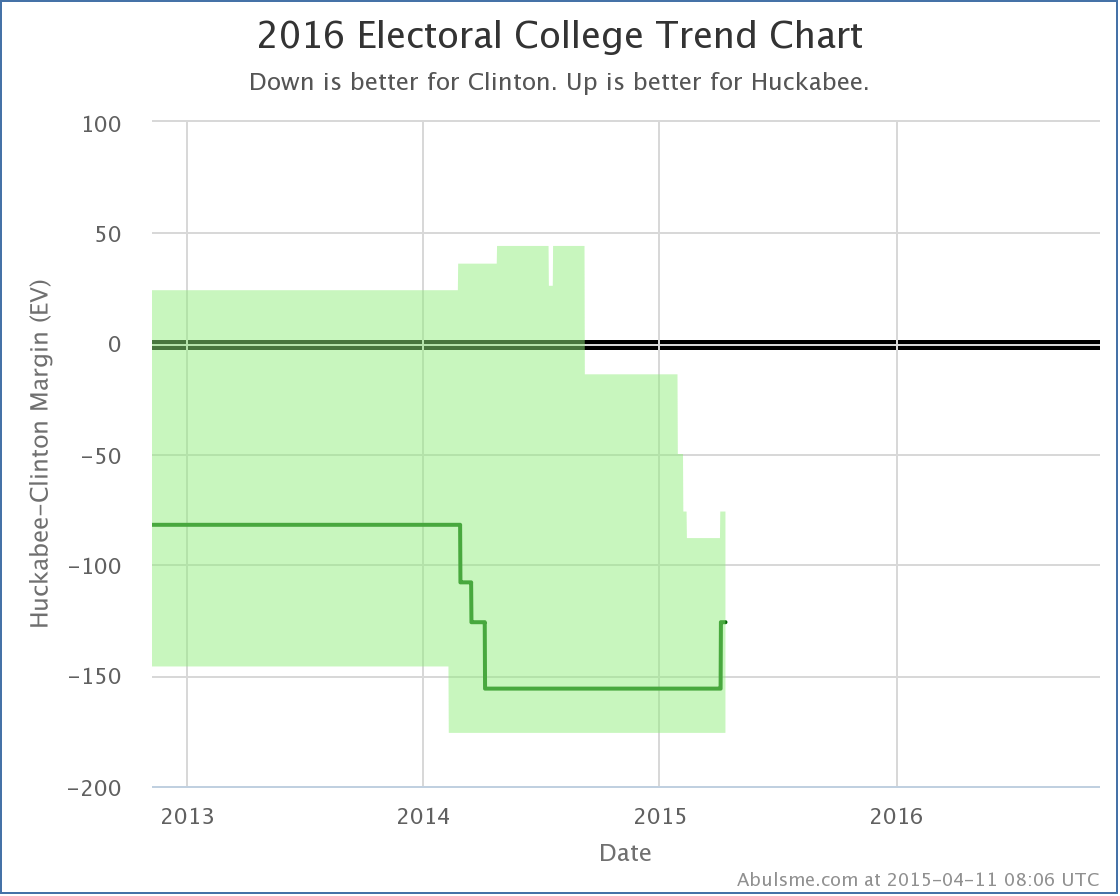
Huckabee’s “expected” result where he wins all of the states he is ahead in is now to lose to Clinton by 332 to 206… losing by 126 electoral votes… which is exactly the same as Romney’s loss to Obama. Right now, looking at the five best polled candidate combinations, Bush and Paul both do better than this, with Bush losing by 98 electoral votes and Paul losing by 108. Christie on the other hand does worse, losing by 156. But what about the 5th candidate combination? This brings up the other big news of the day, namely, the debut of Clinton vs Walker in my “Top 5”.
Clinton vs Walker
The new batch of polling added today causes a big improvement for Clinton vs Walker in my metric to measure polling quality. There is plenty to quibble with on how I construct this metric, namely that it might be overly sensitive to the situation in states that are VERY close in the poll averages, and I second guess it myself all the time, but it is “good enough” for these purposes. With today’s update, Clinton vs Walker jumps past Clinton vs Cruz, Clinton vs Rubio and Clinton vs Ryan to take the #5 spot in my top five ranking.
Looking at the historical trend charts for Clinton vs Walker wouldn’t really tell us too much. At this point those don’t really show real “trends” they just show the process of slowly getting enough polling to show where Clinton vs Walker really is, rather than having the map based mostly on the average of the 1996-2012 elections. So instead lets just look at a snapshot of NOW:
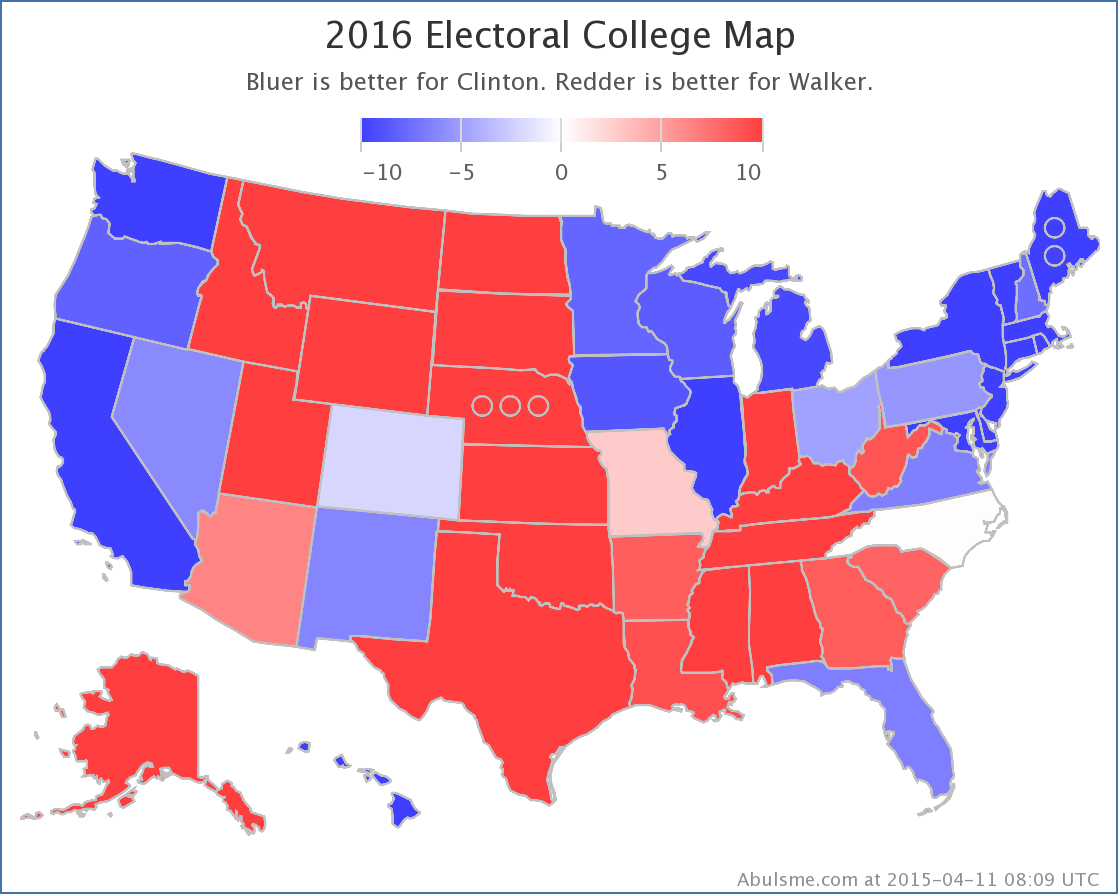  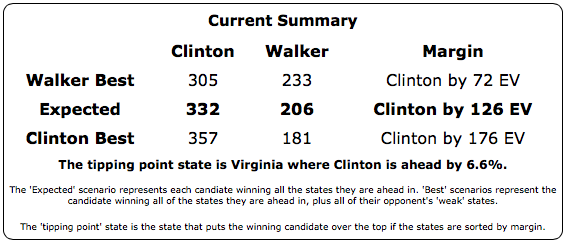
So where does Walker start out? 332-206. Matching the Obama vs Romney result. Matching Huckabee. Not doing as well as Bush or Paul, but not as badly as Christie. At least in terms of the “Expected” result.
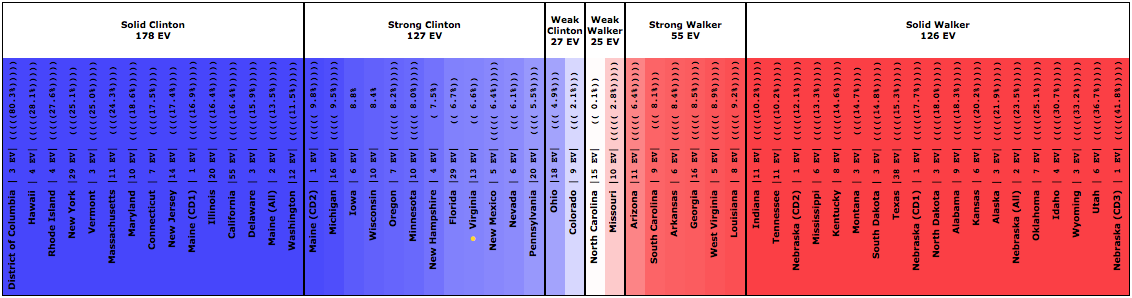
Now, even though Walker makes it on to the Top 5 best polled list, that doesn’t mean polling is super robust. Only two states (Iowa and Wisconsin) actually have more than the five polls I usually use in my averages, and they aren’t even close states. (Hillary is ahead by over 8% in both.) Every other state is still relying to some degree on the results in the 1996-2012 elections to provide a baseline in the absence of actual Clinton vs Walker polls. Sixteen states have at least one Clinton vs Walker poll though, and a good number of those have several polls at this point, so we have enough to start paying attention.
On Walker’s map right now there are only four “close” states: Ohio, Colorado, North Carolina and Missouri. The current “shortest path” to a Walker win is for him to win those four states, plus pull Pennsylvania, Nevada, New Mexico and Virginia over from the “Strong Clinton” category, first into contention as a close state, and then over to his side. The tipping point is Virginia, where Clinton’s lead is currently 6.6%.
6.6% seems like a pretty big lead. But the events of a long campaign can and do erase leads like that. Remember the crucial point that this far out polls are NOT predictive of the final result, instead, they essentially just show how much work the losing candidate needs to do (or how much the leading candidate needs to screw up) in order to flip the result. Another way of looking at a 6.6% lead is that 3.3% of people need to change their minds. Or the undecided need to break strongly in favor of the challenger. (My model just looks at the margin between the polling of the two candidates, and doesn’t take into account the size of the undecided pool at all.) In that context, 3.3% doesn’t seem quite as formidable.
Clinton has a strong lead here. Catching up and winning will take some hard work or good luck for Walker. But it is certainly possible. 577 days is a long time.
Note: This post is an update based on the data on my 2016 Electoral College Analysis Site. All of the charts and graphs seen here are from that site. Graphs, charts and raw data can be found there for the race nationally and in each state for every candidate combination that has been polled at the state level. In addition, comparisons of the best polled candidate combinations both nationally and each in each state are available. All charts above are clickable to go to the current version of the detail page the chart is from, which may contain more up to date information than the snapshots on this page, which were current as of the time of this post.
Today’s big poll dump was from Quinnipiac, in the latest of their “Swing State Poll” series. This edition features polls from Colorado, Iowa and Virginia and is given the headline “Paul Blooms As Clinton Wilts“. That sounds pretty strong. But lets see how that headline holds up when we look at today’s updates in the context of poll averages rather than just results from one pollster, and looking beyond just the individual states with my method of classifying states.
Quinnipiac tested seven candidate combinations, but only four of those are in the “five best polled candidate combinations” by the measure I use here, so those are the ones I will talk about today. That would be Clinton vs Bush, Paul, Christie and Huckabee. (The fifth combo on the top five, Clinton vs Ryan, hasn’t been polled by anyone since February, but Cruz, Rubio and Walker, the next three by my metric, and also the others polled by Quinnipiac, still haven’t had enough polling to catch up and pass Ryan.)
So of those four, what were the actual changes in my models? There were changes for three candidate pairs. In all three cases the changes favored the Republican.
Clinton vs Bush
With today’s update, Clinton vs Bush once again becomes the “best polled” candidate combination by my metric, taking the spot from Bush vs Paul and thus becoming the default view on election2016.abulsme.com.
More importantly though, with today’s updates Clinton’s lead in the polling averages in both Colorado and Iowa dropped below 5%, putting those states back into play as “close states” that we consider possible for Bush to win. With these two back in play, Bush’s best case improves from Clinton 303 to Bush 235 before the update, to Clinton 288 to Bush 250 now, a loss by only 38 electoral votes. You can see the uptick in the top right part of the “bubble” representing the reasonable range of outcomes for Bush against Clinton given current polling:

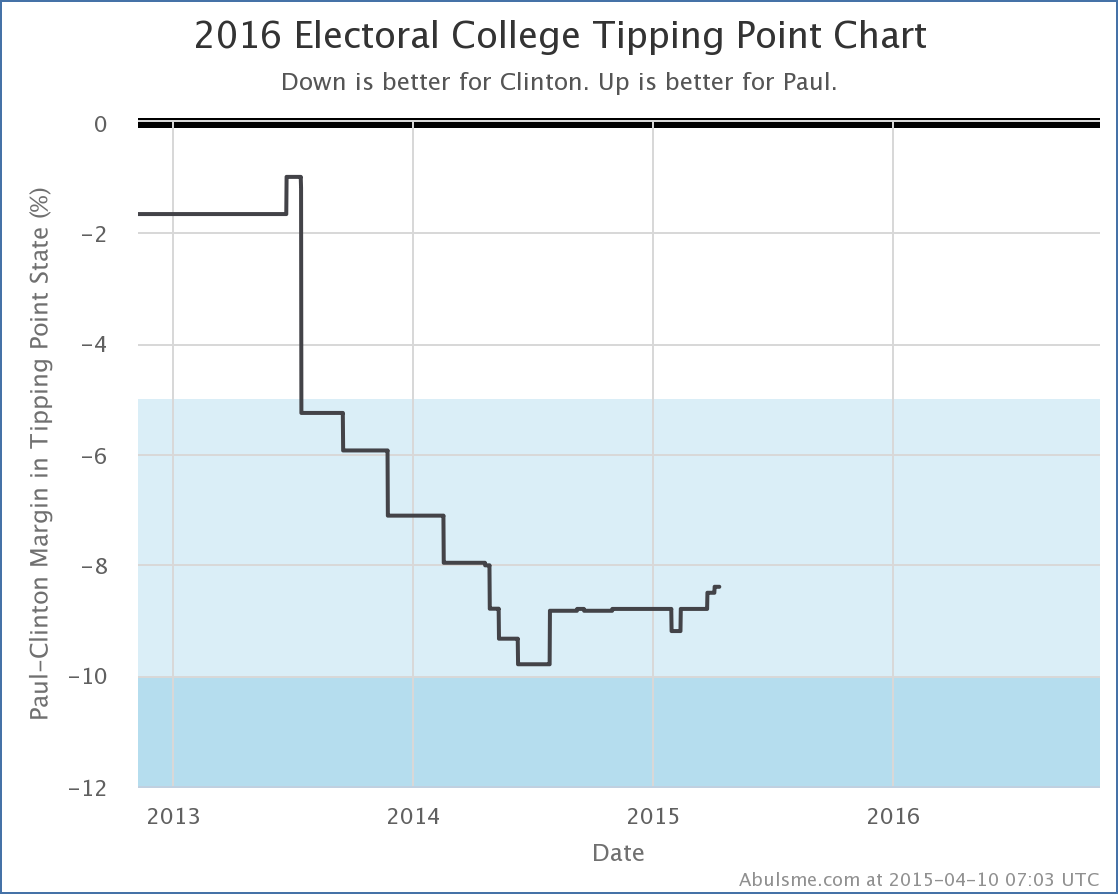
Clinton vs Paul
No states changed categories for Paul, despite the headline about Paul “blooming”. His average in Virginia however did improve from losing by 8.8% to only losing by 8.4%. This in turn moved his “tipping point margin”, a measure of how much polls need to move nationally to flip the electoral college, from being behind by 8.5% (with Wisconsin being the tipping point state) to being behind by 8.4% (with Virginia as the new tipping point state). This is the third tipping point change in a row in Paul’s direction. Almost starting to look like a trend.
Clinton vs Huckabee
With the new results from Quinnipiac, Clinton’s lead against Huckabee in Iowa falls from 6.6% to 4.6%. That’s a rather big drop, and it makes Iowa once again a “possible” for Huckabee. So his best case moves from losing by 88 electoral votes, to only losing by 76 electoral vote. You can see this at the top right of his “bubble”:

State Comparisons
Now, while Clinton does weaken in each of the three cases above, none of this really seems to justify the “Paul Blooms as Clinton Wilts” headline on the national level. But of course these polls weren’t at the national level. The headline was really specifically about the three states polled. So lets look at how each of the candidate pairs in question are doing in these three states specifically. In each one, just look at the very last change in the lines to see how this new poll result affected the averages. (All the charts in this section also include Clinton vs Ryan, but that line can be safely ignored, since Ryan wasn’t included in these polls.)
So, in order of the number of electoral votes:
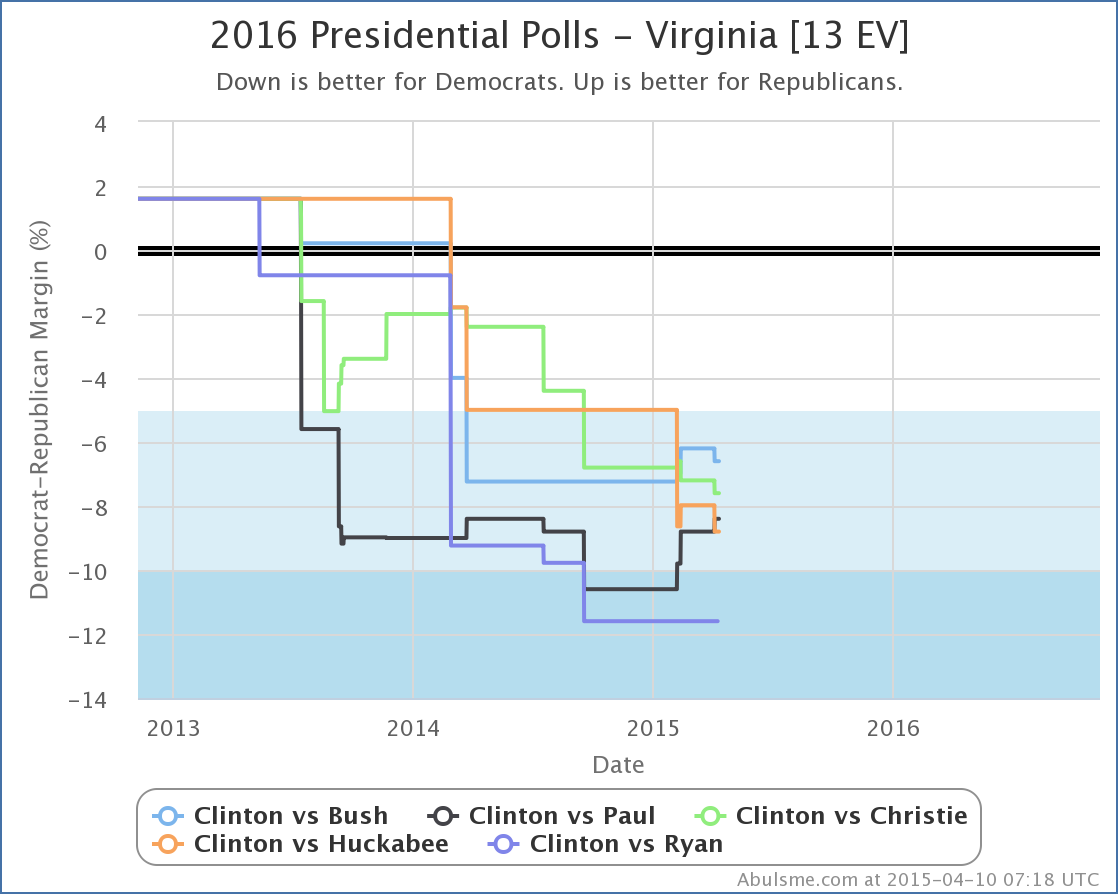
Bush, Christie and Huckabee actually fell further behind in Virginia as a result of this new polling. Paul was the only one of the four who actually improved in Virginia, reducing his deficit from 8.8% to 8.4% in my average. None of the four candidates made a move that changed the category though. Virginia is “Strong Clinton” against all four of these candidates, and this polling didn’t change that. Paul does stand out here though, by being the only one improving against Clinton.
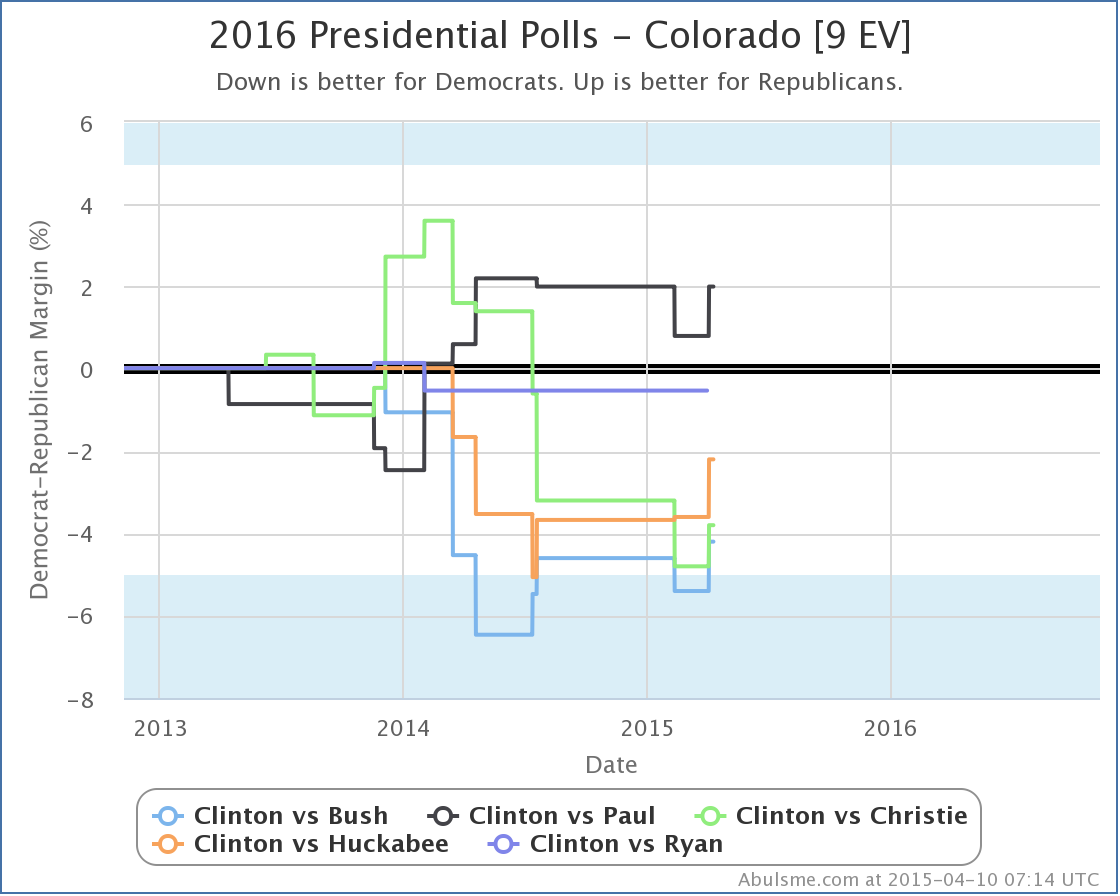
In Colorado all four of the candidates improve against Clinton as a result of the Quinnipiac poll. Bush actually moves into the white zone here, which as was mentioned earlier, means that the state is now a possible win for him. But this actually just brings Bush back in line with the rest of the pack. Colorado is a close state for all of these candidates.
Paul stands out in Colorado too, but not for the recent movement, but because he is the only one of these candidates who is showing that he could turn Colorado red again. (Colorado went blue for Obama in both 2012 and 2008, but was red in 2004, 2000 and 1996.) This is not new though. Paul has been consistently leading in the Colorado poll average against Clinton for over a year.
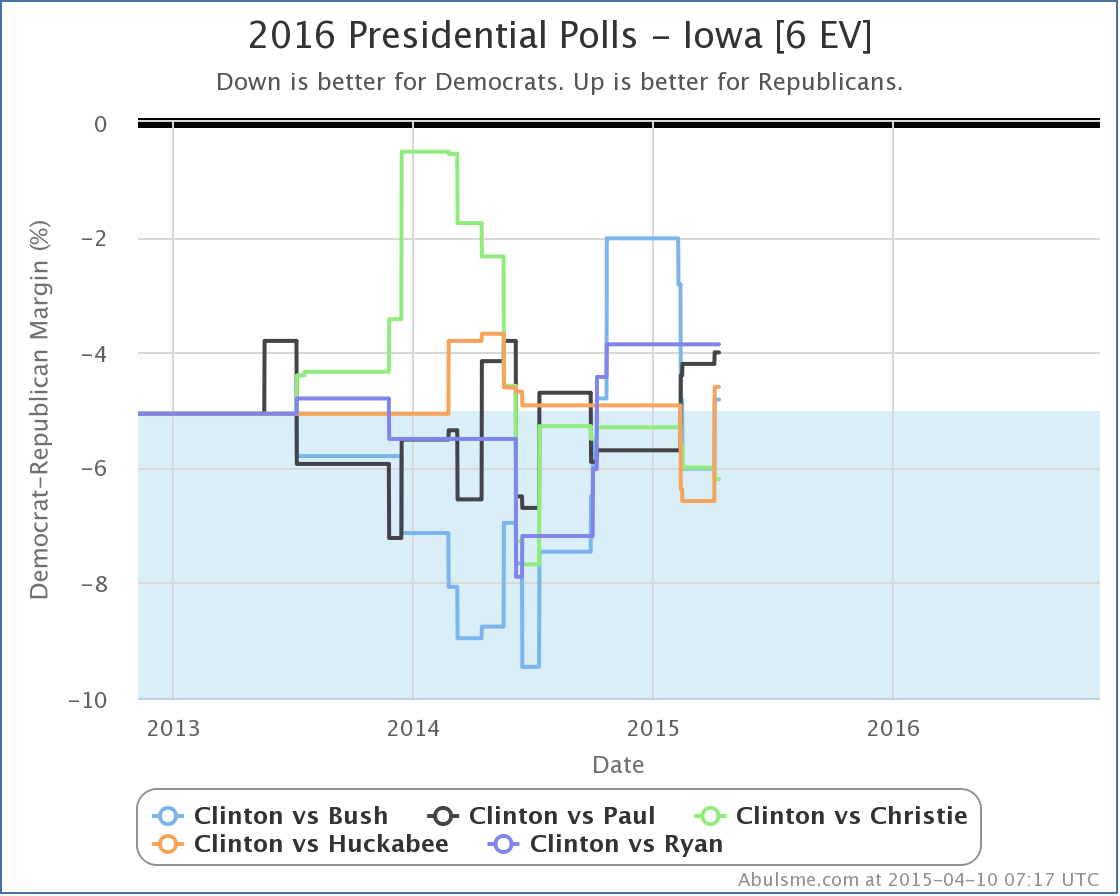
Bush, Paul and Huckabee all improved in Iowa, with Bush and Huckabee of course moving Iowa back into competitive territory, where Paul already was. Christie fell a bit further behind.
With all of the above, the moves were definitely not friendly to Clinton on the whole, but “wilting” looks like hyperbole. And while Paul does well here, so do Bush and Huckabee, arguably with moves just as significant as Paul’s if not more so.
So where does Quinnipiac get their headline?
Well, duh, they are only looking at their own polls. They are comparing their most recent results in these three states with the results of the last time they polled these three states back in February. I’m sure if you look at things with only that lens, it looks like exactly what they say it does. But you are ignoring a lot of data if you do that.
For instance, looking at only Quinnipiac data in Iowa, you see a move from Clinton having an 8.0% lead in February, to Paul being ahead by 1% now. Huge move, right? Massive momentum away from Clinton and toward Paul, right?
Lets look at the chart showing all the Clinton vs Paul polls in Iowa, not just Quinnipiac:
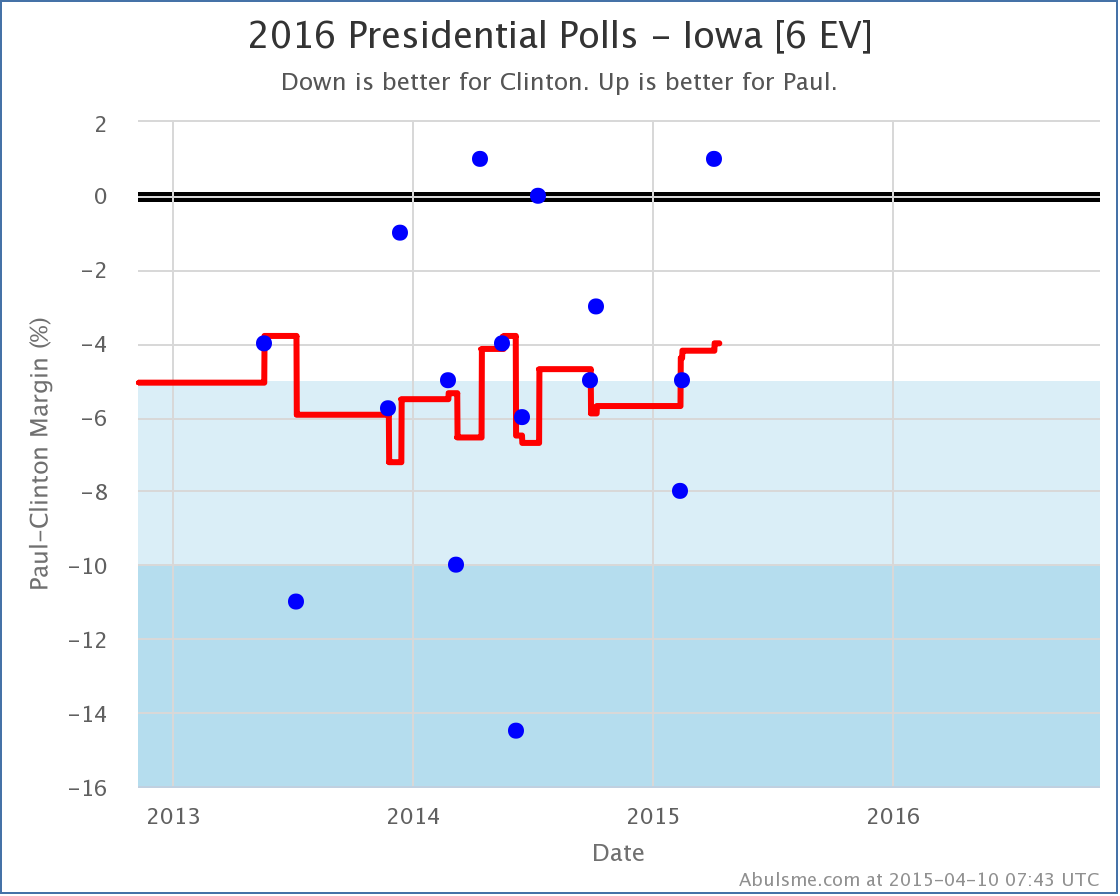
Hmmm… where did the trend go? Now, there have only been three polls so far in 2015, and it is true that each one has been better for Paul than the one before. But looking at the history of polling Clinton vs Paul in Iowa since the 2012 election, you see that the results are all over the place. There is huge scatter here. The results bounce all over the place. And so far, there has not been any sort of clear trend at all.
Yes, the new Quinnipiac poll looks great for Paul. He’s beating Clinton in Iowa! But there was a poll about a year ago that said that too. It wasn’t backed up by other polls though and wasn’t the sign of a big trend toward Paul. It was just more random variation. It wasn’t real.
Could this new poll be the first signs of a real long term movement? Maybe. Maybe not.
Kids, this is why we look at poll averages instead of individual polls.
If there is an actual big movement toward Paul, or any of the other Republican candidates, we’ll know soon enough as more and more polls start showing that movement. But no such clear trend is visible yet for any of the candidates with the most polling.
(I mentioned at the top that right now Clinton vs Cruz is the 6th best polled combo, Clinton vs Rubio is at #7, and Clinton vs Walker is at #8. You can click through on those links if you want to see what those look like at the moment. The amount of state level polling still isn’t great on those guys, so interpret the charts carefully.)
Note: This post is an update based on the data on my 2016 Electoral College Analysis Site. All of the charts and graphs seen here are from that site. Graphs, charts and raw data can be found there for the race nationally and in each state for every candidate combination that has been polled at the state level. In addition, comparisons of the best polled candidate combinations both nationally and each in each state are available. All charts above are clickable to go to the current version of the detail page the chart is from, which may contain more up to date information than the snapshots on this page, which were current as of the time of this post.
|
|