Election Graphs will be rolling out our primary delegate race coverage before the Iowa caucuses, but in the mean time, we’ve just had the first state level general election polls of the New Year. It is a PPP poll in New Hampshire. There was only one candidate pair where the new polls changed my classification of New Hampshire though.
Clinton vs Bush
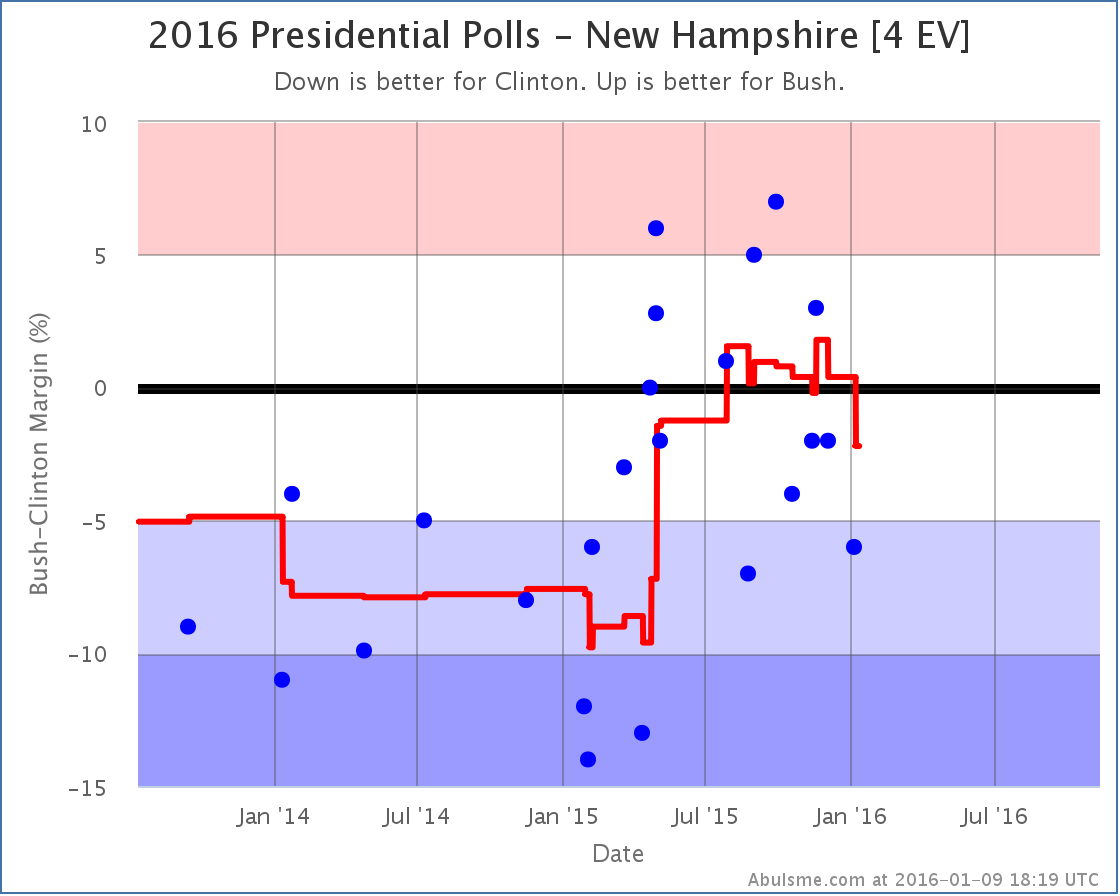
For all but a few days in November, Bush had held a lead against Clinton in my poll averages since the end of July. Just barely. But he had hung onto that lead. With the latest poll though, Clinton leads in four of the last five polls, and by enough to take a lead in the average. New Hampshire moves from “Weak Bush” to “Weak Clinton”. The lead is still slim at 2.2%, so the state is still very much in the “could easily go either way” category, but it is enough to put New Hampshire back in Clinton’s column in the case where we give each state to the current leader.
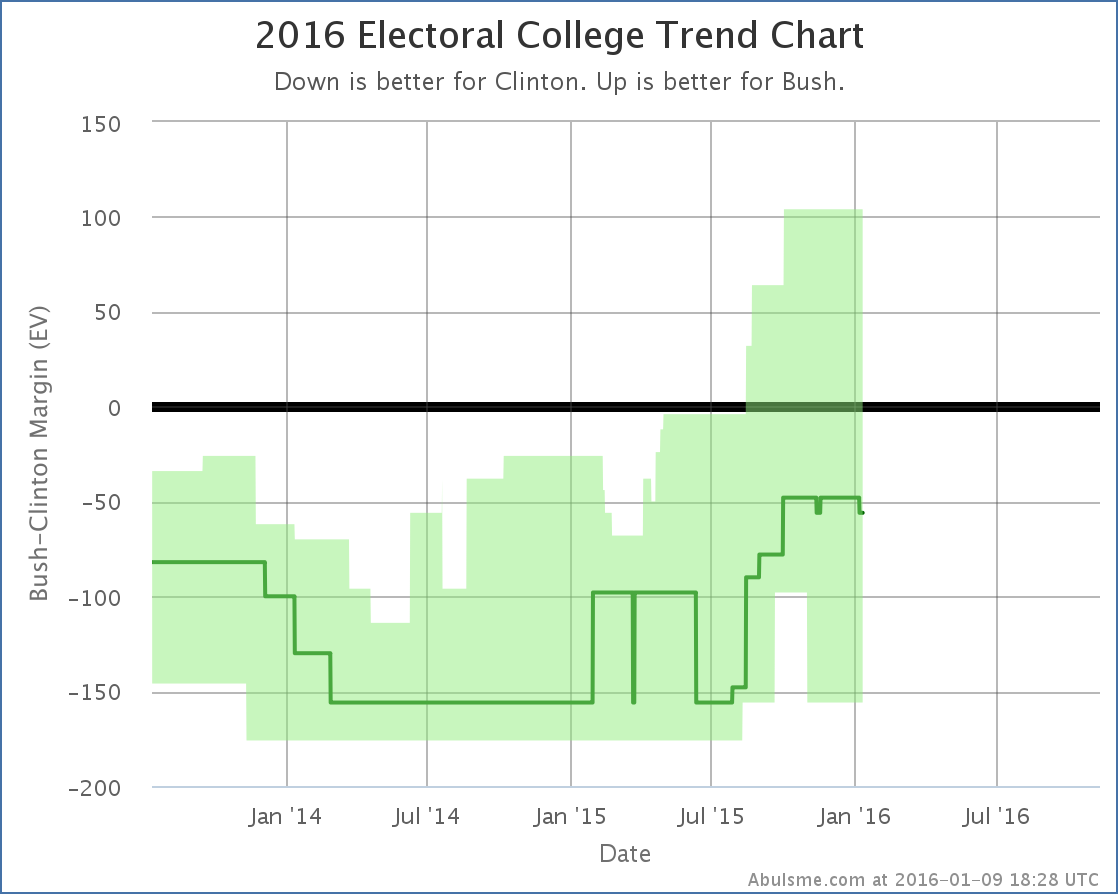
That little notch downward on the center line at the right hand side of the bubble is New Hampshire flipping to Clinton. We go from Clinton winning by 48 electoral votes, to Clinton winning by 56 electoral votes. Either way, Clinton is ahead, but the election is within the “bubble of uncertainty” since if you give Bush all the states where Clinton is ahead, but by less than 5%, Bush wins by 104 electoral votes.
A Clinton vs Bush matchup could go either way.
But, if the primary polls are to be believed, at this point Clinton vs Bush is a relatively unlikely scenario, so even though there were no other category changes, lets take a quick look at how the latest polls affected some of the other matchups.
New Hampshire Matchup Comparison
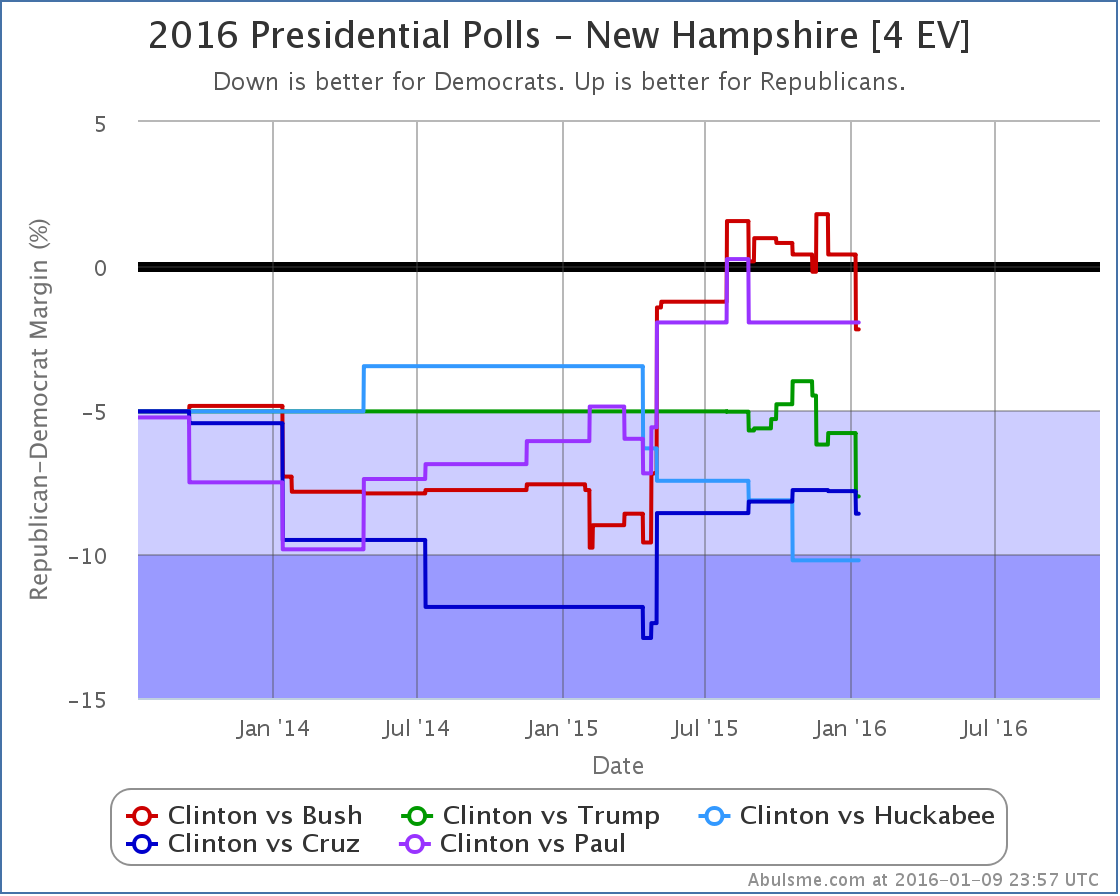
Looking at the five best polled candidate combinations nationally, the latest New Hampshire poll included three of the five (Bush, Trump and Cruz). In all three cases, the Republican weakened vs Clinton.
For Trump and Cruz though, this just meant Clinton’s already strong lead in New Hampshire got stronger. It makes no difference what so ever to their possible races against Clinton if they were to win the nomination.
Aside from Bush, the only one of these five that makes New Hampshire close is Paul, but that should be taken with a big grain of salt because he hasn’t been included in a general election match up poll in New Hampshire since August. So that data is a bit stale.
Looking beyond the top five though, to what is currently the sixth best polled combination by my metric, you actually see another candidate that makes New Hampshire close with Clinton, and in fact in that case the latest polls actually improved the Republican’s average. That would be Clinton vs Rubio:
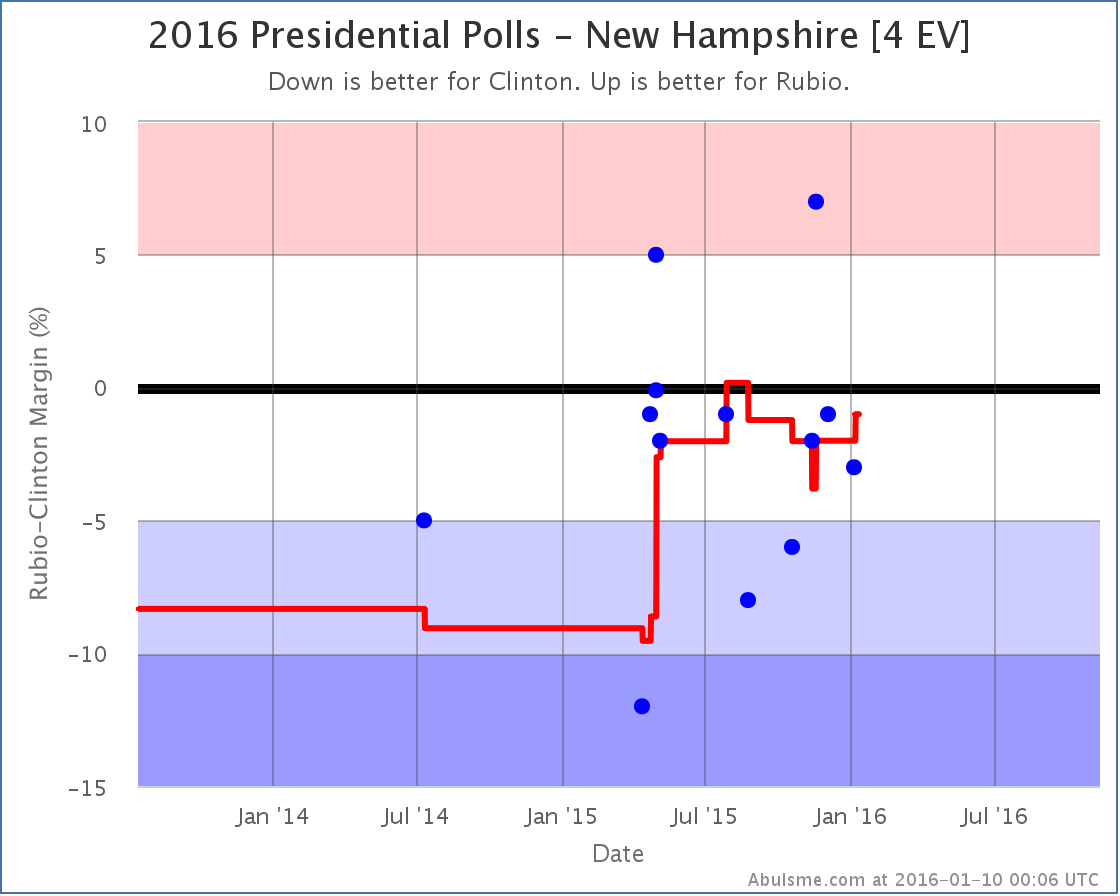
Of the 10 candidate pairs included in the latest polls… Clinton and Sanders vs Bush, Carson, Cruz, Rubio and Trump… Clinton vs Rubio is the only combination where the Republican’s poll average improved.
Does this imply larger things for the country at large? No, not really. New Hampshire is a special case in many ways. It is getting a huge amount of attention right now due to the upcoming primary. What is going on there right now in terms of public opinion may or may not be reflected in trends elsewhere.
So, as usual, we need to just wait for more polls. Which states get polled in the next few months is probably going to be highly influenced by the primary calendar as well, so the picture we see in the state polls will be warped a bit by that.
And of course once we have actual delegate numbers in both parties showing which candidates are actually leading in the nomination races, it starts changing perceptions of the general election, which may in turn cause more movement in the state polls.
Keep checking in with Election Graphs. We’ll be launching our delegate tracking soon, and it looks like the kind of election cycle where watching the delegate situation carefully may actually be needed.
In other words, we’re almost at Iowa, and things are going to get crazy. Hold on and have fun!
304.0 days until the general election polls start to close.
Note: This post is an update based on the data on ElectionGraphs.com. All of the charts and graphs seen here are from that site. Graphs, charts and raw data can be found there for the race nationally and in each state for every candidate combination that has been polled at the state level. In addition, comparisons of the best polled candidate combinations both nationally and each in each state are available. All charts above are clickable to go to the current version of the detail page the chart is from, which may contain more up to date information than the snapshots on this page, which were current as of the time of this post. Follow @ElecCollPolls on Twitter for specific poll details as I add them. And like Election Graphs on Facebook!