States with new poll data added since the last update: Florida, Pennsylvania, Wisconsin, Ohio, Alaska
Notable changes in: Alaska
National Summary
Only one change this time, but it it continues to be movement toward Clinton. The most recent polls included here now ended Friday, but it is unclear how much, if any, they were impacted by the 2005 Trump tape, since that happened later in the day on Friday.
- Clinton best case moves from a 196 electoral vote win to a 202 electoral vote win
The chart:
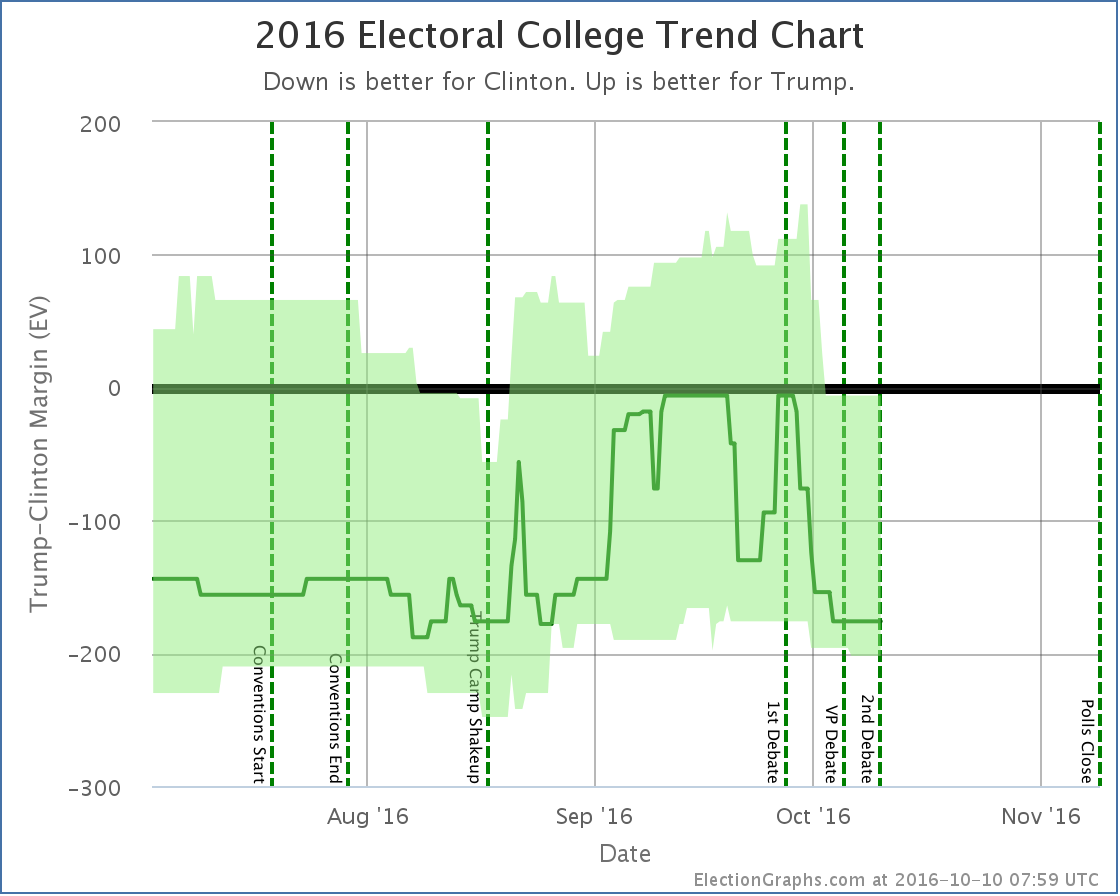
Clinton’s best case has been improving slowly since mid-September. She has a bit to go before she matches her peak in August, but if the current trends continue, we may see that again within a week or so as the impacts from the 2005 Trump tape and the second debate start to be visible in the state polls.
9.3 days until the next debate. 29.3 days until we start getting actual election results. We are in the final stretch.
State Details
Moving into play for Clinton
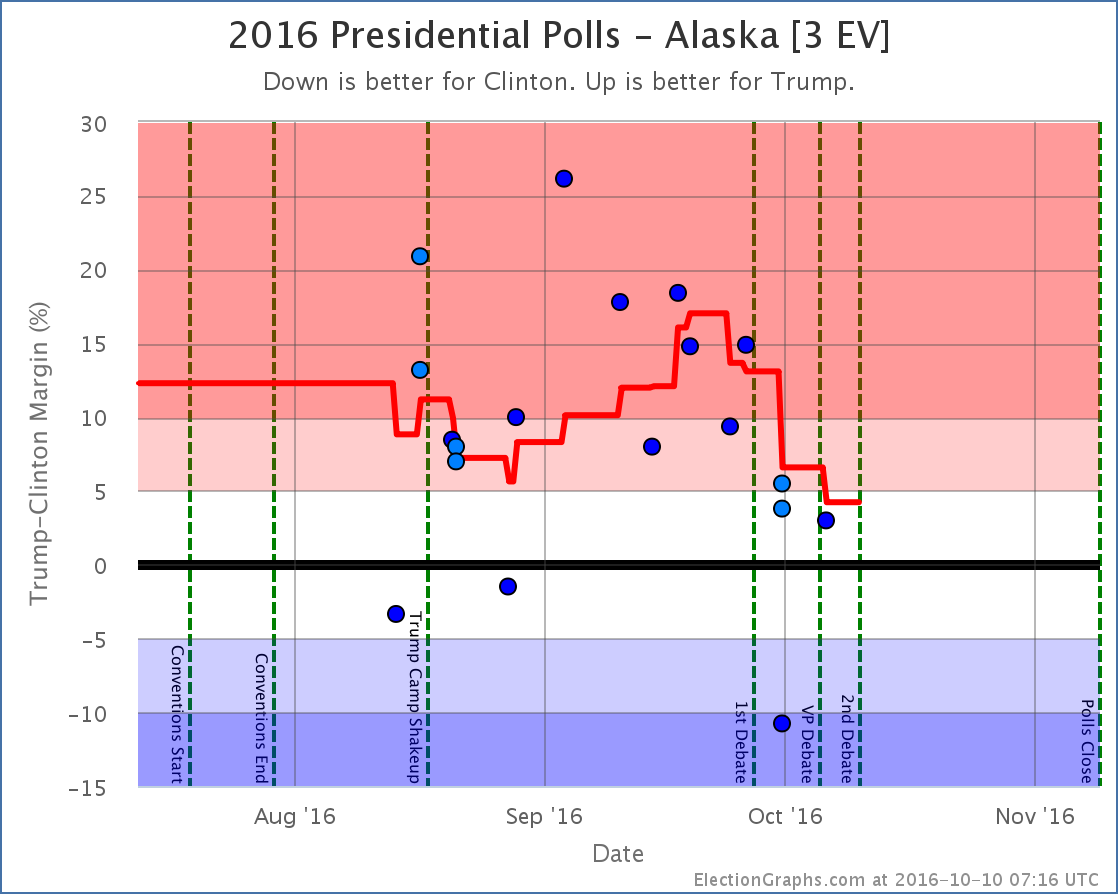
Alaska has been moving away from Trump for the last couple of weeks. With the latest additions, Trump is now up by only 4.2%. So it moves into the “Weak Trump” category.
Now, big caveat here… This is heavily influenced by a Google poll showing Clinton up by 10.8%. Google has had strange outliers in many states this cycle, and this may well be one of them. So it is quite possible this won’t last as additional new polls come in. Without Google, Trump’s lead would still be at 9.1%.
Having said that, there have been two non-Google polls since the first debate. If you only average those, you have a 3.8% Trump lead. Still in “Weak Trump” territory. So saying Alaska is looking much closer than it did is probably still quite fair.
In any case, we have a policy of including just about everything, so the Google polls count, and so Alaska is at Trump +4.2% now, which is a narrow enough lead that the state is now a possible Clinton pick up.
For more information…
This post is an update based on the data on ElectionGraphs.com. Election Graphs tracks both a poll based estimate of the Electoral College and a numbers based look at the Delegate Races. All of the charts and graphs seen in this post are from that site. Additional graphs, charts and raw data can be found there. Follow @ElectionGraphs on Twitter or like Election Graphs on Facebook to see announcements of updates or to join the conversation. For those interested in individual general election poll updates, follow @ElecCollPolls on Twitter for all the polls as they are added. If you find the information in these posts interesting or useful, please consider visiting the tip jar.