States with new poll data added since the last update: Everywhere except Alaska, DC, Hawaii, Rhode Island, Vermont, Wyoming, and the Nebraska congressional districts.
Notable changes in: Indiana and the tipping point
National Summary
We now have plenty of polls that are after the Access Hollywood tape and after the 2nd debate, and even a few from after the various sexual assault allegations leveled against Donald Trump. The averages go back further, often covering 2-3 weeks, even for the close states. But we are getting to the point where we should be seeing impact from those events.
After the first debate, we did see a big drop. It continued through to release of the tape and the second debate. We are still getting polls covering the period immediately after that, so things may yet change… but so far there has not been a further drop since those events.
In fact, we have seen an improvement for Trump since the last update:
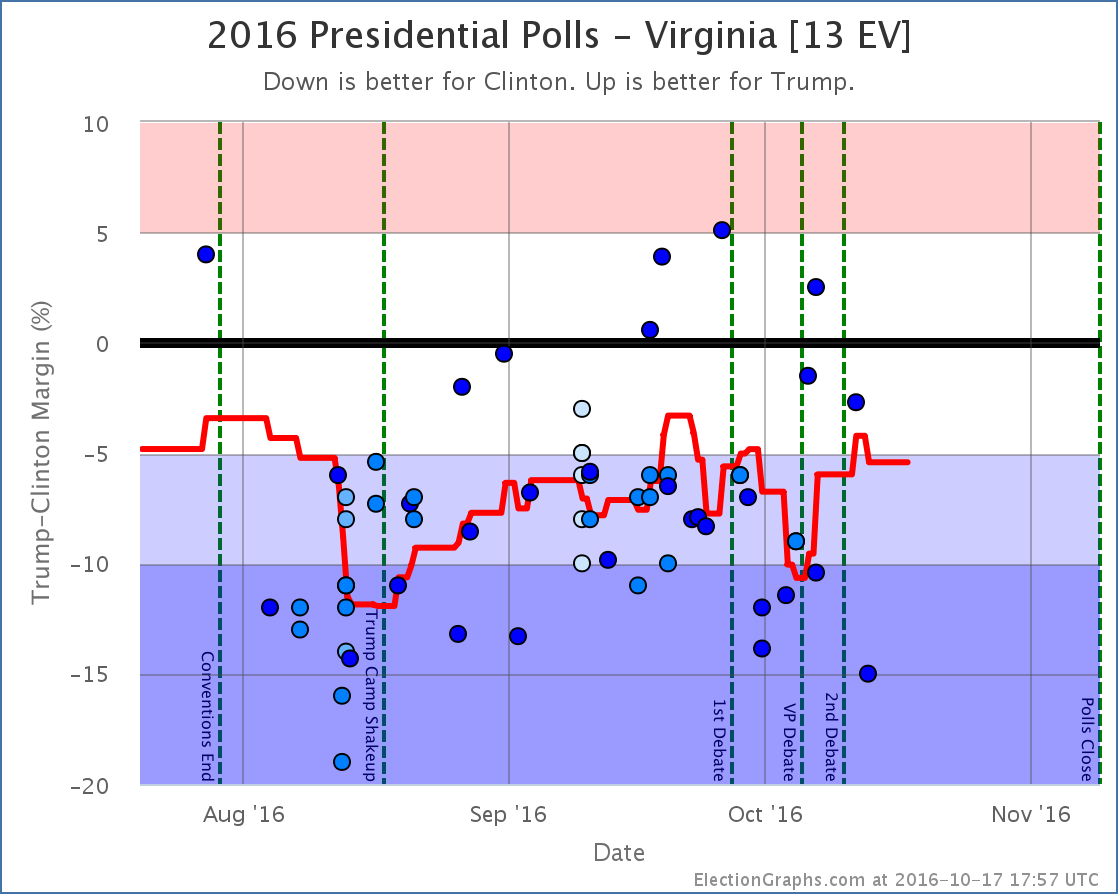
- The tipping point moved from Clinton by 6.5% in PA to Clinton by 5.4% in VA.
- Clinton’s best case declined from a 226 EV win to only a 204 EV win.
The expected case and Trump’s best case remained the same.
Here are the charts:
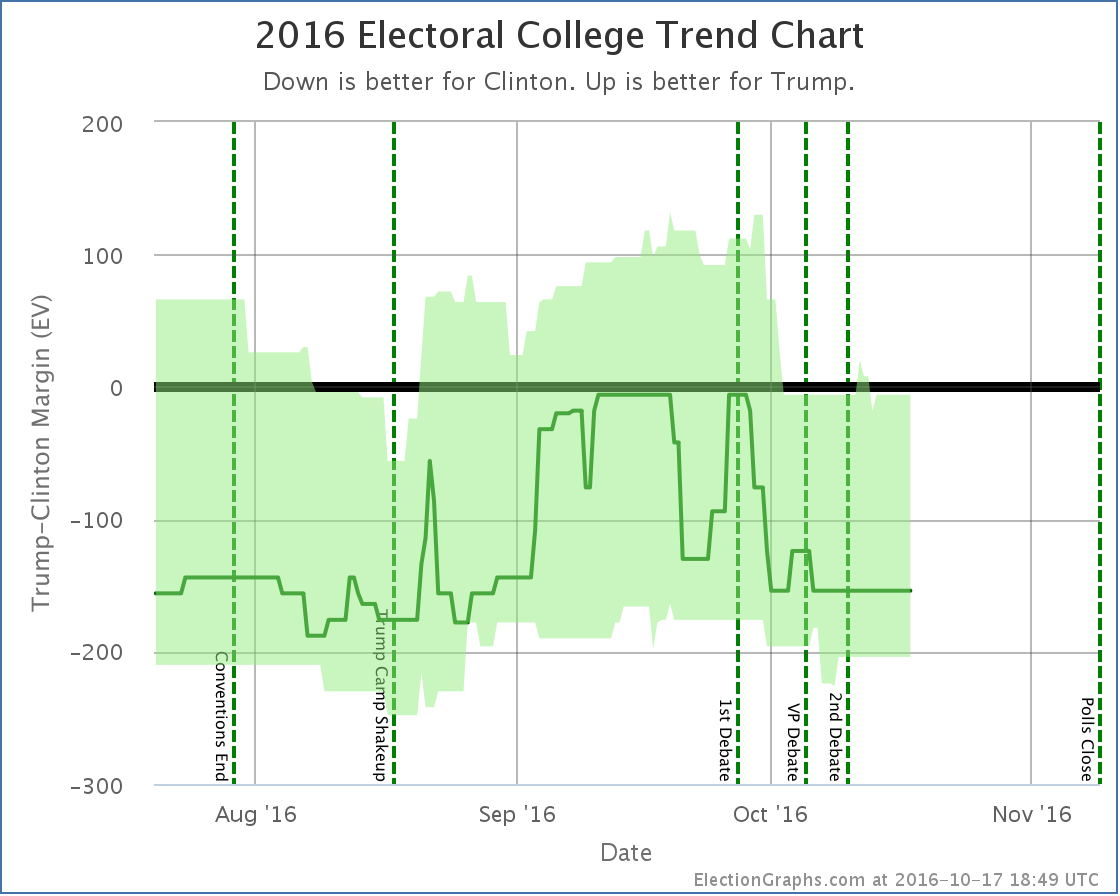
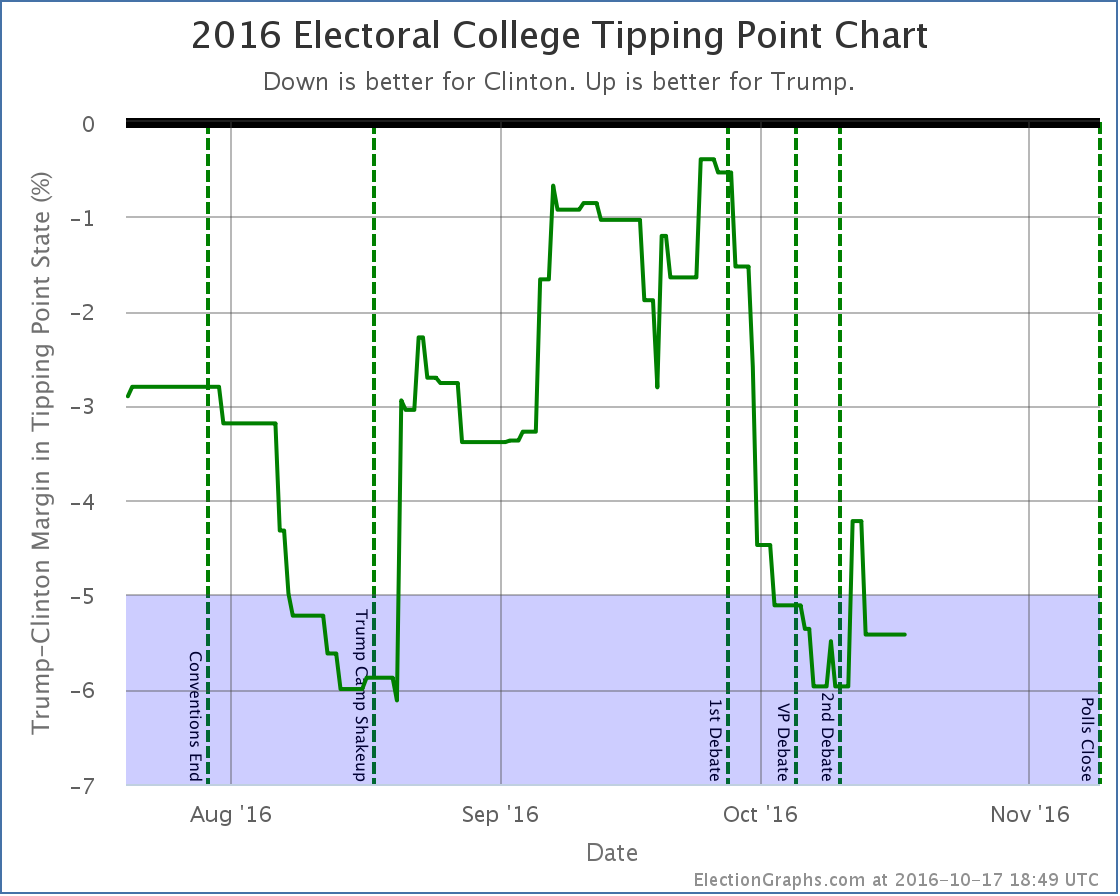
Both charts show a bit of improvement for Trump based on the last few days of polls.
Now, it might be wise to be cautious here. We are still going to get more polls covering this period. So these lines will move about some more. But it is also very possible that Trump hit his floor, and we’re now bouncing back a bit from that.
The public is very polarized. There is a percentage of Americans who will vote Democrat no matter what, and another percentage who will vote Republican no matter what. We may have seen both extremes of the how far things can change by those in the middle sloshing back and forth. If so, the extremes of this race go from a nearly tied race at Trump’s ceiling, to about a 188 electoral vote win for Clinton at her ceiling. Those are “expected case” numbers. In terms of the tipping point that translates into a Clinton lead of between approximately 0.5% and 6%.
Given recent news cycles and where things stand now, it currently seems as if a break through Trump’s floor is more likely than through his ceiling. As has been pointed out, a comeback from this far behind with this little time left would be unprecedented. But while it is possible that events may cause us to break out of that range, it seems very likely that when the votes come in on November 8th, we’ll find ourselves somewhere between those bounds.
But we shall see soon enough… 22.1 days left to go!
State Details
Moving out of Clinton’s reach
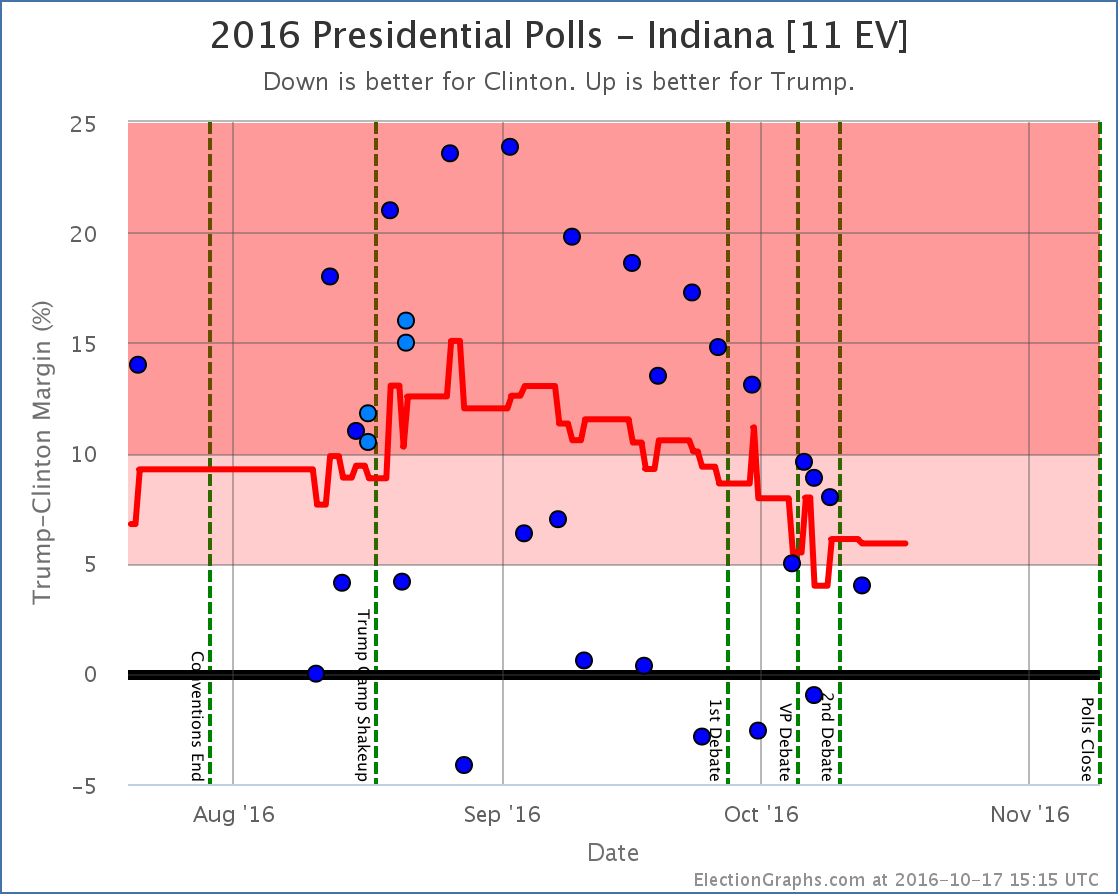
The general trend in Indiana has been a steadily weakening lead for Trump. But with the latest polls, the average pops up to a 5.9% Trump lead, so for now, Indiana is no longer in the “could go either way” category.
State that changed the tipping point
A note about McMullin
In the last week or two McMullin has spiked in Utah. Some individual polls show him within striking range of winning Utah. All of the current Election Graphs metrics and charts operate under the assumption that no third party has a realistic shot at winning electoral votes. I have had the outline of a contingency plan on how to modify the site to accommodate 3rd parties that might win electoral votes, but activating it would take quite a lot of work. If a 3rd candidate had gotten to that position a month or two ago, the site would definitely have been revamped to adjust for that possibility. As it is, there simply may not be time to do that before election day.
Right now the Real Clear Politics average in Utah, which includes McMullin, stands at Trump 31.8%, Clinton 25.5%, McMullin 22.8%, Johnson 8.8%, Stein 1.0%. (The Election Graphs Utah average currently stands at Trump 39.0%, Clinton 26.8%, but doesn’t yet include at least one poll that came out as this update was being finalized.) If and when the RCP average shows McMullin within 5% of the lead in the state, I will at the very least put notes at appropriate places on the site noting he has the possibility of winning 6 electoral votes. I will consider more substantial changes only if time allows.
For more information…
This post is an update based on the data on ElectionGraphs.com. Election Graphs tracks both a poll based estimate of the Electoral College and a numbers based look at the Delegate Races. All of the charts and graphs seen in this post are from that site. Additional graphs, charts and raw data can be found there. Follow @ElectionGraphs on Twitter or like Election Graphs on Facebook to see announcements of updates or to join the conversation. For those interested in individual general election poll updates, follow @ElecCollPolls on Twitter for all the polls as they are added. If you find the information in these posts interesting or useful, please consider visiting the tip jar.
Edit 22:51 UTC to add McMullin note.