This is the website of Abulsme Noibatno Itramne (also known as Sam Minter).
Posts here are rare these days. For current stuff, follow me on Mastodon
|
States with new poll data since the last update: Virginia, Nevada, Arizona
The polls keep coming, as they will straight through November. This time there is one change of note, reversing the movement in Nevada from a few days ago.
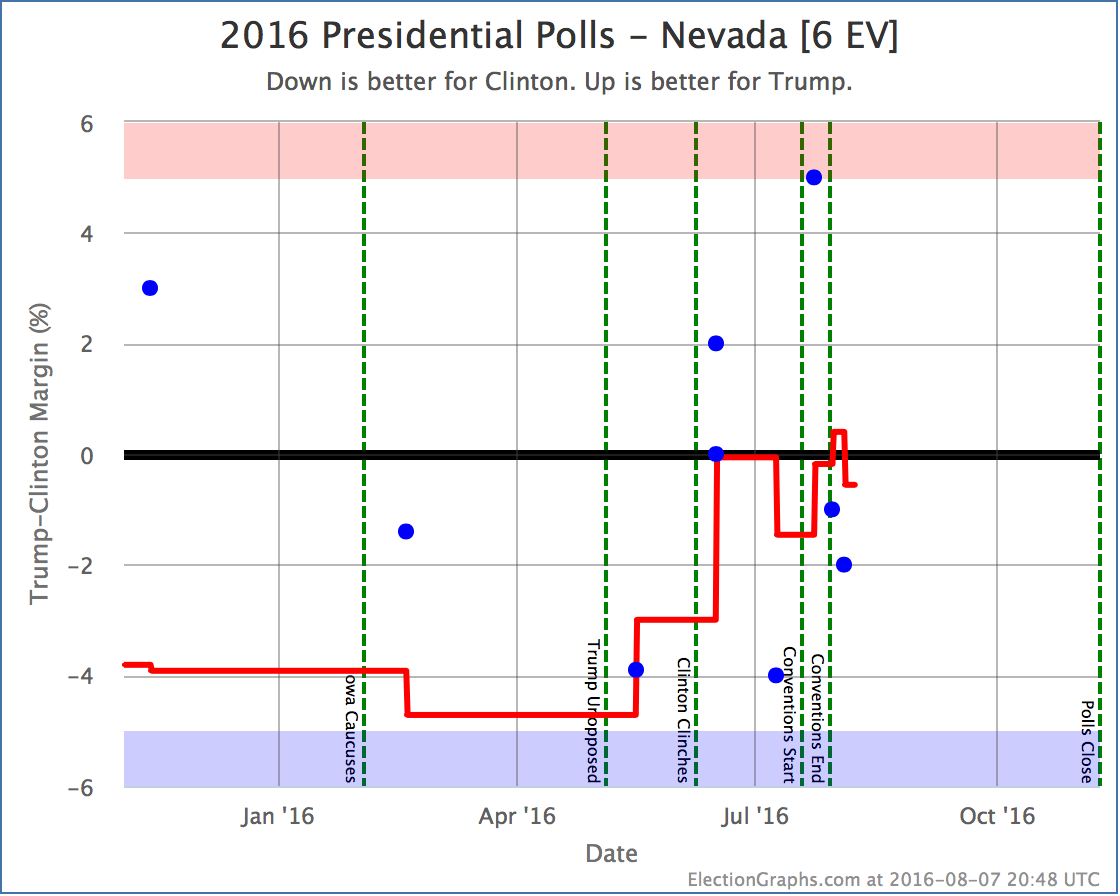
The polls making up the average still range from Clinton +4.0% to Trump +5.0%. There is wide variance here. The latest poll moves the average to Clinton +0.6%. So just on the Clinton side of the line again. In the end though, the best we can really say is that Nevada could easily go either way given current polling.
For the moment though, Nevada is back on the Clinton side of the center line.

This changes the “expected case” where everybody wins all the states where they lead the polls to Clinton 363 Trump 175, a 188 electoral vote margin for Clinton.
This is Clinton’s best showing in the expected case, tying a brief period in May. The other metrics are not at record levels at the moment, but this is the most important of the metrics tracked here… the actual expected outcome of the election.
The time since the conventions ended has been very good for Clinton. So far. We’ll see how long the trend continues. Clinton may well be near a ceiling here. At this point further gains for Clinton would be involve pulling in states like Arizona, Texas, or Utah. Those states are much closer that was once expected, but they may be very hard to pull in that last little bit.
Of course, even if this is a ceiling for Clinton, the ceiling is at a level where she wins decisively. If we actually see those states going blue, it may be time to start talking about a landslide after all. In the mean time though, if this was a normal campaign, the more realistic expectation would be to see things start drifting back toward Trump from here.
With how things are going though, who knows.
93.1 days until polls start to close on election day.
Note: This post is an update based on the data on ElectionGraphs.com. Election Graphs tracks both a poll based estimate of the Electoral College and a numbers based look at the Delegate Races. All of the charts and graphs seen in this post are from that site. Additional graphs, charts and raw data can be found there. Follow @ElectionGraphs on Twitter or like Election Graphs on Facebook to see announcements of updates or to join the conversation. For those interested in individual general election poll updates, follow @ElecCollPolls on Twitter for all the polls as they are added. If you find the information in these posts interesting or useful, please consider visiting the tip jar.
States with new poll data since the last update: Georgia, Michigan
The string of bad news for Trump continues. This time out of Georgia:
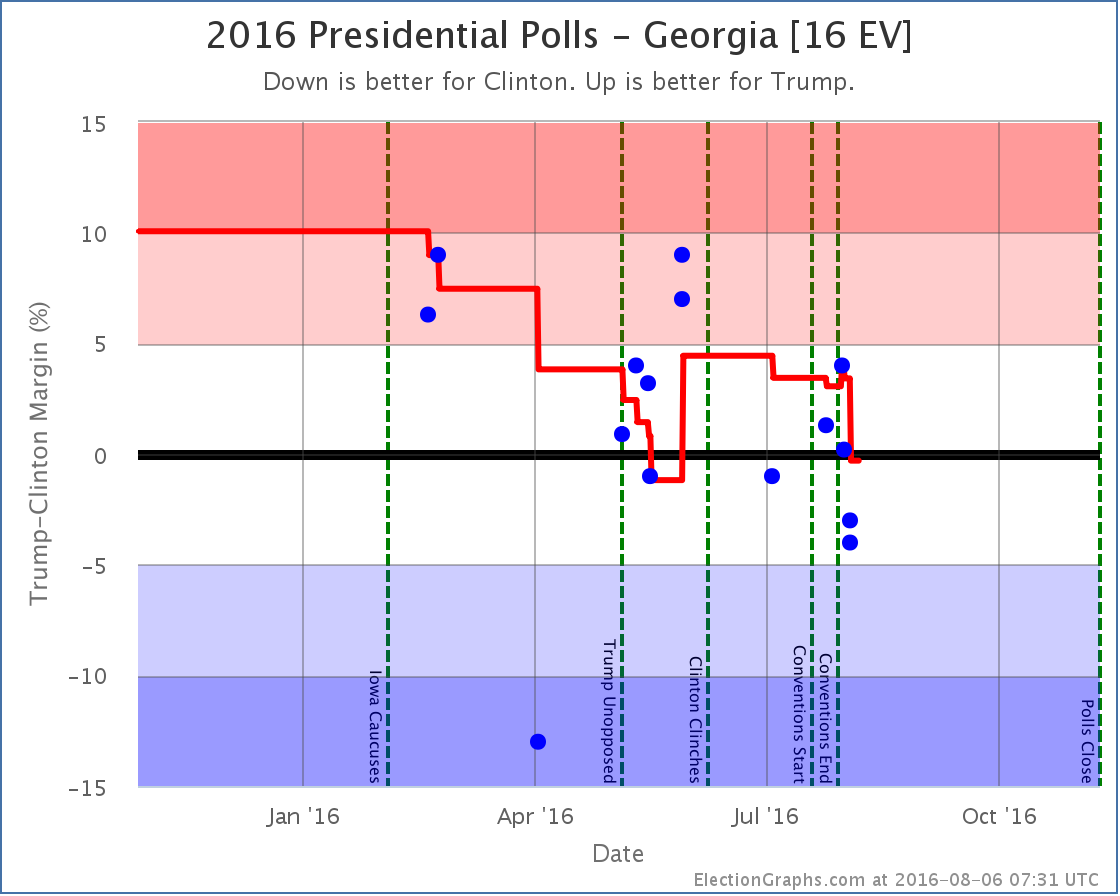
Georgia has looked like a swing state ever since there were enough Clinton vs Trump polls to draw any real conclusions. It has consistently looked close. There was even a brief time in May where Clinton led in Georgia.*
With the latest results in Georgia, Clinton once again leads… but the polls in the average range from Clinton +4.0% to Trump +4.0%. The average itself is very close. Clinton only leads by 0.3%. The only real conclusion here right now is that Georgia could go either way. Which is remarkable, since this is Georgia. Georgia hasn’t gone blue since Bill Clinton won there in 1992.
Clinton’s very narrow lead here may well disappear with the very next poll, but for the moment, she is slightly ahead, so Georgia goes into her column.
If each candidate wins each of the states they are ahead in, Clinton now wins 357 to 181, a 176 electoral vote margin. This doesn’t yet match her high in May of a 188 electoral vote win in the expected case, but it is getting close.
With talk of a massive Trump loss once again dominating the chatter about the election, keep in mind that a 176 electoral vote margin still places Trump in the zone where he is doing worse than Romney (126 EV loss) but better than McCain (192 EV loss). Trump is losing, but it is the same sort of loss as the last couple of Republican candidates, not something of historic proportions. At least not at the moment.
Of course, there are 94.2 days until the polls close. That is plenty of time for things to change. A lot. It could get worse for Trump… or it could get better. It may well be that the latest drops are part of a Clinton convention bounce and not permanent damage for Trump. We’ll know better in a few weeks.
* This was not noted at the time because the poll that pushed Clinton over the edge wasn’t found and added until after the state had popped back to Trump.
Note: This post is an update based on the data on ElectionGraphs.com. Election Graphs tracks both a poll based estimate of the Electoral College and a numbers based look at the Delegate Races. All of the charts and graphs seen in this post are from that site. Additional graphs, charts and raw data can be found there. Follow @ElectionGraphs on Twitter or like Election Graphs on Facebook to see announcements of updates or to join the conversation. For those interested in individual general election poll updates, follow @ElecCollPolls on Twitter for all the polls as they are added. If you find the information in these posts interesting or useful, please consider visiting the tip jar.
States with new poll data since the last update: Tennessee, Arizona, Florida, Pennsylvania, Michigan, New Hampshire, North Carolina, Kentucky.
It looks like Trump’s last couple of bad weeks are starting to hit the state poll averages. In this update, we have model changes caused by the movement in three states. All three changes favor Clinton.
Going through them one by one…
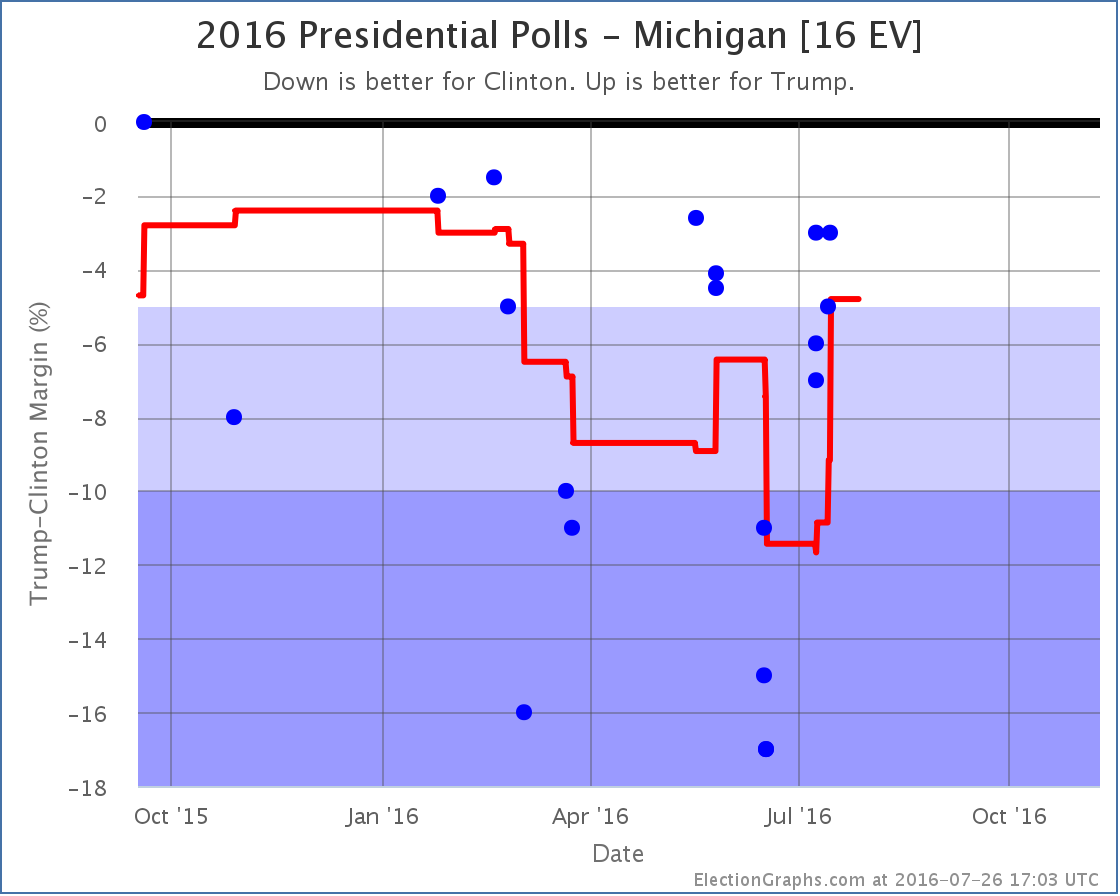
Michigan [16 EV]
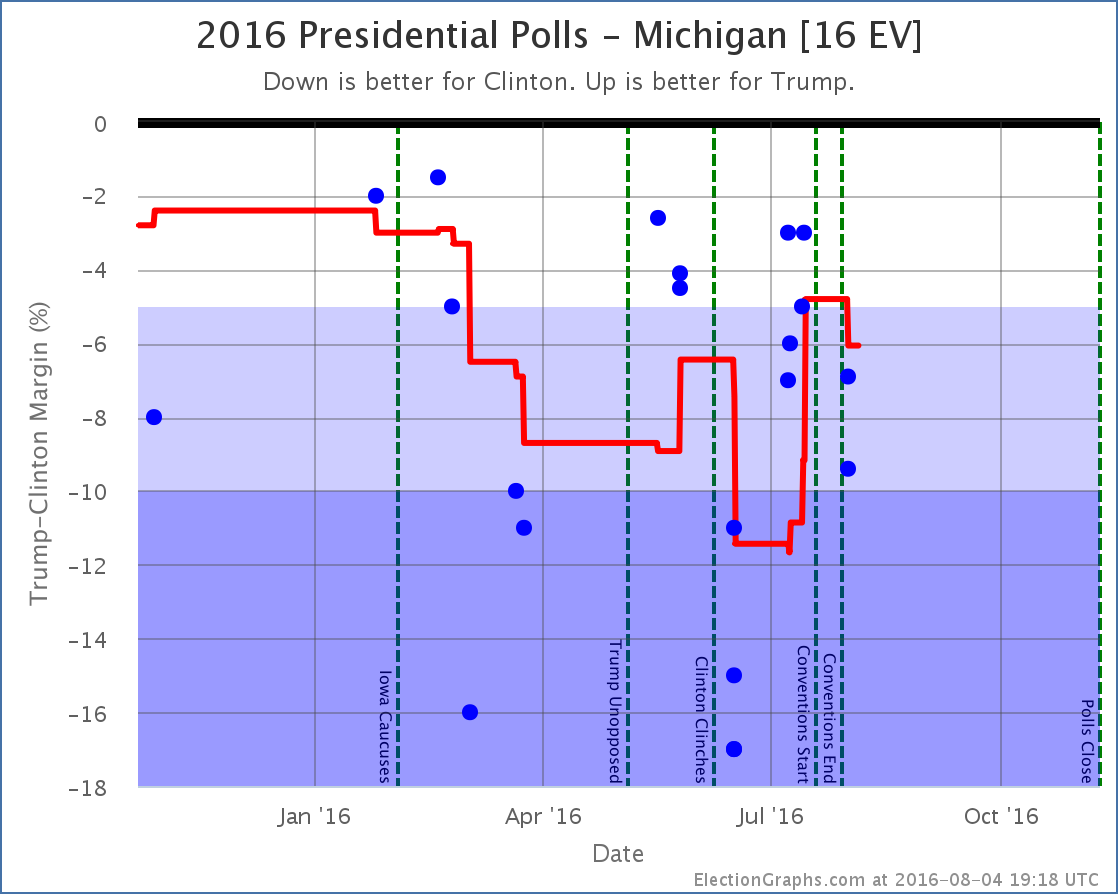
First of all, I will point out a new feature on these charts. There are now vertical dotted lines marking significant campaign events. Right now that is the Iowa caucuses, when the candidates won their primaries and the conventions. When/if debates happen, they will get marked as well. This is helpful in understanding the moves vs what may be going on in the campaign.
In Michigan specifically, you can see that Trump was gaining on Clinton in the run up to the conventions. The average popped up into the “close state” zone right before the conventions started. But with the first post-convention polls, Clinton’s lead increases again. She now has a 6.1% lead in Michigan, and the state is no longer included in Trump’s “best case”.
New Hampshire [4 EV]
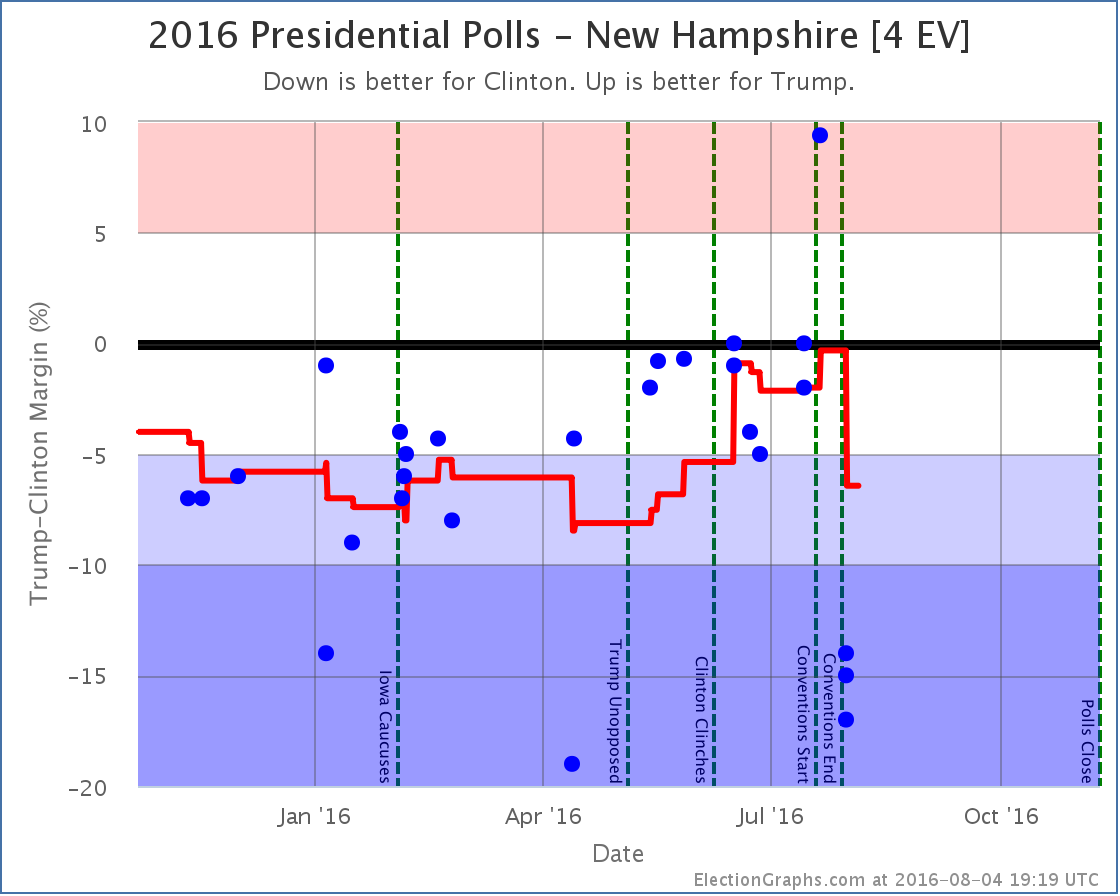
A poll taken during the Republican convention was the best result Trump has ever gotten in New Hampshire. This had moved the average to an very narrow 0.3% Clinton lead. The first results from after the Democratic convention on the other hand are some of the worst results Trump has seen in New Hampshire, and Clinton’s lead rises to 6.4%. So, like Michigan, New Hampshire is no longer looking like a possible Trump pick up. Since New Hampshire also moved past the tipping point, the tipping point also moved.
Now, both the Trump result during the Republican convention, and these new results look like outliers. Every other poll since May has been between a tie and Clinton +5%. So polls showing Trump up by 9.4%, or polls showing Clinton up by 17% should all be taken with a massive grain of salt. Given national trends some swing toward Clinton is expected, but we need to see more polls before concluding that the swing toward Clinton in New Hampshire is quite as large as the new polling indicates.* This is of course why we only look at averages rather than individual polls. The average moved quite a bit, but it doesn’t instantly snap to these new results. But it still moves enough to make a difference.
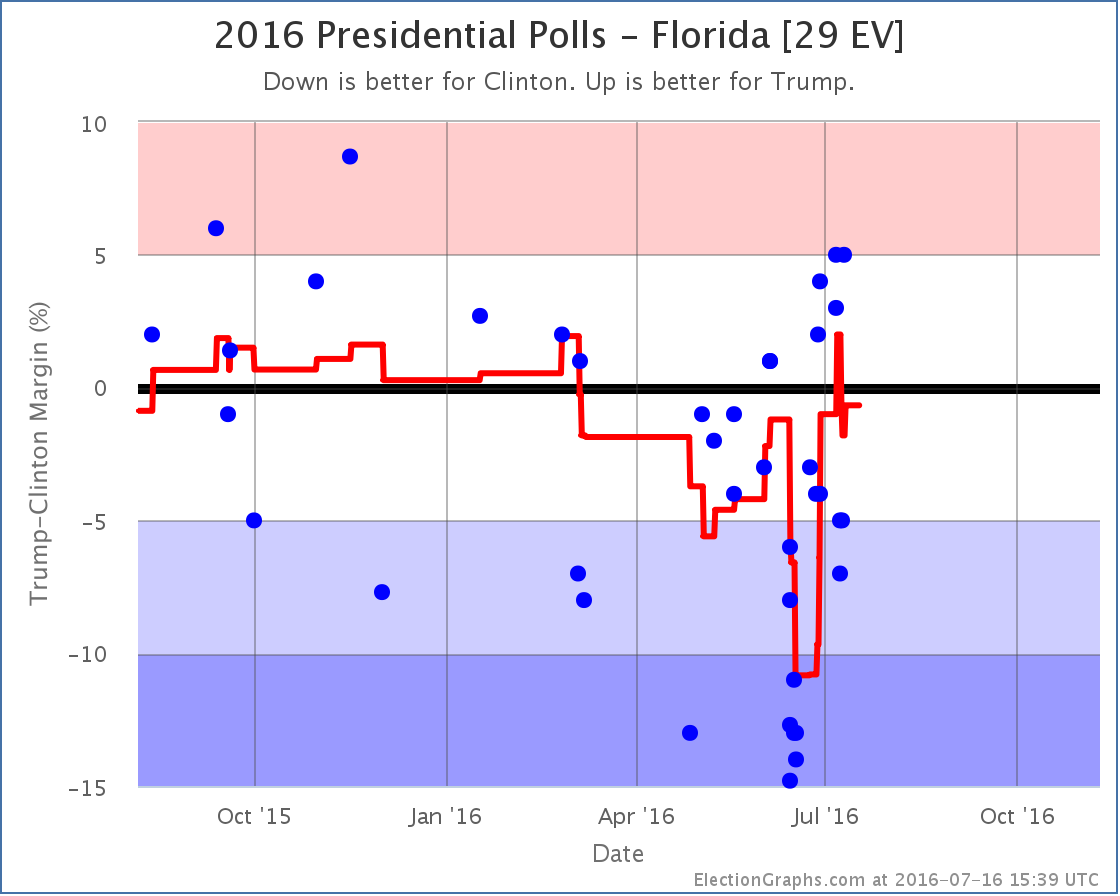
Florida [27 EV]
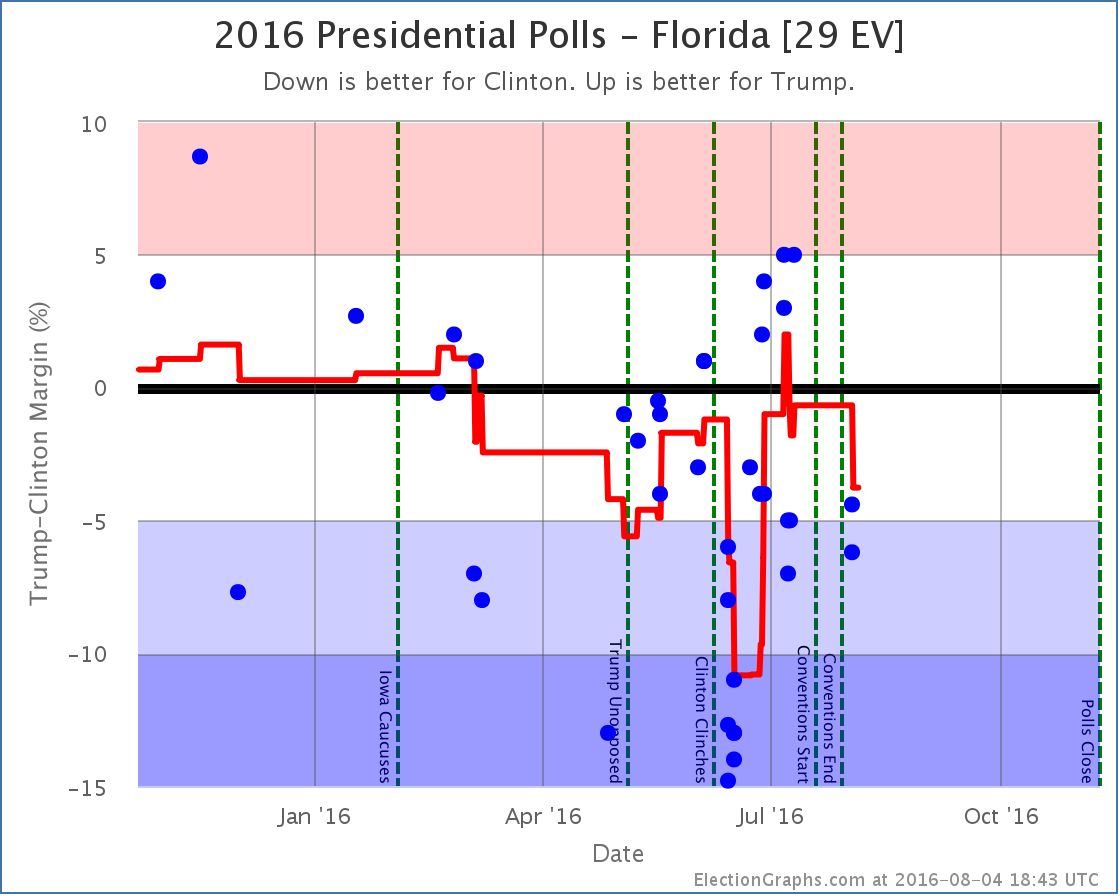
The first post-convention results in Florida move the average toward Clinton. Florida goes from a 0.7% Clinton lead to a 3.8% Clinton lead. No category change here. Florida is still weak Clinton, but since the average passes the tipping point, the tipping point gets shifted.
National View
With each of the three states that caused changes out of the way, time to look at the national picture.
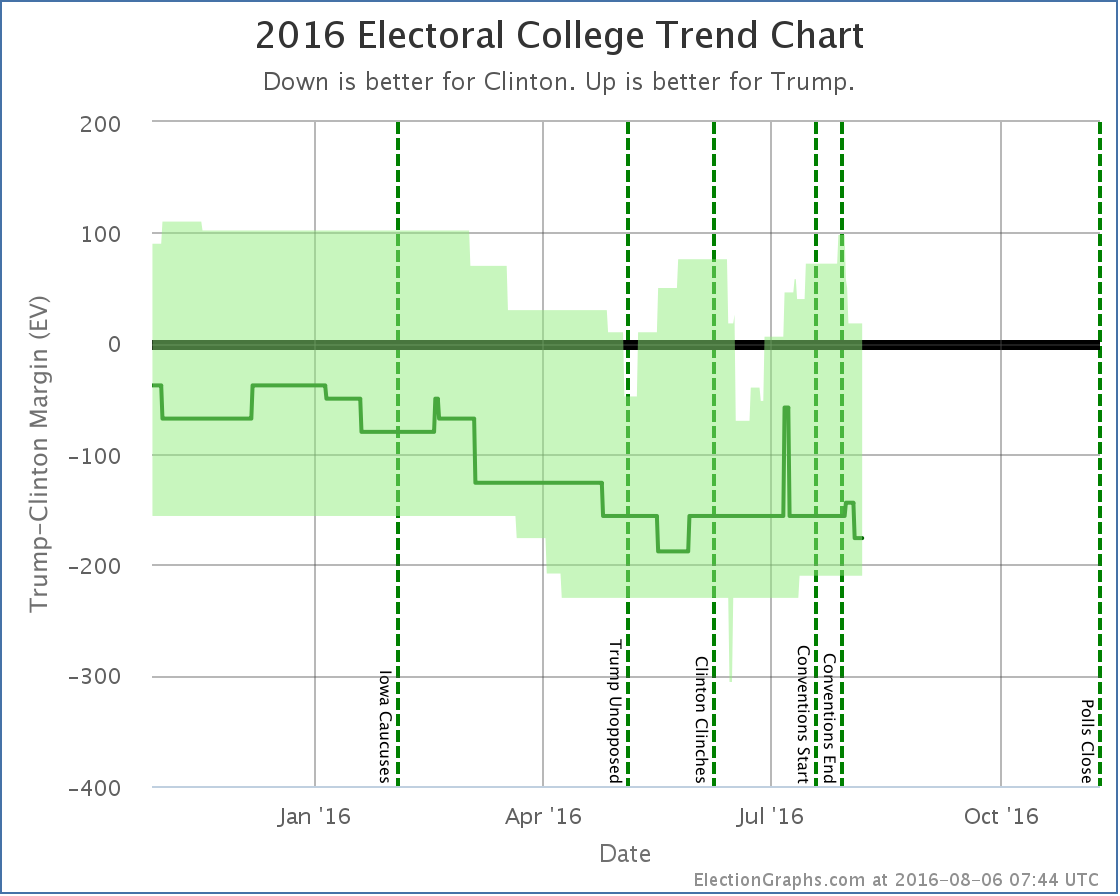
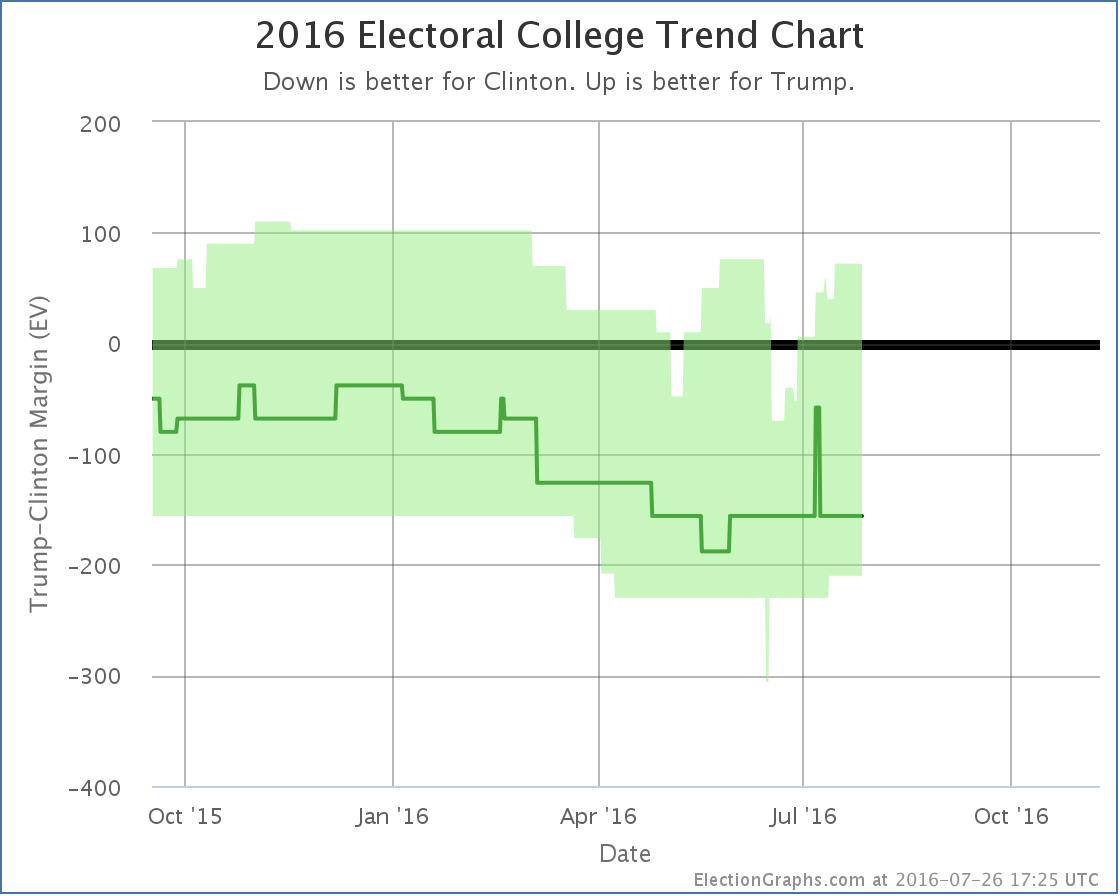
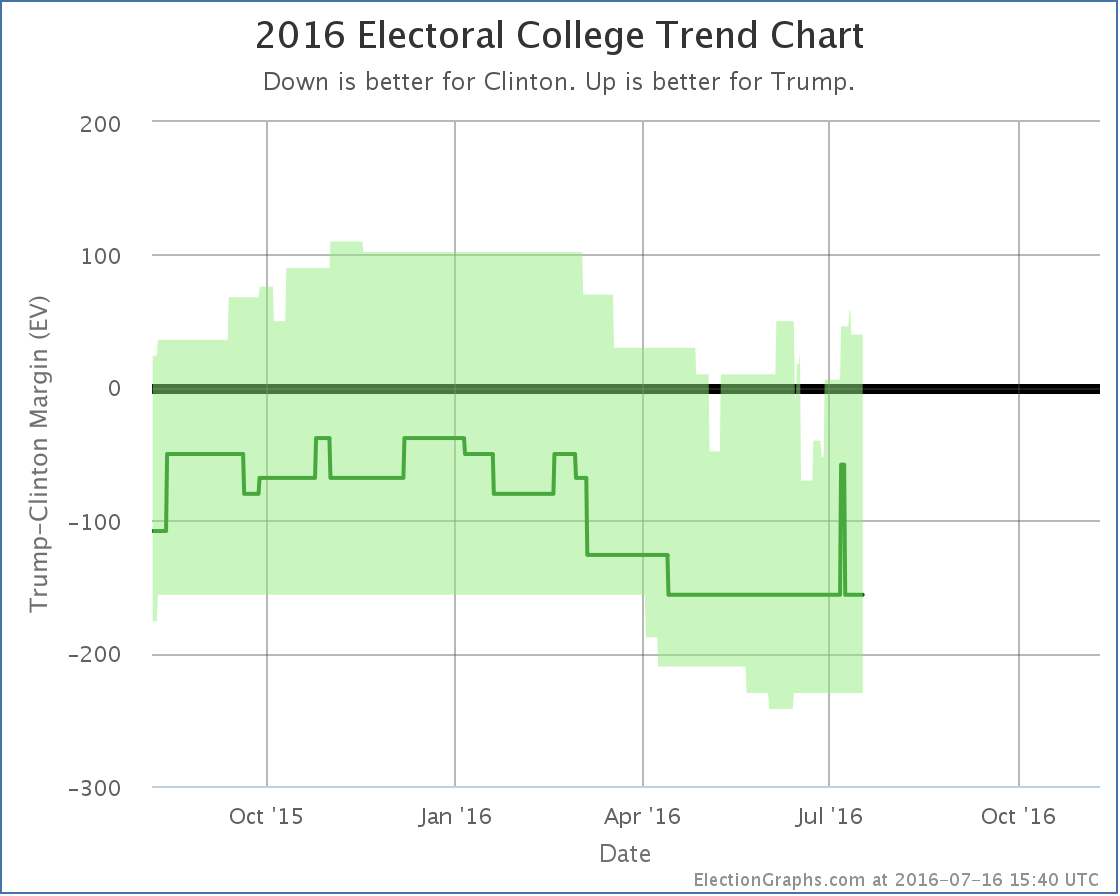
First the “bubble” showing the best and expected cases over time:
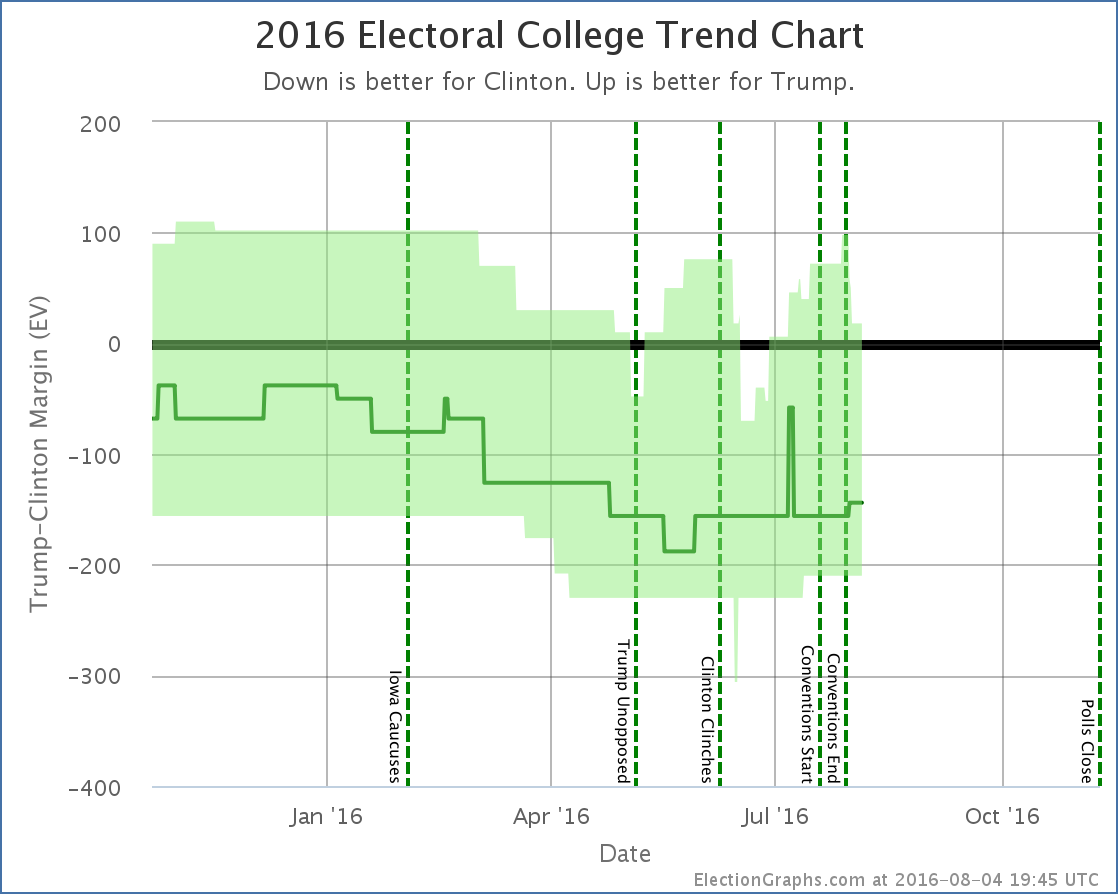
Right before the Democratic convention ended, Trump’s best case was up to winning by 98 electoral votes. Since then Pennsylvania, Michigan, and New Hampshire have slipped out of reach. His best case is now down to winning by only 18 electoral votes. He is one bad poll in Virginia, Florida, or North Carolina away from once again having his best case be a loss.
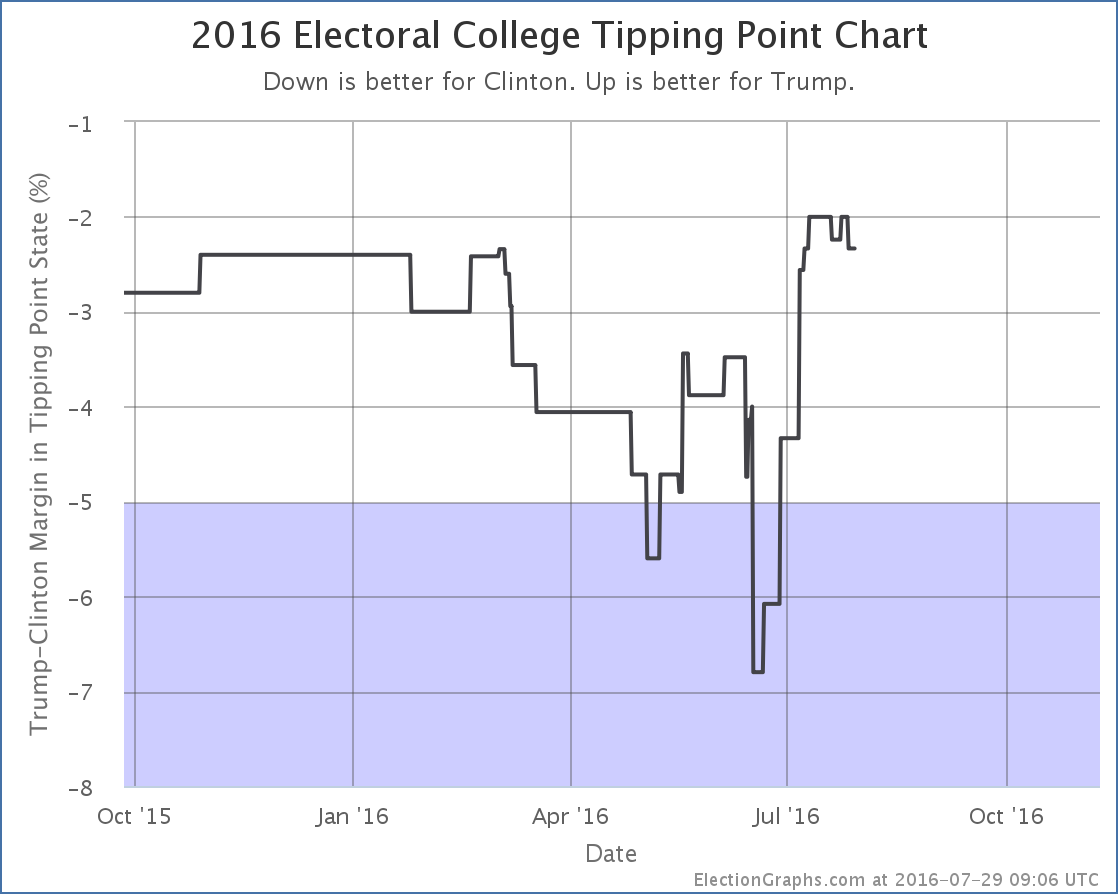
And with the movements in Florida and New Hampshire the tipping point moves dramatically as well:
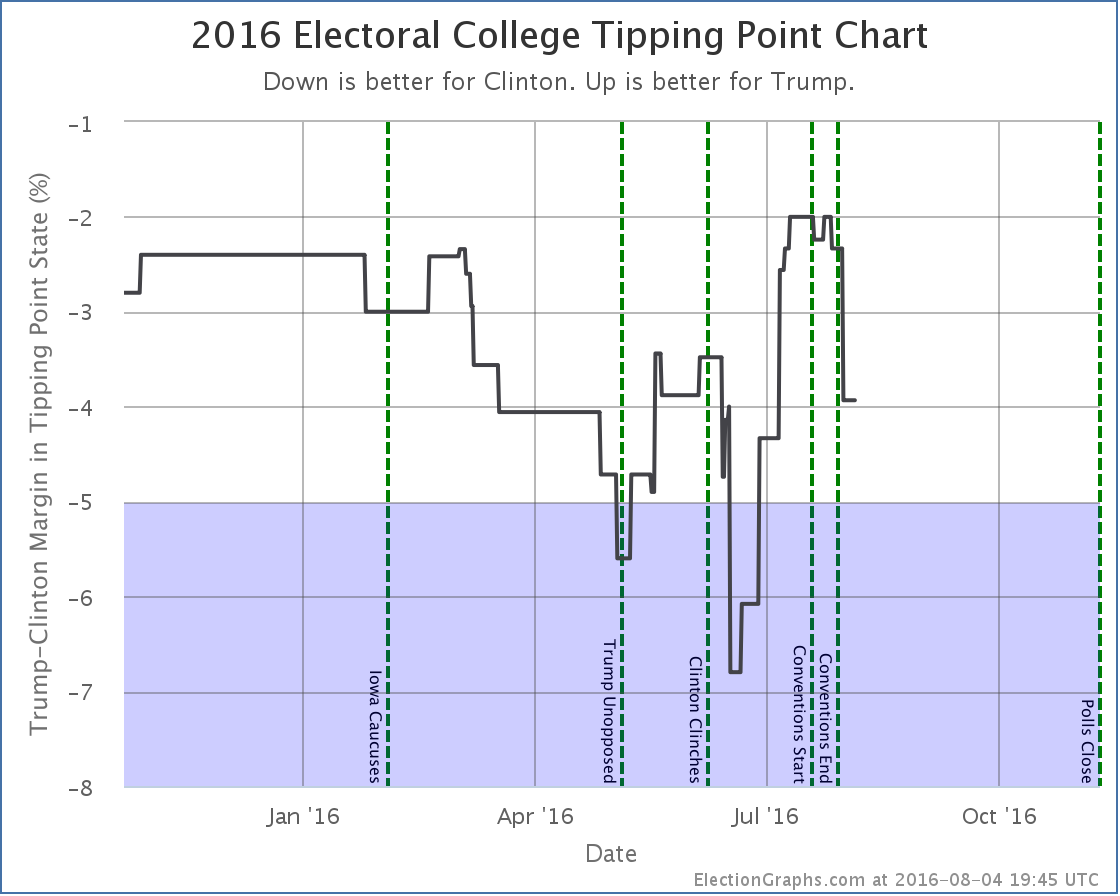
The tipping point margin… that is the margin in the state that would put the candidate “over the top” if you order the states by how strongly they support the candidates, moves from Clinton by 2.3% in North Carolina to Clinton by 3.9% in Virginia.
Before the conventions, Trump had dramatically improved his position in the tipping point. He was still losing, but by much less than before. He has now given up about 40% of the margin he gained.
A 3.9% tipping point margin… which is basically equivalent to the national popular vote margin, but adjusted for the structure of the electoral college… is still a close race. But not as close as it was before the conventions… and there are many close states that have not yet had post-convention polls.
Given where national polling is right now, once we do get more state polls, it would not be surprising to see Trump continue to drop in the short term.
95.7 days until the first polls start to close on election day.
* For the wonkiest of you out there: All three results showing Clinton up by double digits were from the same underlying WBUR poll sliced in different ways, so were not actually fully independent samples, so they don’t count as additional confirmation. This election cycle when I have a single poll that reports multiple results… just 2 candidates along side with 4 candidates, or registered voters and likely voters, or first response vs pushing leaners, I’m including ALL of the results rather than having some set of rules for picking only one. There are strong arguments for NOT doing this, specifically what I just mentioned about the results not being truly independent of each other, so you essentially end up giving more weight than you would otherwise to that pollster, simply because they reported their results in several different ways. I am simply defaulting to including everything on the theory that being more complete is better. I do understand the downsides though. I may decide to handle this a different way in 2020, but this is how it is for 2016. :-)
Note: This post is an update based on the data on ElectionGraphs.com. Election Graphs tracks both a poll based estimate of the Electoral College and a numbers based look at the Delegate Races. All of the charts and graphs seen in this post are from that site. Additional graphs, charts and raw data can be found there. Follow @ElectionGraphs on Twitter or like Election Graphs on Facebook to see announcements of updates or to join the conversation. For those interested in individual general election poll updates, follow @ElecCollPolls on Twitter for all the polls as they are added. If you find the information in these posts interesting or useful, please consider visiting the tip jar.
States with new poll data since the last update: Georgia, Pennsylvania, Nevada.
The post convention polls continue to come in, but the most recent batch brings mixed results. One state moving toward Clinton, another moving toward Trump. Lets look at them.
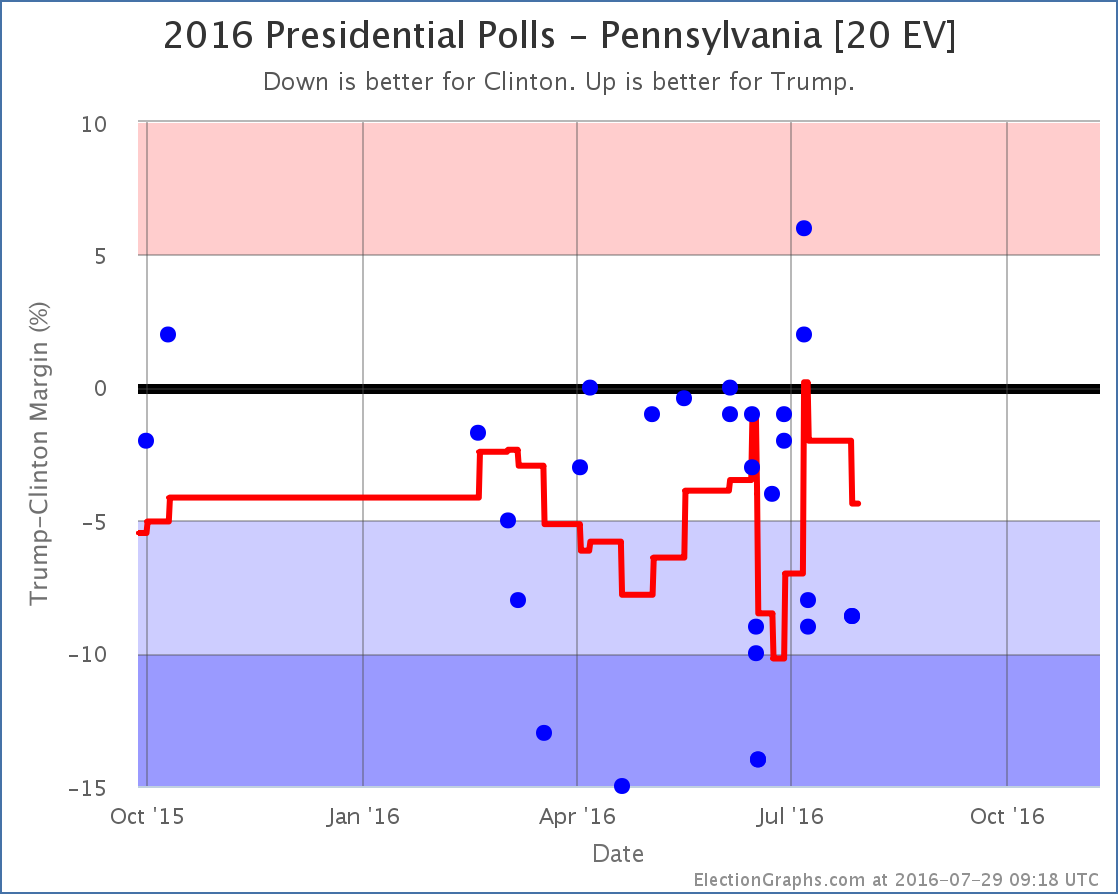
Pennsylvania [20 EV]
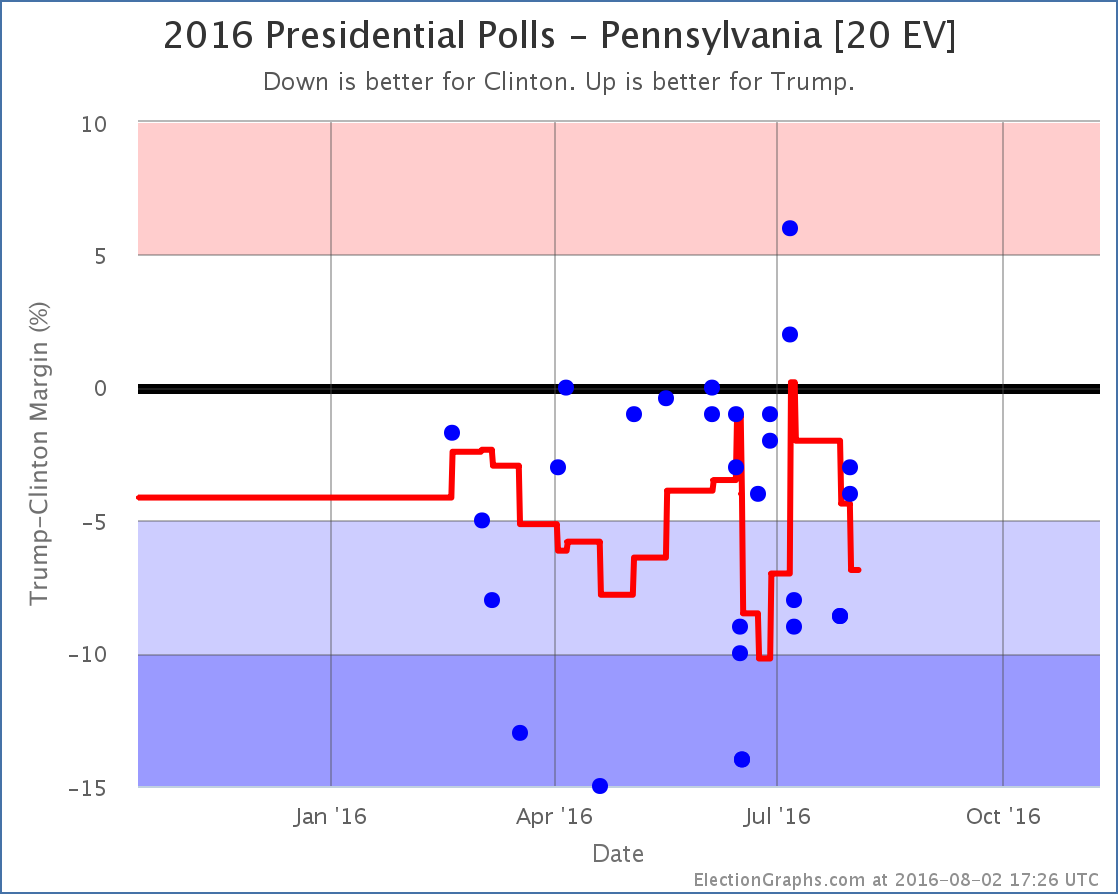
With the new PPP results added, Quinnipiac data from early July drop off the average. Those Quinnipiac results were the best polls for Trump in Pennsylvania in almost a year. Without them, Clinton looks much better off. The poll average moves from a Clinton lead of 4.4% to a Clinton lead of 6.9%.
With that, we once again classify Pennsylvania as “Strong Clinton” and take it off the list of states where Trump is “close” and thus a Trump win is plausible.
Nevada [6 EV]
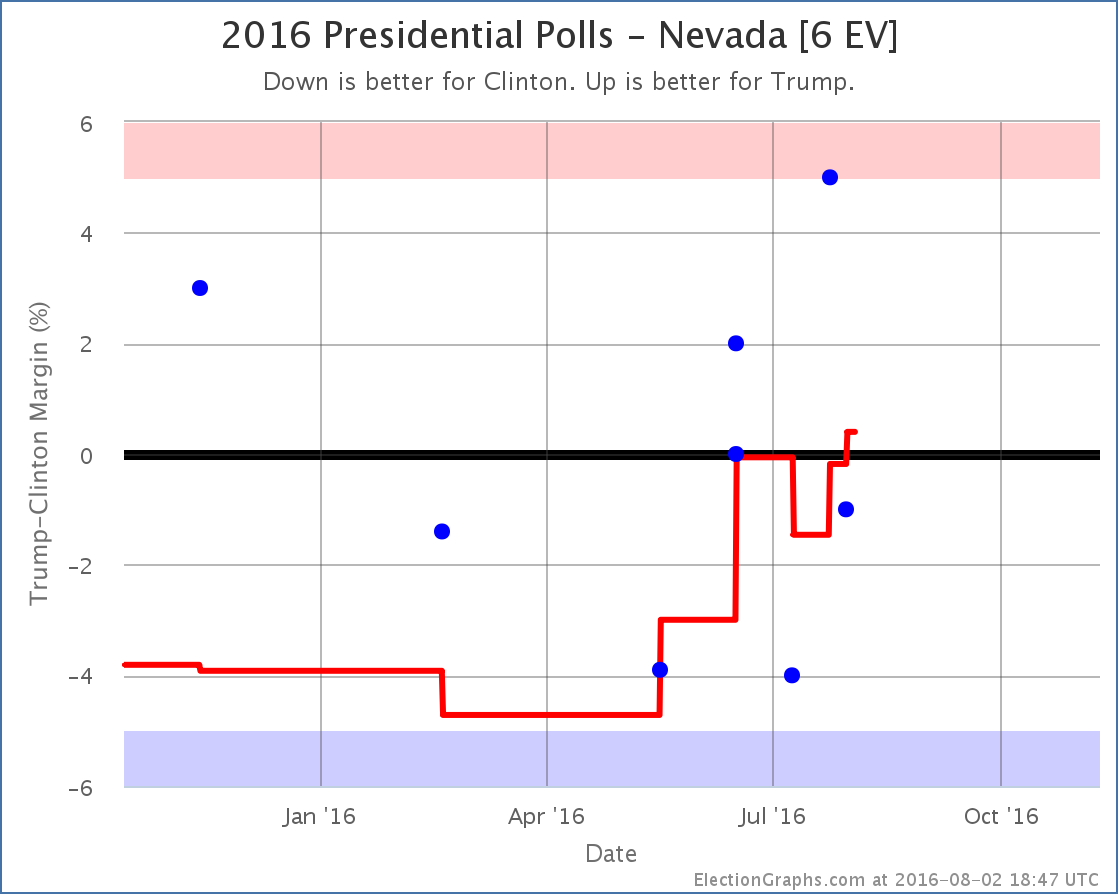
Compared to many other close states, Nevada has been sparsely polled. The latest poll actually has Clinton ahead, but by less than the poll it replaces in the average, so the average moves toward Trump… and crosses the center line! For the first time this election cycle, the Nevada poll average shows a Trump lead. A small 0.4% Trump lead, but a lead none the less.
National Picture
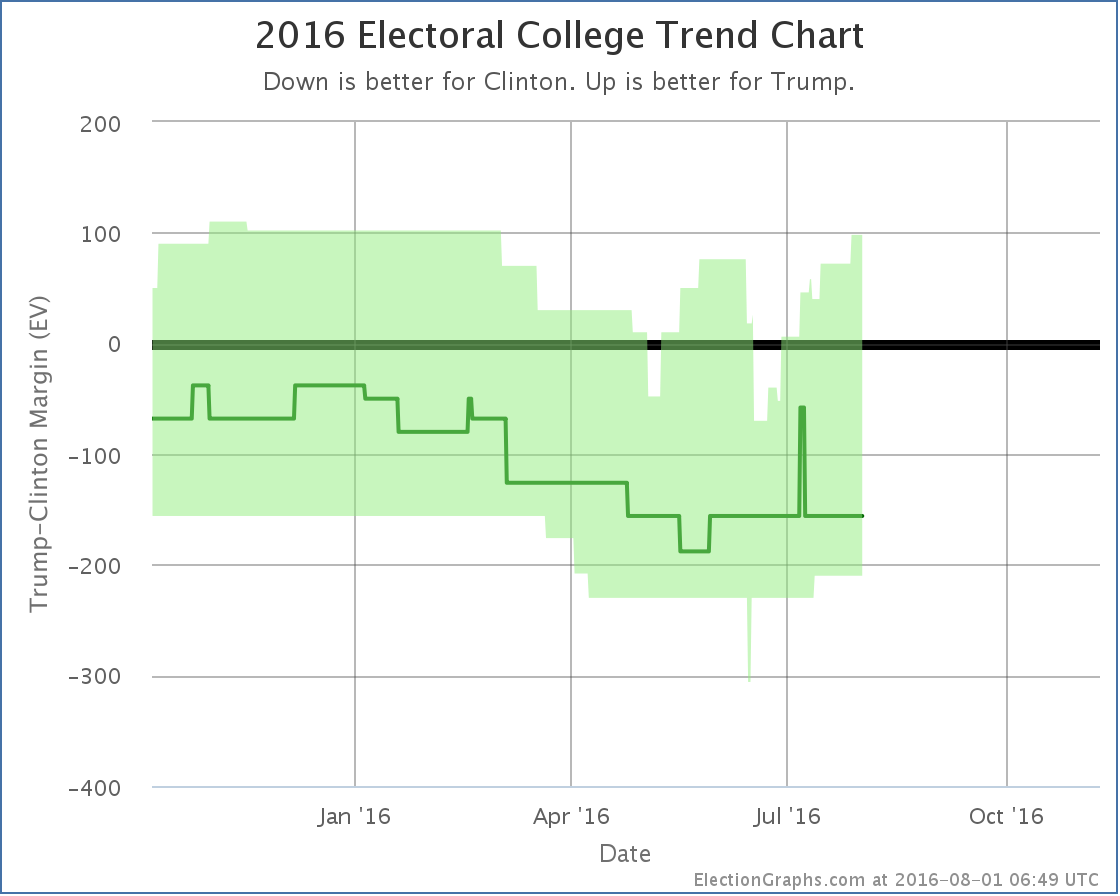
Between these two states, we have two changes in the national picture which can be seen on the national trend chart:

The upper right of the “bubble” shows a brief spike from Virginia moving into the close category yesterday, immediately followed by a drop due to the Pennsylvania change today. This looks like it might be a “top” and a start of a Trump decline in his “best case”, but as usual, use caution in making those sorts of determinations based on a single change. If more states move from Weak Clinton to Strong Clinton over the next few weeks, then that might be a valid conclusion. For now though it is premature.
And of course we have Nevada moving in the opposite direction at the same time. Nevada is a small state, but moves in the “expected case” are rare compared to changes in Trump’s best case. There was a short spike in early July that lasted a grand total of two days, but other than that this is the first move of the actual expected result toward Trump since May. We’ll see if this time it lasts longer than two days.
98.2 days until polls start to close.
Note: This post is an update based on the data on ElectionGraphs.com. Election Graphs tracks both a poll based estimate of the Electoral College and a numbers based look at the Delegate Races. All of the charts and graphs seen in this post are from that site. Additional graphs, charts and raw data can be found there. Follow @ElectionGraphs on Twitter or like Election Graphs on Facebook to see announcements of updates or to join the conversation. For those interested in individual general election poll updates, follow @ElecCollPolls on Twitter for all the polls as they are added. If you find the information in these posts interesting or useful, please consider visiting the tip jar.
States with new poll data since the last update: Missouri, Arizona, Virginia, Oklahoma
We’ve only had a couple of polls that were taken completely after both conventions, but one of them, a RABA poll in Virginia, actually makes a notable difference:
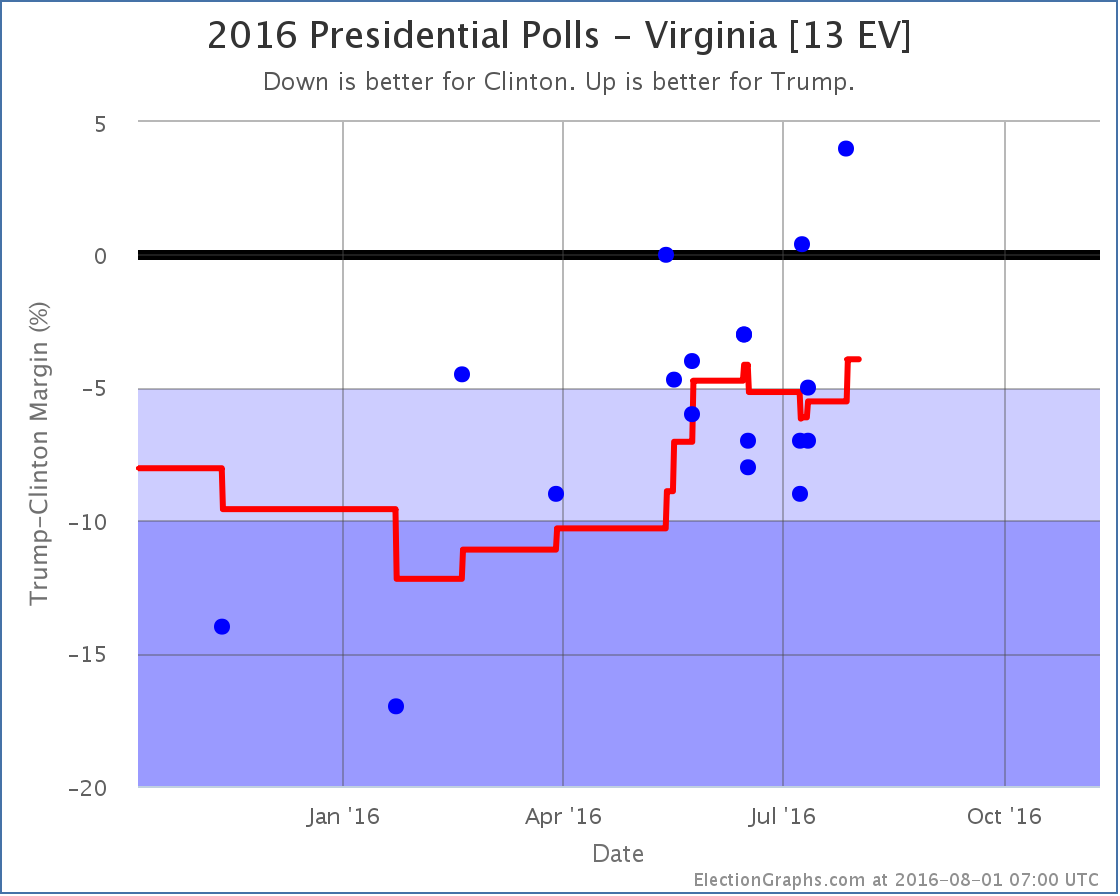
The RABA poll actually shows Trump ahead in Virginia by 4%. This is the best single result Trump has ever gotten against Clinton in Virginia, and is noticeably out of line with other recent results. This could be a real result of movement caused by the two conventions… or it could just be an outlier. In any case, we just throw it into the average with everything else for now, and Virginia moves from Clinton +5.5% to Clinton +3.9%.
This is of course under 5%, so our categorization for Virginia changes from “Strong Clinton” to “Weak Clinton” and Virginia is now considered a possible Trump pick up in his “best case”:
If Trump holds all the states he is ahead in, and then steals all the states where Clinton’s lead is less than 5%, we end up with Trump 318 to Clinton 220, a 98 electoral vote win for Trump. This is the best best case Trump has seen since early March.
Trump is succeeding in making a lot of states close, but so far has not had much success in actually dragging them over the line to his side. The “expected case” remains stubbornly stuck at Clinton 347, Trump 191, a 156 electoral vote win for Clinton.
We have now broken the 100 day barrier. 99.4 days left until the polls start to close on Election Day.
Note: This post is an update based on the data on ElectionGraphs.com. Election Graphs tracks both a poll based estimate of the Electoral College and a numbers based look at the Delegate Races. All of the charts and graphs seen in this post are from that site. Additional graphs, charts and raw data can be found there. Follow @ElectionGraphs on Twitter or like Election Graphs on Facebook to see announcements of updates or to join the conversation. For those interested in individual general election poll updates, follow @ElecCollPolls on Twitter for all the polls as they are added. If you find the information in these posts interesting or useful, please consider visiting the tip jar.
States with new poll data since the last update: Pennsylvania, California, Oregon, Delaware, Vermont, Indiana
Results from a Suffolk poll in Pennsylvania taken during the first three days of the Democratic National Convention move that state’s average toward Clinton.
The average moves from a 2.0% lead to a 4.4% lead. This is not an insubstantial jump toward Clinton, but either way we classify the state as “Weak Clinton”. Pennsylvania was the tipping point state though, so the tipping point moves too…
The tipping point moves from Clinton in Pennsylvania by 2.0% to Clinton in North Carolina by 2.3%.
This is a pretty small change in the grand scheme of things. Compare to the huge move of the tipping point in Trump’s direction from mid-June to mid-July.
Is the new jag downward the start of a new larger move back toward Clinton? Too soon to say. Stay tuned.
102.6 days until polls start to close…
Note: This post is an update based on the data on ElectionGraphs.com. Election Graphs tracks both a poll based estimate of the Electoral College and a numbers based look at the Delegate Races. All of the charts and graphs seen in this post are from that site. Additional graphs, charts and raw data can be found there. Follow @ElectionGraphs on Twitter or like Election Graphs on Facebook to see announcements of updates or to join the conversation. For those interested in individual general election poll updates, follow @ElecCollPolls on Twitter for all the polls as they are added. If you find the information in these posts interesting or useful, please consider visiting the tip jar.
States with new poll data since the last update: Georgia, Ohio, Nevada, Michigan, Missouri, New Hampshire, Kansas.
The quick answer to the question in the subject of this post is “not yet”, at least in terms of what can be detected in state poll averages like we track here. Plenty has been written elsewhere on the Trump bump in national polling averages such as Pollster and RCP. There does appear to be a bump after the Republican convention. It takes a lot longer for these effects to show up at the state level, so we are unlikely to see individual effects for the two conventions. Instead we’ll see the net effect after both.
In the meantime, there are indeed two changes from the latest batch of polls, and they both are in Trump’s direction. In one case the data is from before the convention, and in the other the movement is small, so it isn’t enough to call out as a bump yet. Looking at them individually:
Michigan
Even though one poll was just added, the most recent poll in Michigan is still from before the Republican convention, so we can’t read anything about a bump into it. But it did cause some polls that were very favorable to Clinton to roll off the poll average, so the average spikes up in Trump’s direction.
There haven’t been any polls actually showing Trump ahead in Michigan in almost a year, but with this Clinton’s lead drops to 4.8%, so we consider it a potential pickup for Trump.
Trump’s best case moves from winning by 40 electoral votes to winning by 72 electoral votes. To get there he still has to flip Nevada, New Hampshire, Iowa, Florida, Ohio, Pennsylvania, North Carolina and Michigan. Clinton is still ahead in all of those states, but by less than 5%. The “expected” result where everybody wins the states they are ahead in is still a 156 electoral vote victory for Clinton.
But Trump doesn’t need to flip ALL of those states to win, only some of them. How close is he really? That is where Ohio and the tipping point come in…
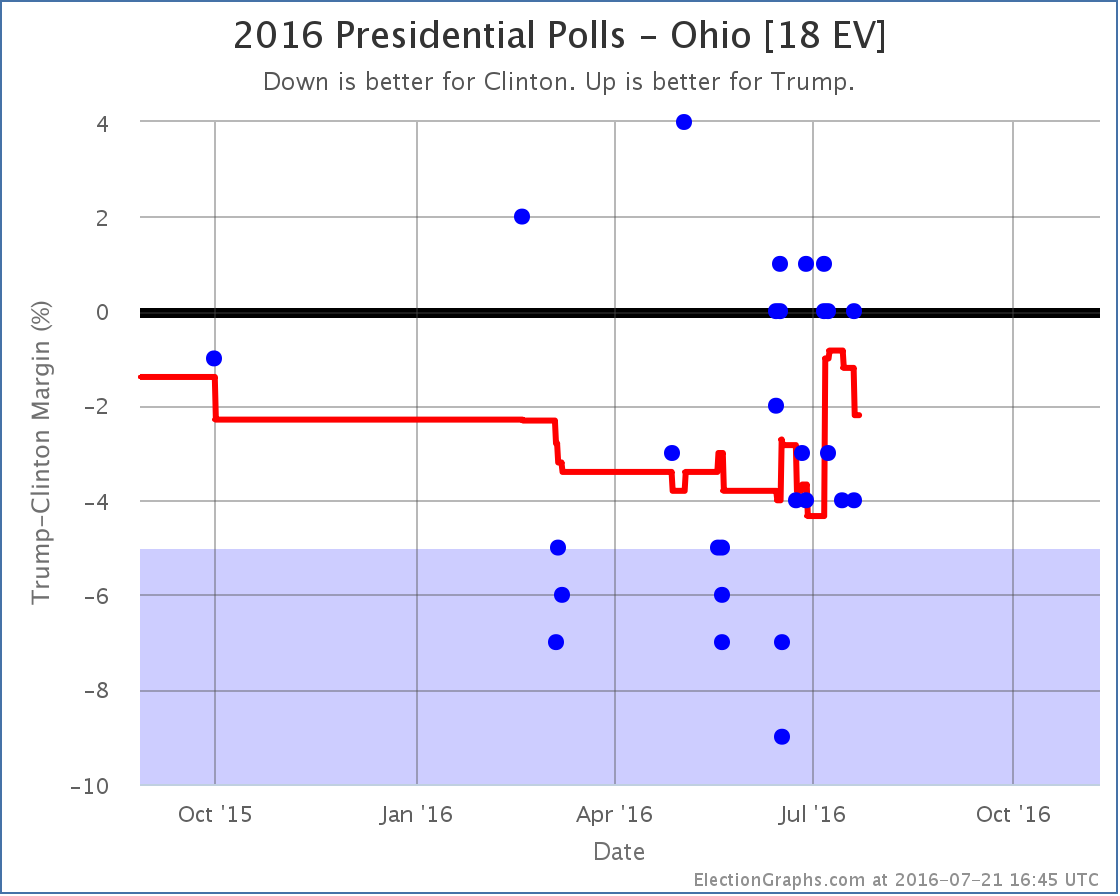
Ohio
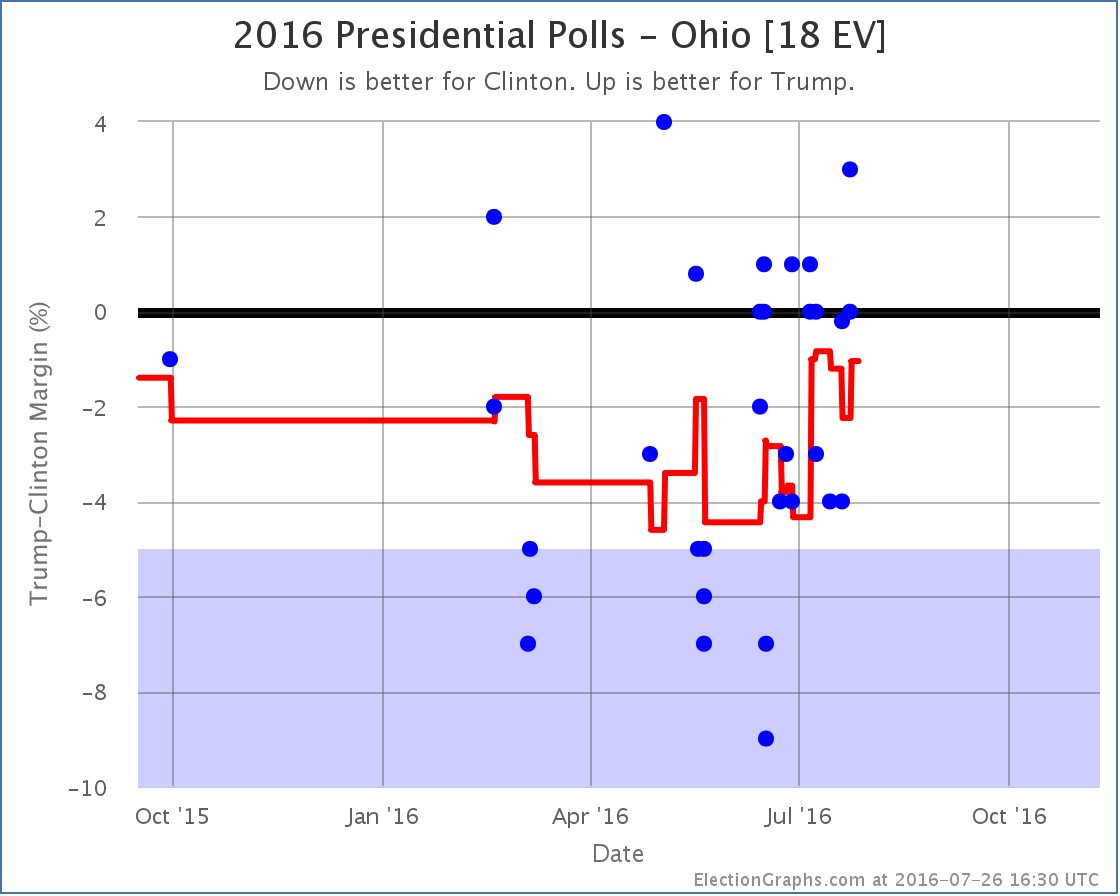
New results from PPP, which ARE from after the Republican convention move the average from a 2.2% Clinton lead in Ohio to a 1.0% lead. Either way, the state is “Weak Clinton”, but because Ohio was the tipping point, this impacts the tipping point:
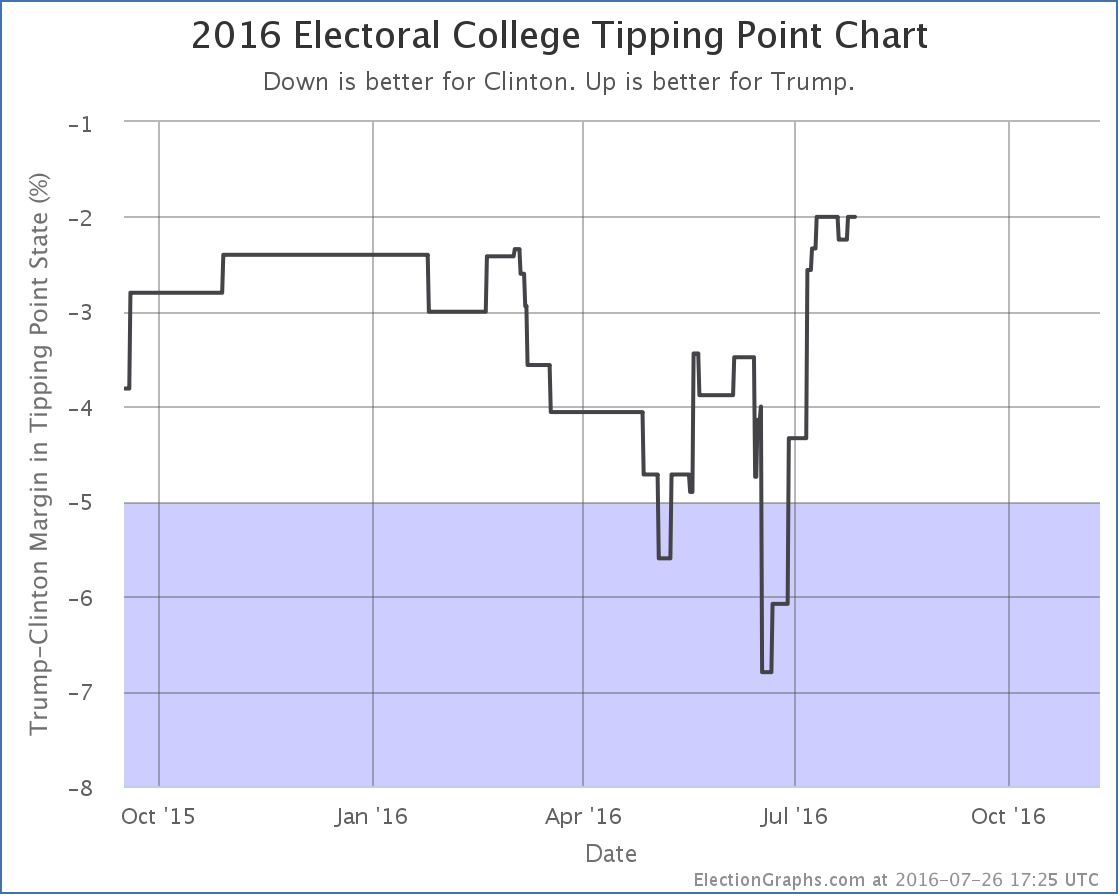
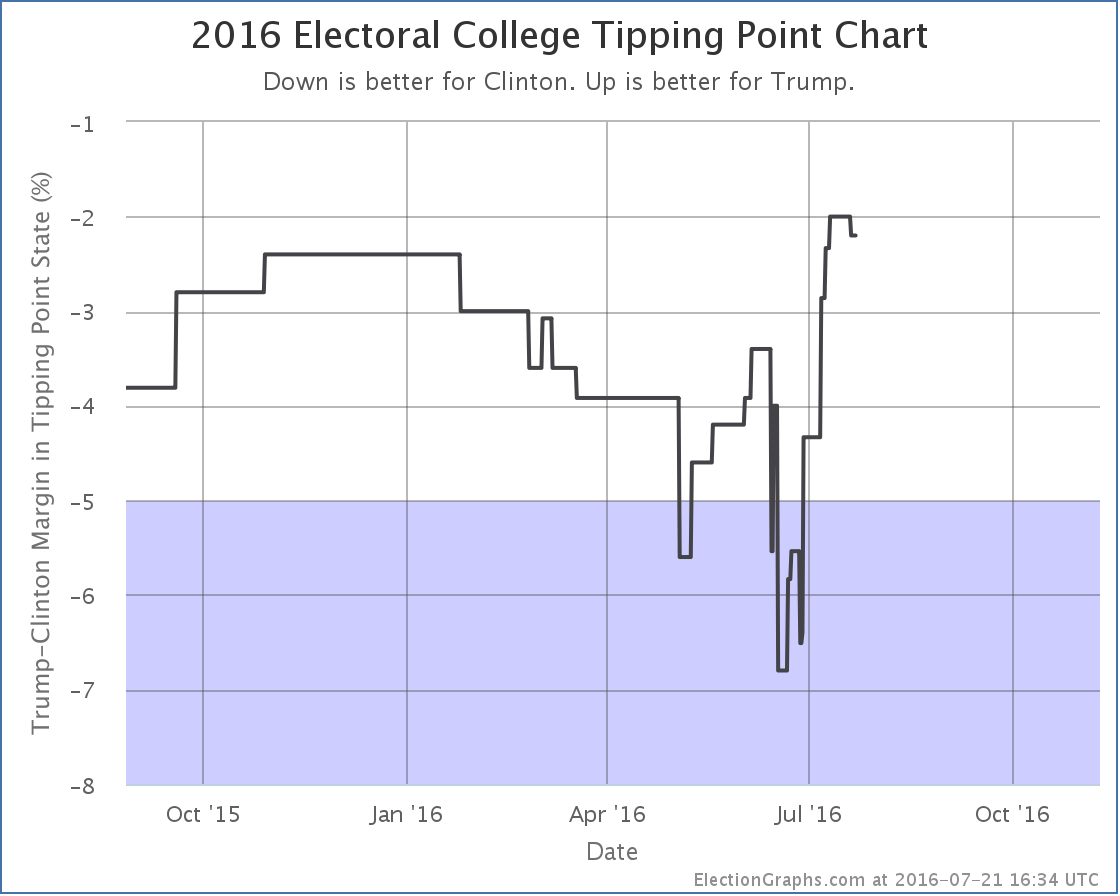
The tipping point moves from Clinton by 2.2% in Ohio to Clinton by 2.0% in Pennsylvania… so back to where it was right before the Republican National Convention started.
National View
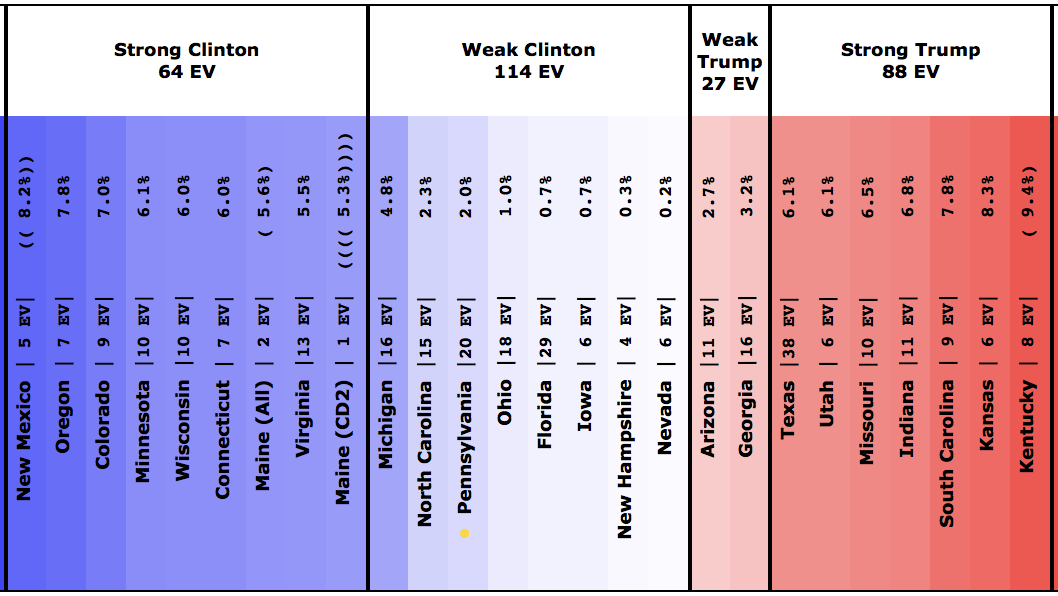
Looking at the center part of spectrum of states… only those where the margin is under 10%, we now have this:
And the map:
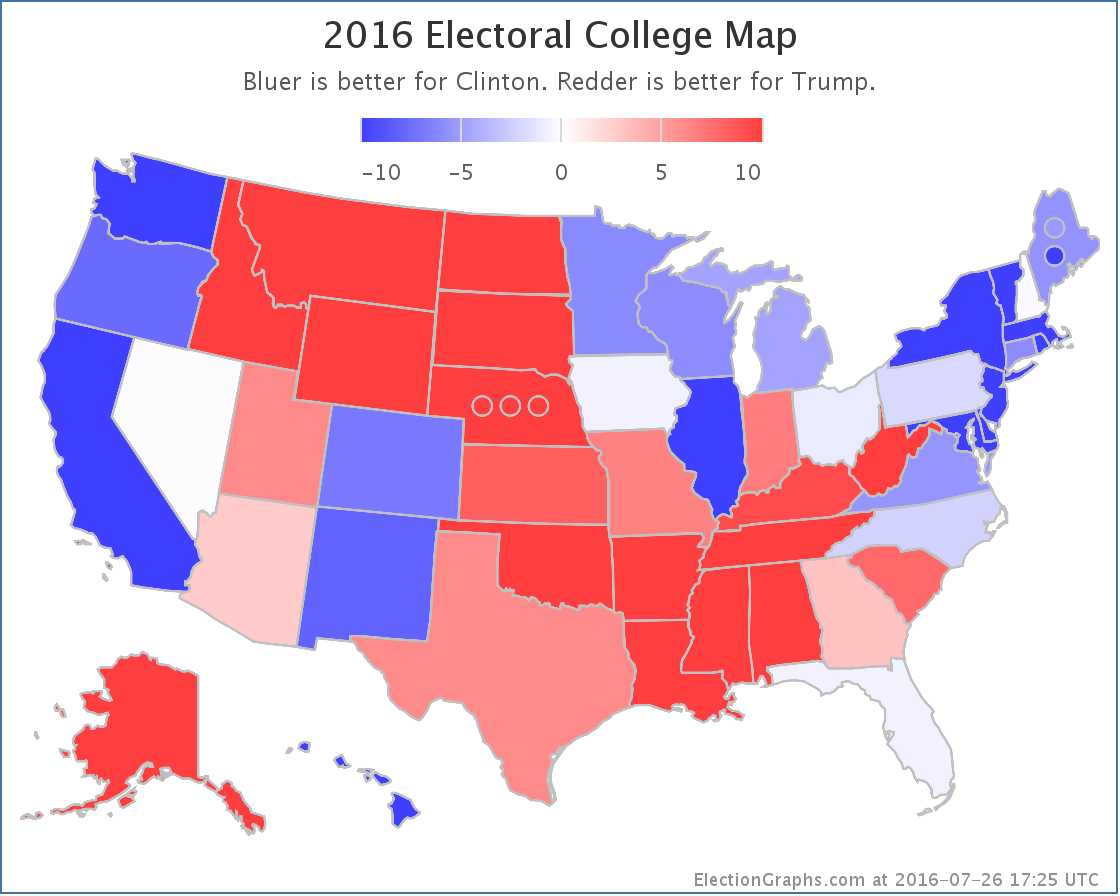
That is a lot of close or almost close states.
105.2 days until polls start to close on election day 2016.
Note: This post is an update based on the data on ElectionGraphs.com. Election Graphs tracks both a poll based estimate of the Electoral College and a numbers based look at the Delegate Races. All of the charts and graphs seen in this post are from that site. Additional graphs, charts and raw data can be found there. Follow @ElectionGraphs on Twitter or like Election Graphs on Facebook to see announcements of updates or to join the conversation. For those interested in individual general election poll updates, follow @ElecCollPolls on Twitter for all the polls as they are added. If you find the information in these posts interesting or useful, please consider visiting the tip jar.
States with new poll data since the last update: New Hampshire, Alabama, Illinois, Alaska, Arkansas, Arizona, California, Colorado, Connecticut, DC, District of Columbia, Delaware, Florida, Georgia, Hawaii, Iowa, Idaho, Indiana, Kansas, Kentucky, Louisiana, Massachusetts, Maryland, Maine, Michigan, Minnesota, Missouri, Mississippi, Montana, North Carolina, North Dakota, Nebraska, New Jersey, New Mexico, Nevada, New York, Ohio, Oklahoma, Oregon, Pennsylvania, Rhode Island, South Carolina, South Dakota, Tennessee, Texas, Utah, Virginia, Vermont, Washington, Wisconsin, West Virginia, Wyoming.
In addition to a handful of new polls, this batch of updates includes two sets of 50 states plus DC data from Morning Consult, one released in April covering January through March (with multiple candidate pairs), and another released in July covering April through June (covering only Clinton vs Trump). These span really long time periods and use a slightly different methodology than other polls, so I had initially not included them. But I was convinced by @hominidviews that I actually should include them, so they are now folded into the data.
In most cases, since the middates of the polling periods are fairly far in the past at this point, the addition of these polls only jiggled the lines around in the past rather than changing the situation as of today. Even in the sparsely polled states where these polls did change the average, categories did not generally change.
The one exception for Clinton vs Trump was Missouri:
Missouri
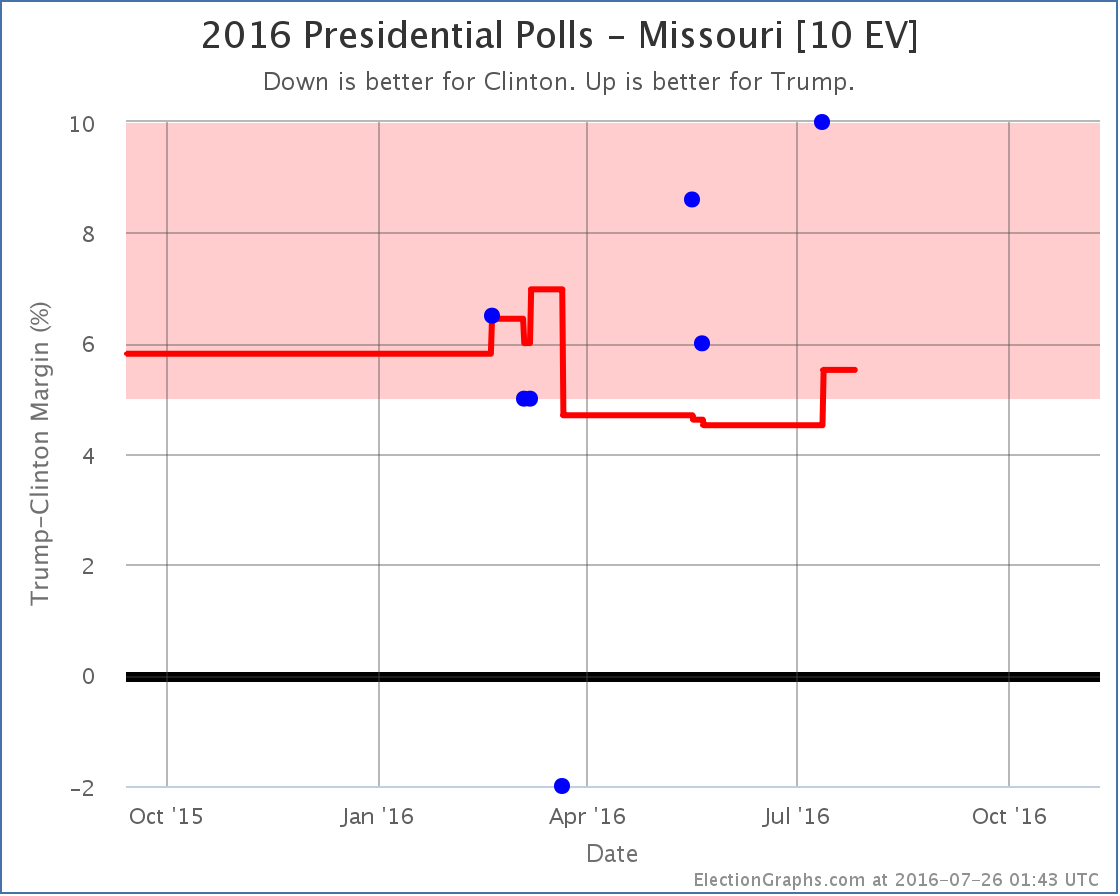
With the new Morning Consult poll centered in May added, the July PPP poll was enough to end Missouri’s time as a close state that was caused by a March DFM poll that now looks like a pretty clear outlier. So Missouri moves from “Weak Trump” to “Strong Trump” and it is therefore no longer listed as a possible pickup for Clinton.
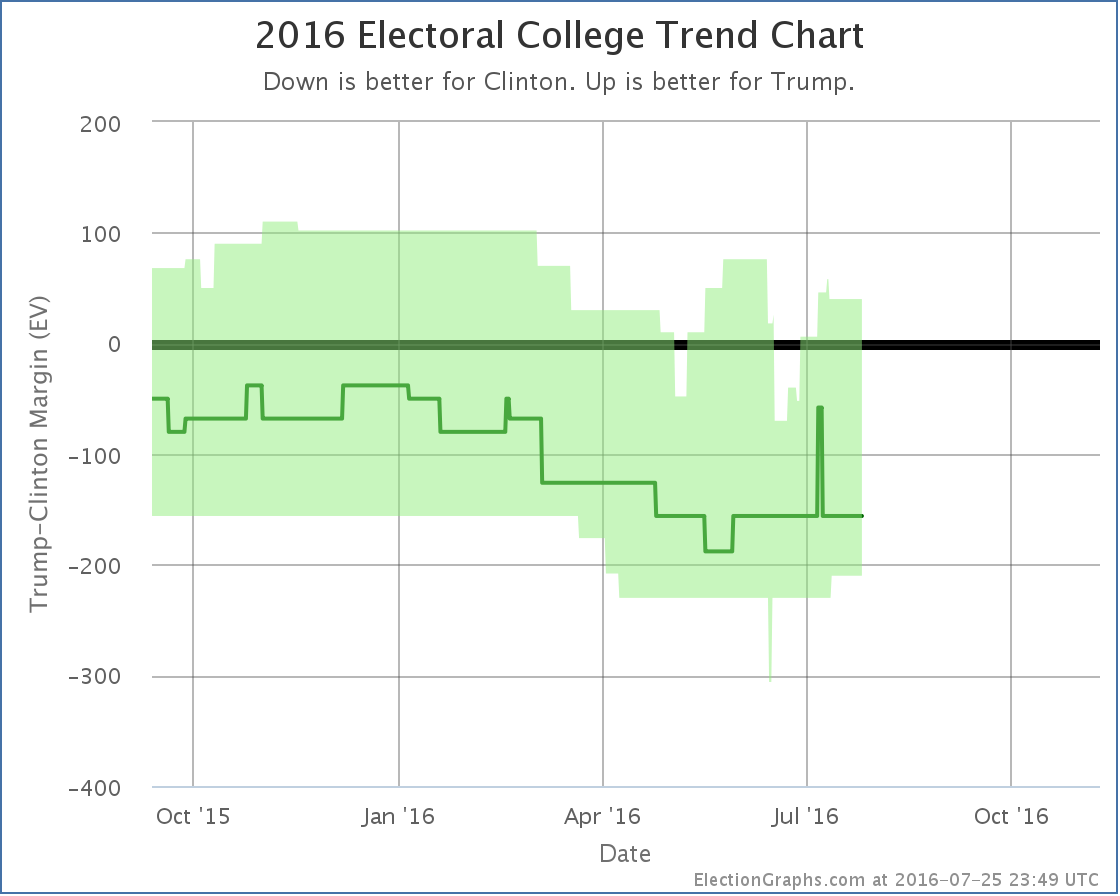
Back in the past, you can see a few new features added by the Morning Consult polls… a dip in the expected line for a little while in May where Clinton briefly was in the lead in Georgia, and a spike in Clinton’s best case where she got within 5% in Texas… for one day.
The only change that hasn’t already come and gone is the change in Missouri. Clinton’s best case goes from winning by 230 electoral votes down to winning by 210.
Note this is not part of any “convention bump”. This change is due to poll information from before the convention. There should be new polls added soon that will tell us more about the impact of the conventions. This is not that.
Clinton vs Cruz
Oh, and the Morning Consult data had some Clinton vs Cruz information as well. Since that combination is still one of the five best polled combinations, even though Cruz lost, I’ll note the changes: Kentucky went from Strong Cruz to Weak Cruz, and Minnesota went from Strong Clinton to Weak Clinton. So Clinton’s best case moved from winning by 188 to winning by 204, and Cruz’s best case went from winning by 30 to winning by 50.
Note: This post is an update based on the data on ElectionGraphs.com. Election Graphs tracks both a poll based estimate of the Electoral College and a numbers based look at the Delegate Races. All of the charts and graphs seen in this post are from that site. Additional graphs, charts and raw data can be found there. Follow @ElectionGraphs on Twitter or like Election Graphs on Facebook to see announcements of updates or to join the conversation. For those interested in individual general election poll updates, follow @ElecCollPolls on Twitter for all the polls as they are added. If you find the information in these posts interesting or useful, please consider visiting the tip jar.
States with new poll data since the last update: Virginia, Ohio, Iowa, Michigan, Connecticut, Illinois, Idaho, New York.
We have the first state poll that includes data after the start of the Republican National Convention, covering Monday through Wednesday of the convention week. It is for Ohio, and it moves the poll average… toward Clinton.
This move does not change the status of Ohio. It was Weak Clinton before and it Weak Clinton now. But it does change the tipping point, which also moves toward Clinton.
The tipping point moved from a 2.0% Clinton lead in Pennsylvania to a 2.2% Clinton lead in Ohio.
So, aren’t we supposed to be seeing a convention bump for Trump? What’s up with a move toward Clinton during Trump’s convention?
The widespread view at this point is that the Republican Convention has been undisciplined and off message. It is tempting to look at this and start thinking about an “anti-bump” due to a botched convention.
That is premature. One poll in one state moved the average in that state a little, which because that state was near the tipping point also moved that a little bit… by 0.2%. There is not enough here to call a trend. If we saw a number of additional moves in this direction then maybe… but right now, it is just a single small move in isolation.
With the two conventions back to back, it is unlikely we will be able to detect a clear bump pattern for the two conventions individually. Instead, once both conventions are over, and there have been a week or two of post-convention polls, we’ll be able to get a sense if there has been a noticeable impact from the conventions.
In the mean time, we will of course keep watching for any trends that do emerge.
110.0 days until polls start to close on election night…
Note: This post is an update based on the data on ElectionGraphs.com. Election Graphs tracks both a poll based estimate of the Electoral College and a numbers based look at the Delegate Races. All of the charts and graphs seen in this post are from that site. Additional graphs, charts and raw data can be found there. Follow @ElectionGraphs on Twitter or like Election Graphs on Facebook to see announcements of updates or to join the conversation. For those interested in individual general election poll updates, follow @ElecCollPolls on Twitter for all the polls as they are added. If you find the information in these posts interesting or useful, please consider visiting the tip jar.
States with new poll data since the last update: Colorado, Florida, North Carolina, Virginia, Kansas, Missouri
Florida is close. Less than a week ago Trump took the lead for the first time since March.
With the latest polls, Clinton once again has a narrow lead.
With close states, do not be surprised if they go back and forth across the line.
With a big state like Florida, this can cause big fluctuations in the electoral college picture:
So we now have a big spike where Trump very very briefly led narrowly in both Florida and Pennsylvania. Then later polls almost immediately reversed those gains.
We are now back at Clinton 347 to Trump 191 in the “expected case” where everybody just wins all the states they are ahead in. This is a familiar place to be.
The Republican convention starts in 2.0 days. The Democratic convention in 9.1 days. It will probably take until at least a week after both conventions are over, maybe even two or three weeks, to fully know if there have been any enduring changes due to the conventions. So be patient.
Historically, conventions produce short term “bounces” that are fairly transient. They may even be too short to see on a state by state basis. But if any longer lasting changes happen, you’ll see them here.
115.3 days until polls start to close.
Note: This post is an update based on the data on ElectionGraphs.com. Election Graphs tracks both a poll based estimate of the Electoral College and a numbers based look at the Delegate Races. All of the charts and graphs seen in this post are from that site. Additional graphs, charts and raw data can be found there. Follow @ElectionGraphs on Twitter or like Election Graphs on Facebook to see announcements of updates or to join the conversation. For those interested in individual general election poll updates, follow @ElecCollPolls on Twitter for all the polls as they are added. If you find the information in these posts interesting or useful, please consider visiting the tip jar.
|
|