This is the website of Abulsme Noibatno Itramne (also known as Sam Minter).
Posts here are rare these days. For current stuff, follow me on Mastodon
|
States with new poll data added since the last update: All 50 states, DC, and the Maine congressional districts
Notable changes in: Arizona, Indiana, Maine (CD2), and the tipping point
National Summary
At this point we have many polls that are fully or partially after the “Trump Tape” release on the 7th, but this batch of polls still included many where most of the time in the field was before that. And of course the state averages here are based on at least the last five polls in each state, so reach even further back in time. The close states tend to be based on polls with middates going back 1-3 weeks.
All that is to say that the changes we are seeing now are starting to include the fallout from that event, but haven’t yet fully factored it in.
With that out of the way, the changes for this round:
- The expected result moves from Clinton by 176 EV to Clinton by 154 EV
- The tipping point moves from Clinton by 5.9% in MN to Clinton by 6.5% in PA
- Clinton’s best case improves from winning by 202 EV to winning by 226 EV
So wait, the expected result moved toward Trump! Why is the title of this post about Trump’s drop continuing?
Well, basically because the improvement in the expected case is a result of Arizona moving from just barely Clinton, to just barely Trump. Either way it is really too close to call. It may flip back again with the next update. Or maybe it won’t.
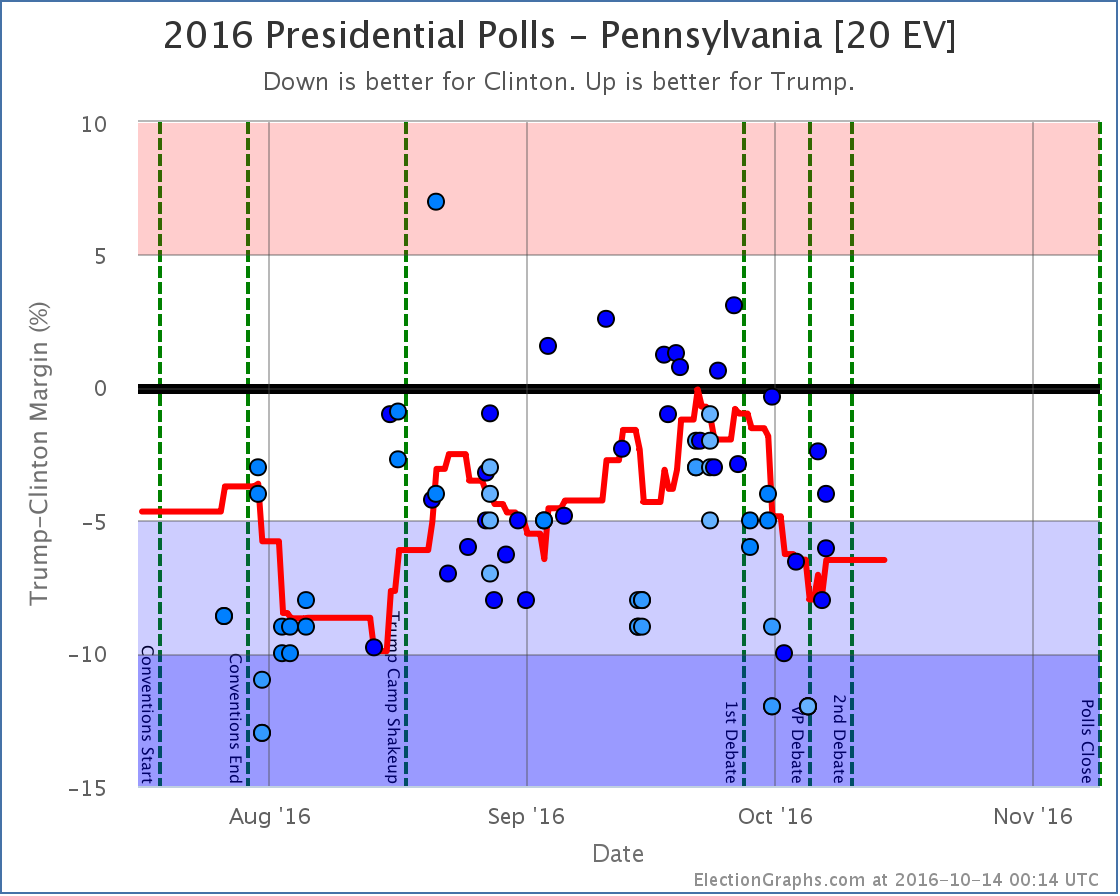
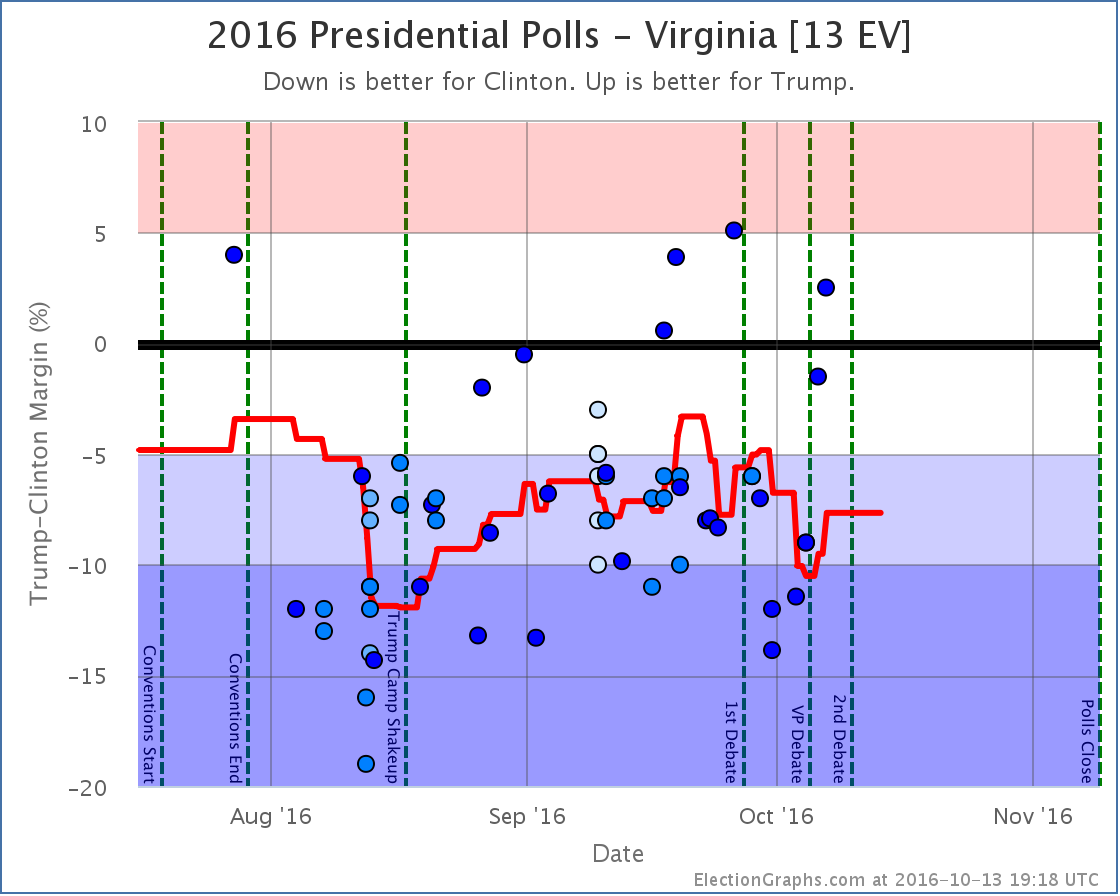
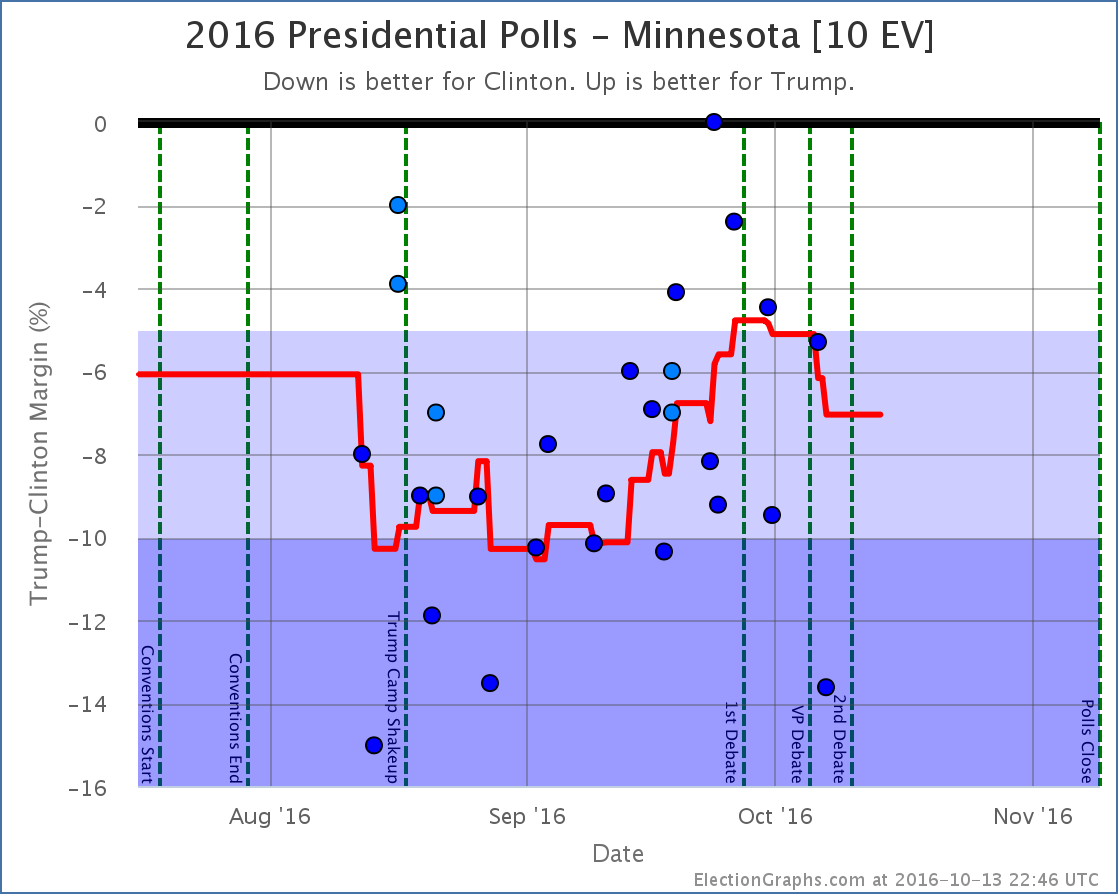
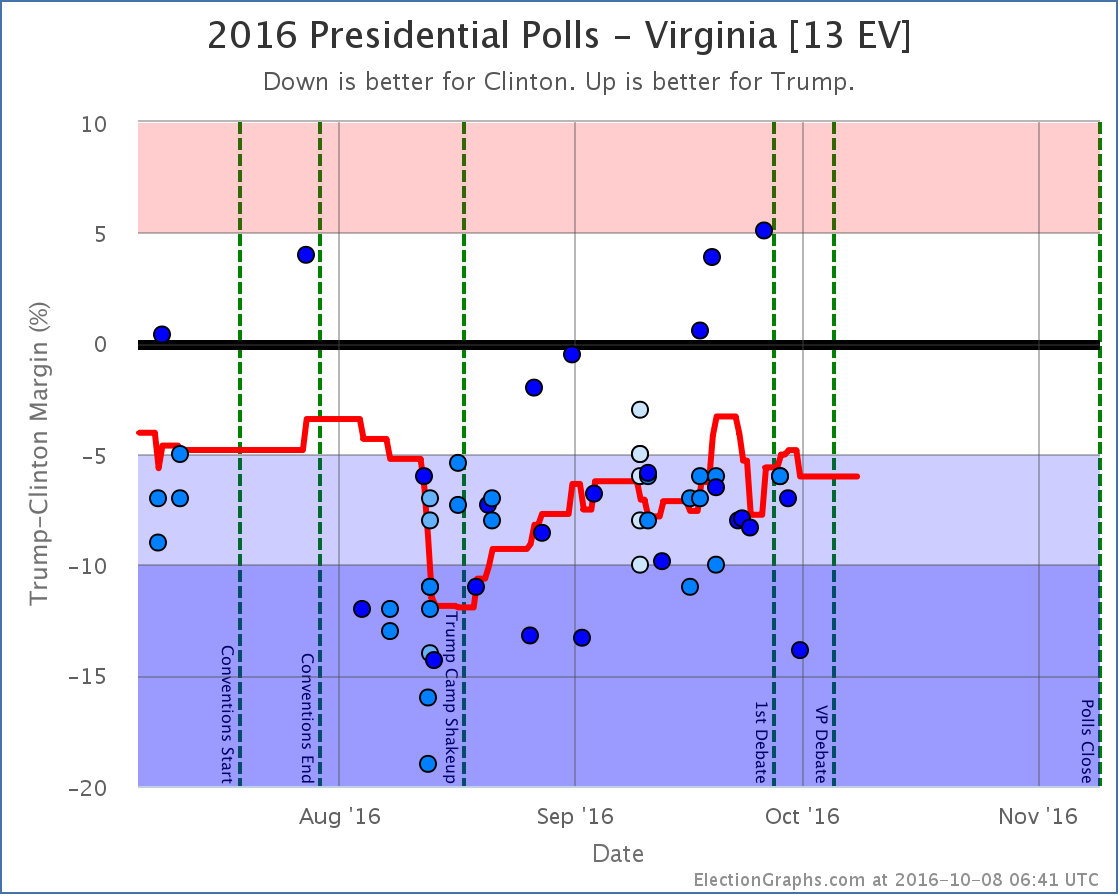
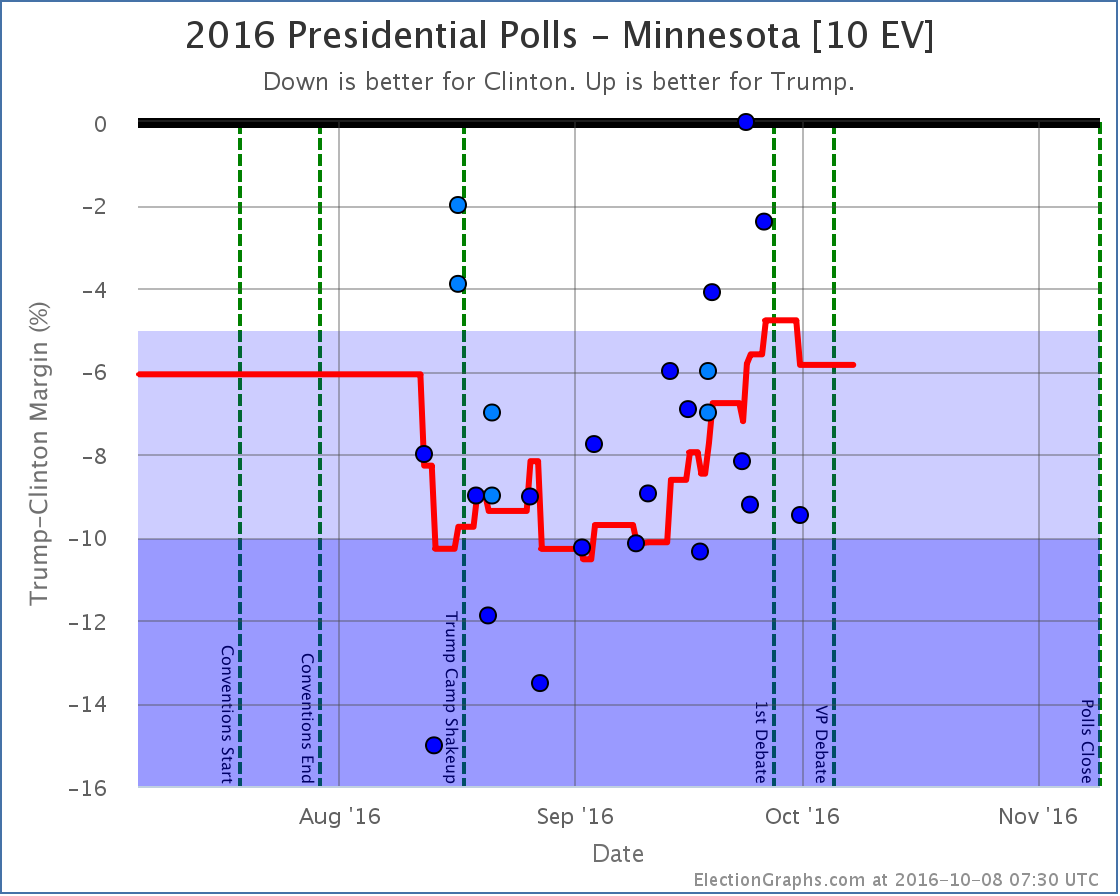
But meanwhile, polling changes in Minnesota, Virginia, and Pennsylvania moved the tipping point further toward Clinton, meaning that overall Trump has to move polls even further in order to actually flip the results of the election.
And Clinton expanded her best case a bit as well.
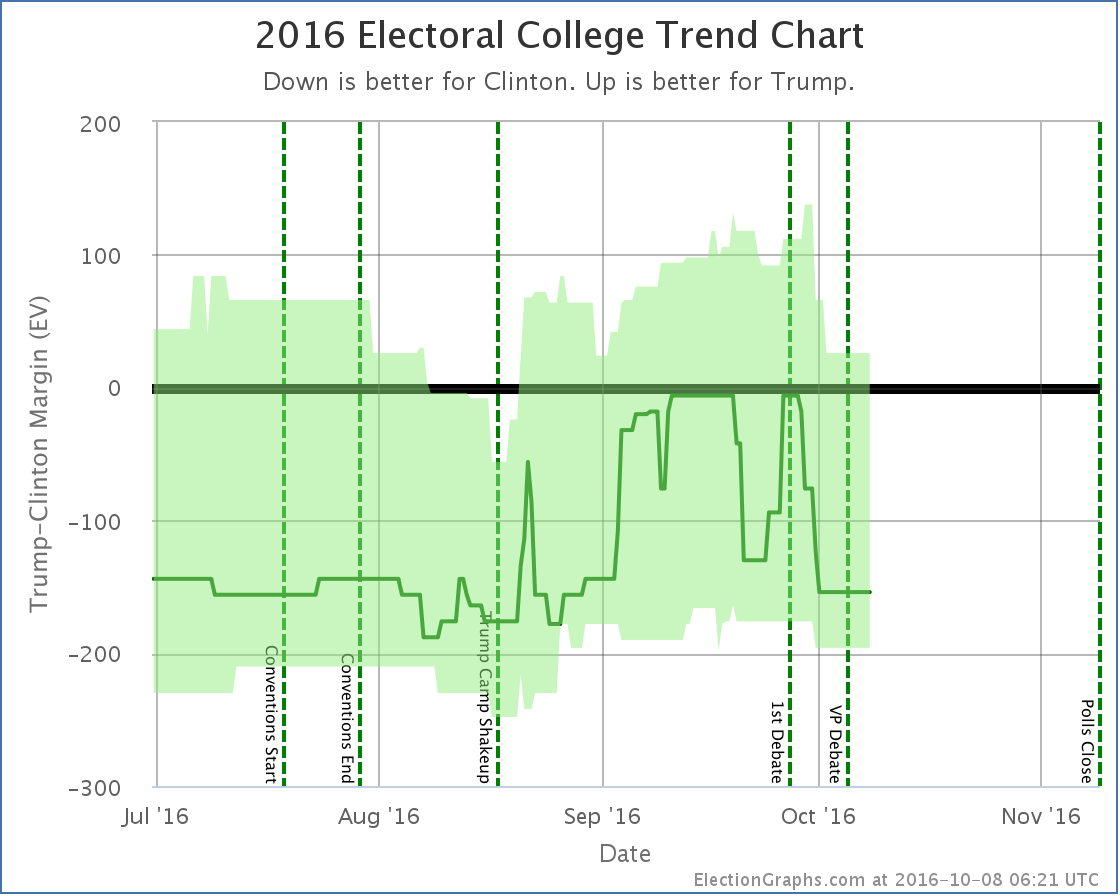
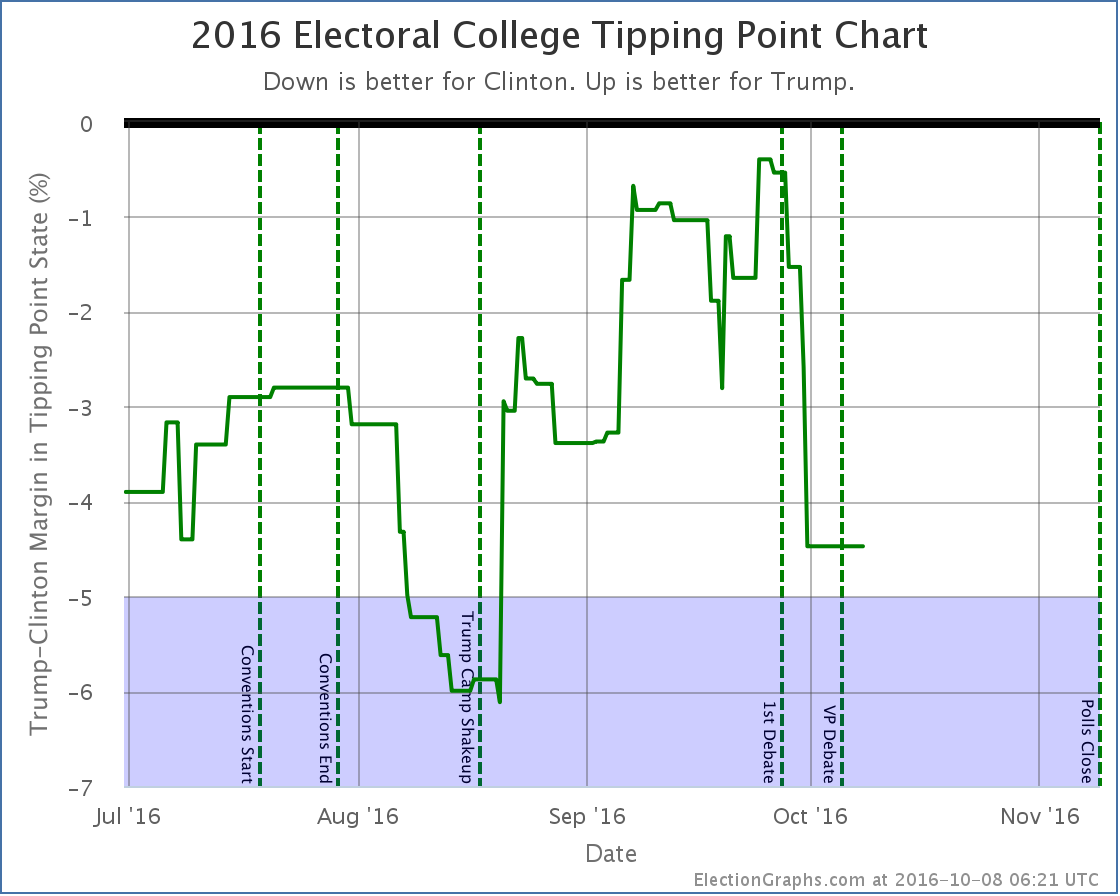
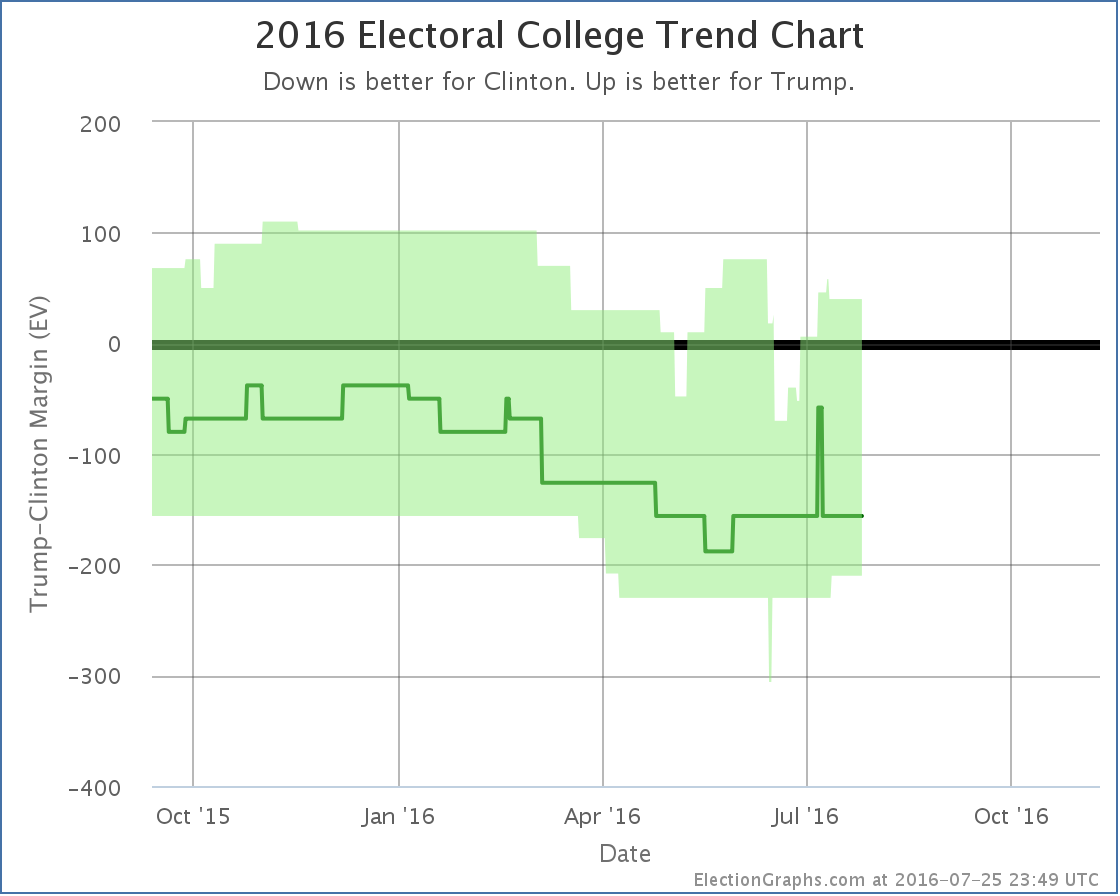
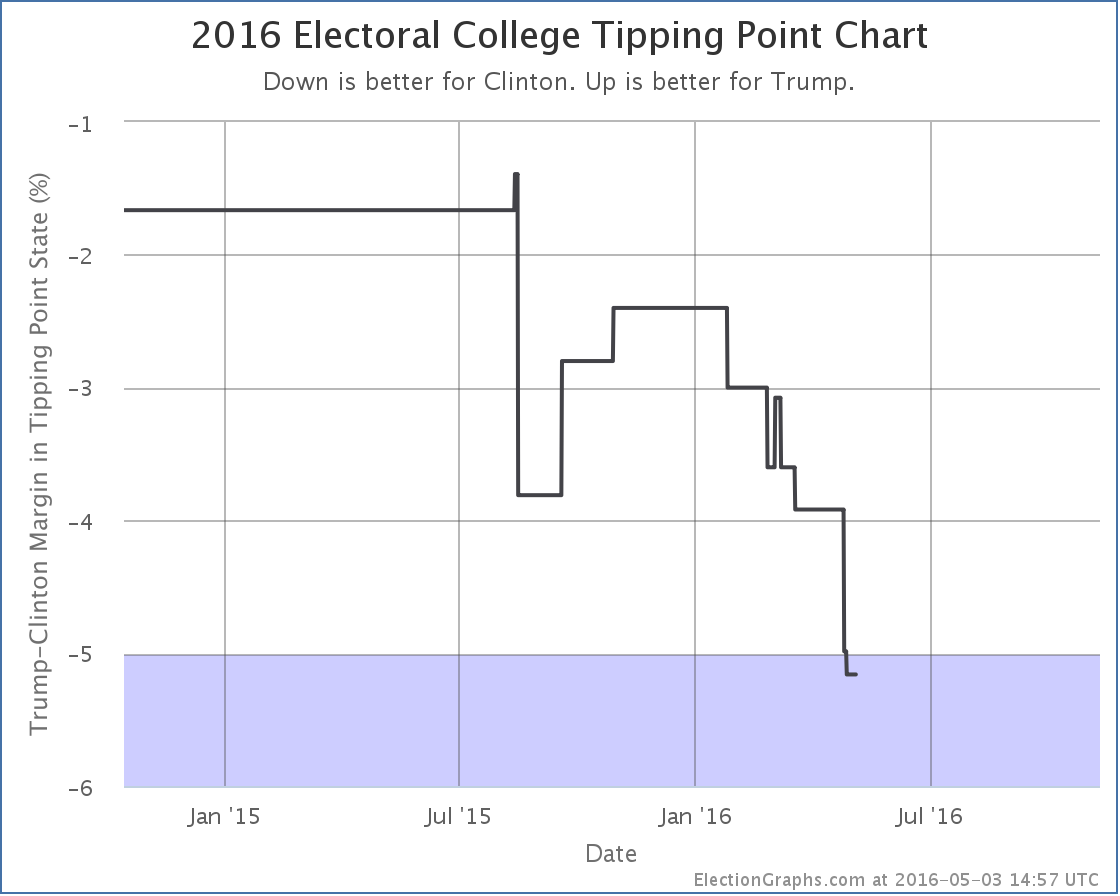
Here are the charts:
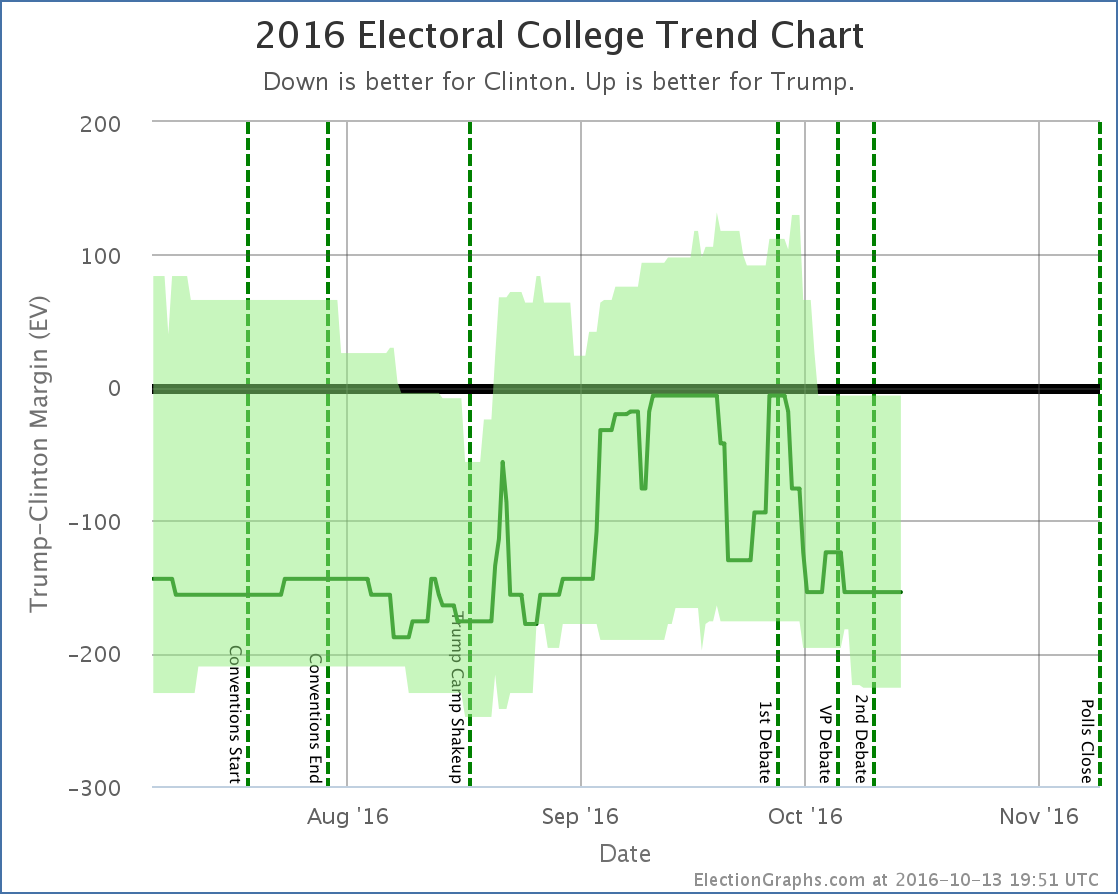
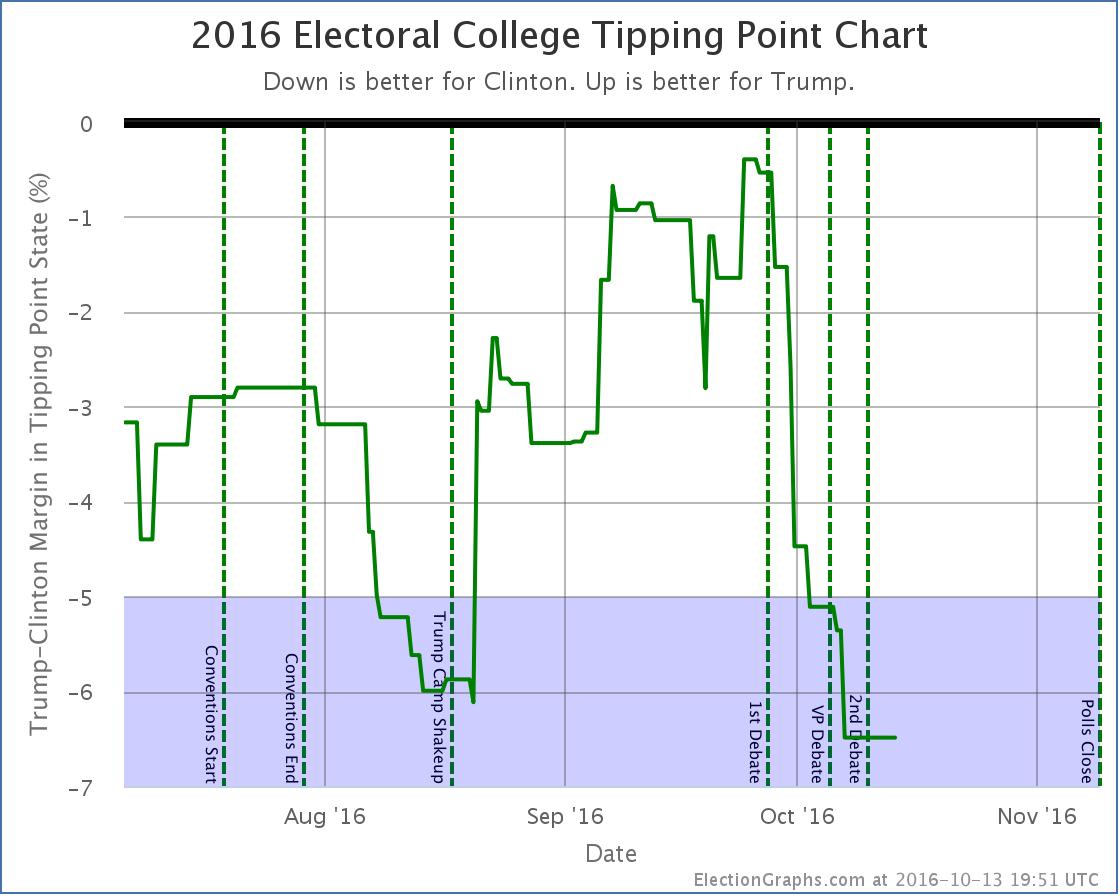
The trend in both charts is clear. After peaking right before the 1st debate Trump has been falling. This is more dramatic in the tipping point chart, but it is clear no matter which way you look at the race.
There is no time left for a Trump comeback from behind win from these levels. It would take something massive that would completely reverse everything we know about this race so far. It would be an unprecedented reversal. Impossible? No. Incredibly unlikely? Yes.
A few weeks ago Trump had managed to make this race close. But it was short-lived. Starting with the debate he has been dropping steadily. We don’t yet have signs that we have hit bottom either. There have been new negative stories about Trump almost every day. Further drops would not be surprising.
We’re no longer really talking about who will win this election. Clinton will win this election. The only question is by how much.
25.8 days left until we have the first actual election results.
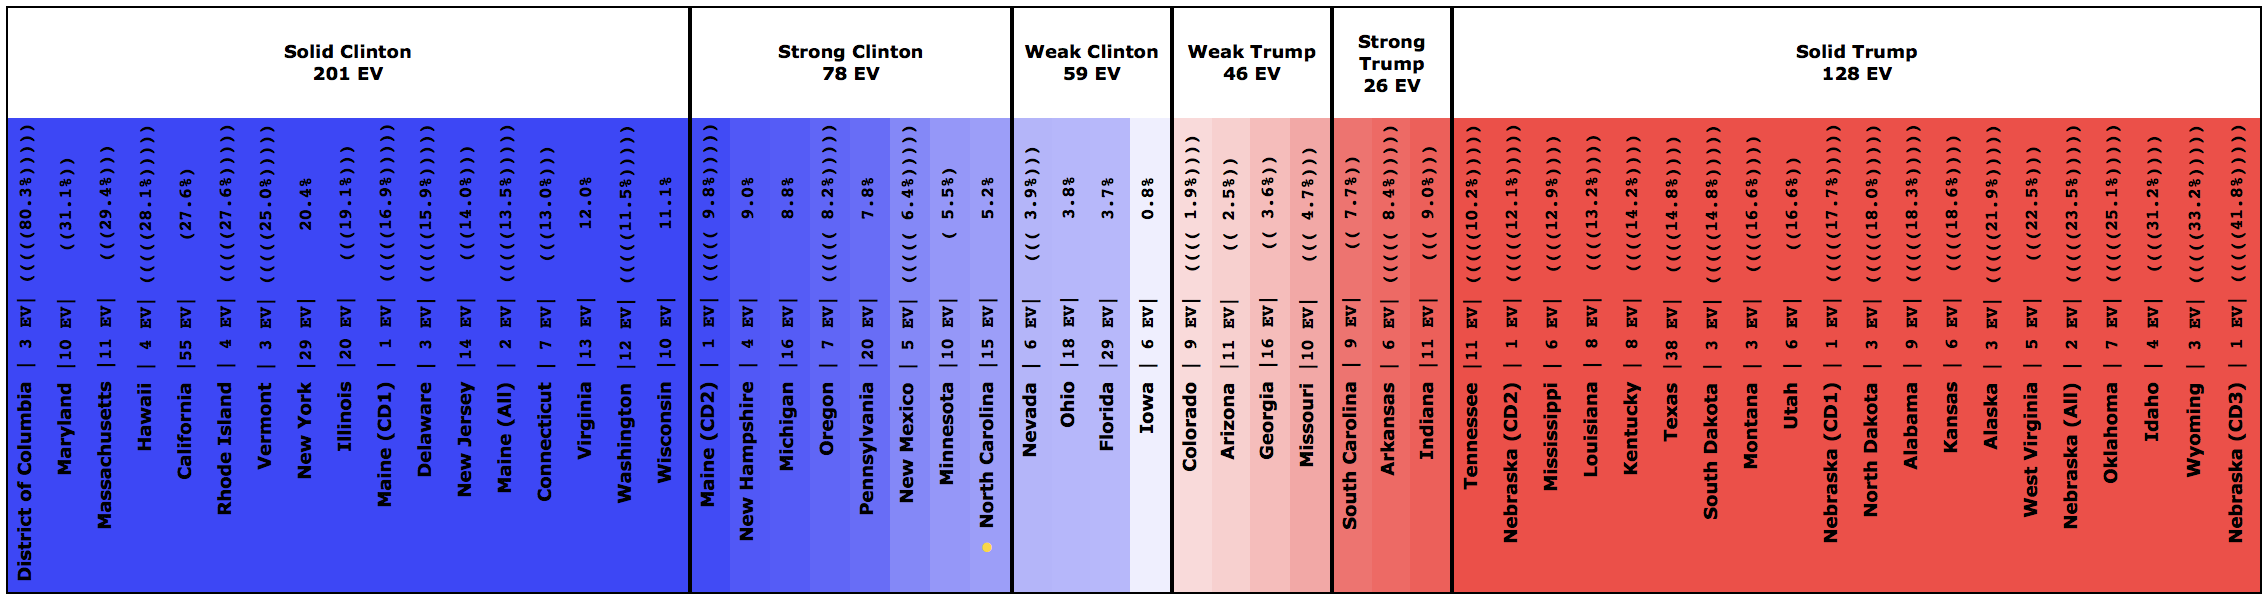
State Details
Weak Clinton to Weak Trump
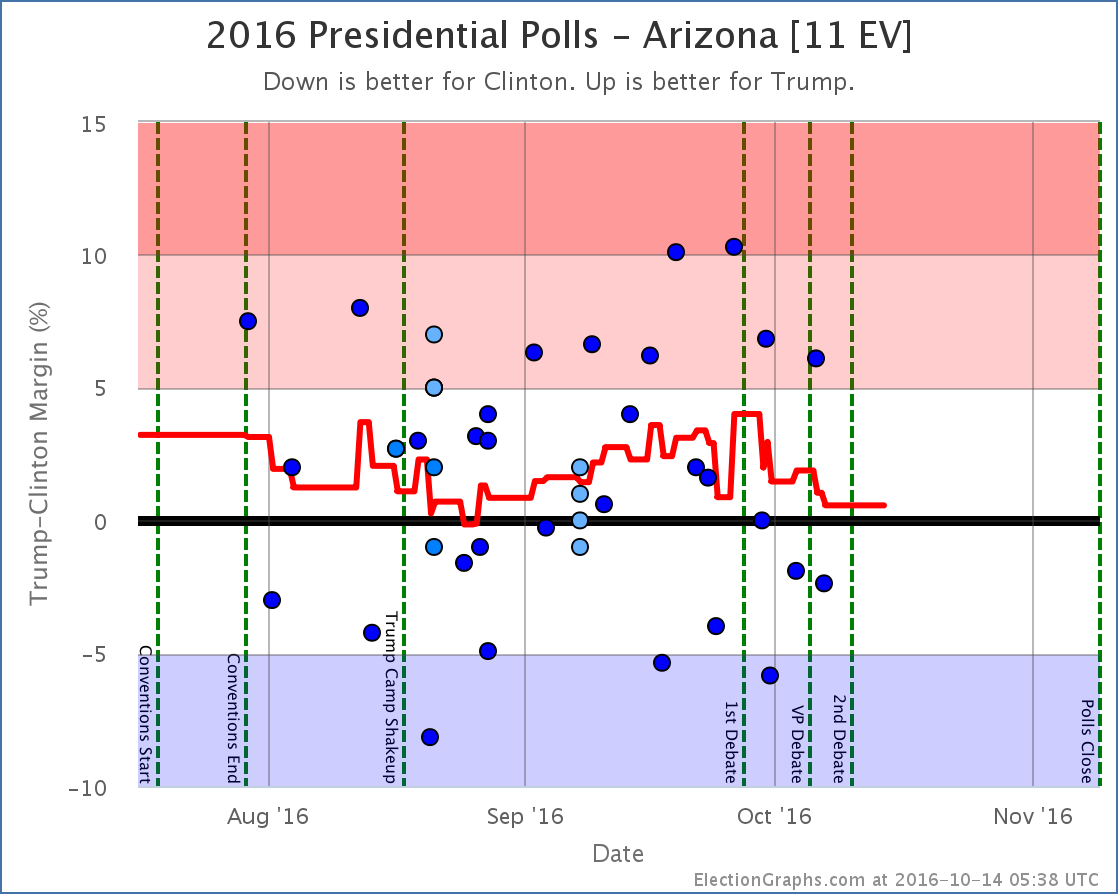
The latest polls not only move Arizona from Weak Clinton to Weak Trump, but since older polls were added, they actually moved the past curve Trumpward, such that we no longer have a recent period with Clinton in the lead at all. The trend has still been away from Trump toward Clinton since the 1st debate, but Clinton hasn’t pulled Arizona over to her side quite yet.
Moving into Clinton’s reach
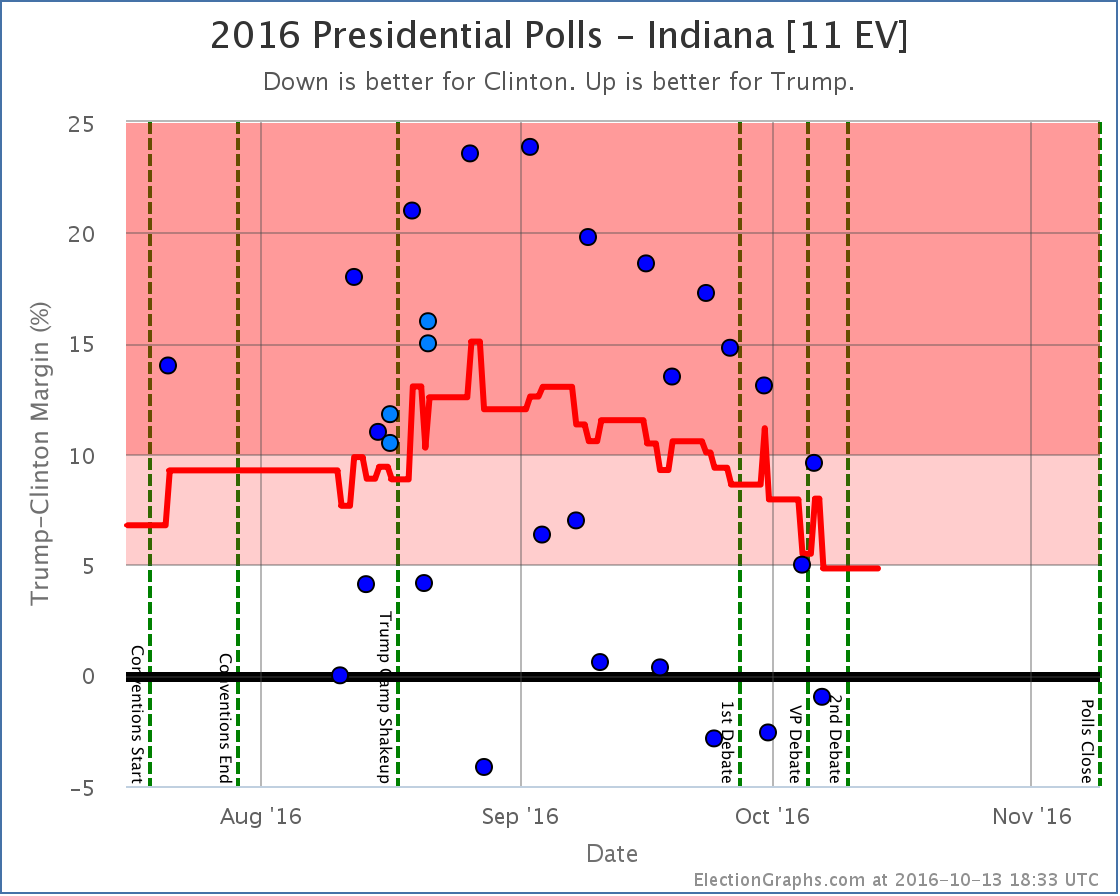
Trump’s lead in Indiana has been diminishing since late August. With the latest updates Trump is up 4.8%. Trump still leads, but it is now close enough that a Clinton win does not seem impossible. Still a stretch to be sure, but no longer unimaginable.
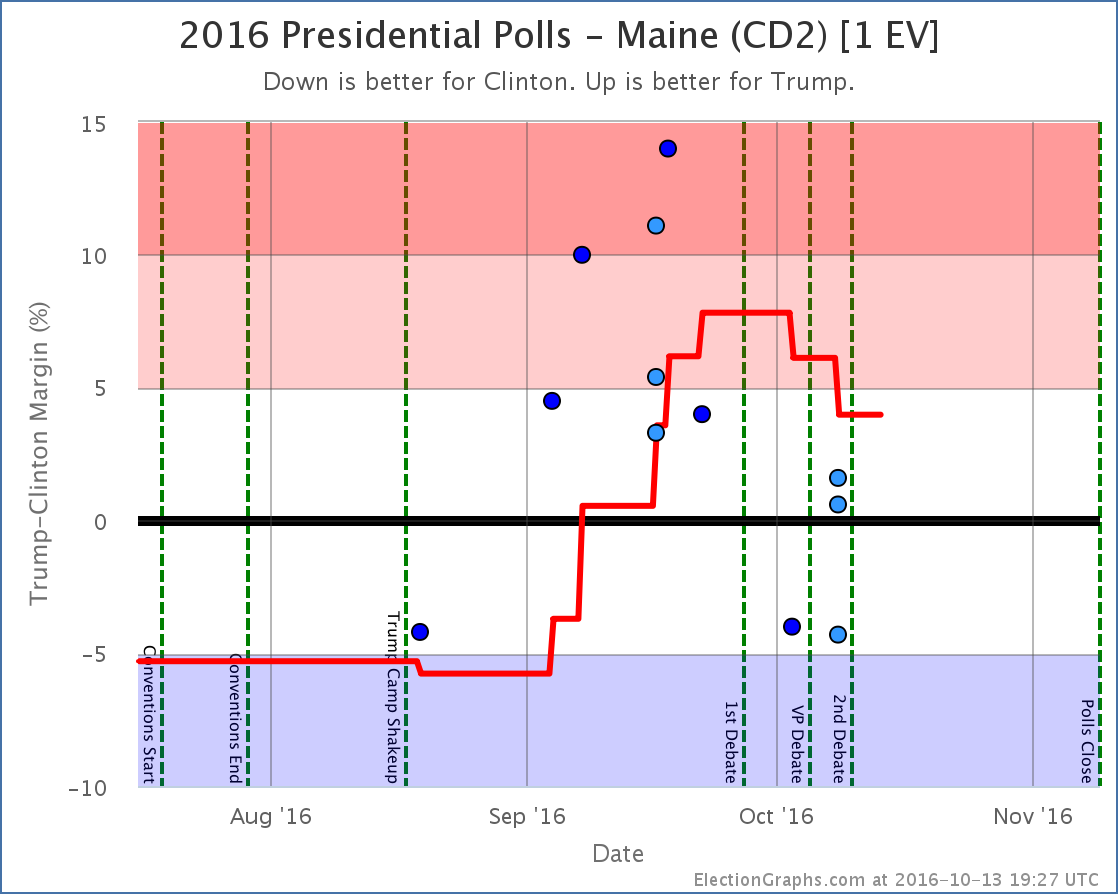
Maine’s 2nd congressional district had looked like it would definitely split from the state this cycle giving Trump a somewhat unusual pickup. With the post-debate polls, Trump still leads, but his lead is slipping, and so it now seems that this single electoral vote is now up for grabs. Clinton could steal it back.
States that moved the tipping point
For more information…
This post is an update based on the data on ElectionGraphs.com. Election Graphs tracks both a poll based estimate of the Electoral College and a numbers based look at the Delegate Races. All of the charts and graphs seen in this post are from that site. Additional graphs, charts and raw data can be found there. Follow @ElectionGraphs on Twitter or like Election Graphs on Facebook to see announcements of updates or to join the conversation. For those interested in individual general election poll updates, follow @ElecCollPolls on Twitter for all the polls as they are added. If you find the information in these posts interesting or useful, please consider visiting the tip jar.
States with new poll data added since the last update: All of them. Multiple times. There are additional new polls since I had to cut things off for this update as well. Those will be in the next update.
National Summary
The last week of polls has been devastating to Trump’s position. In the last update we were just starting to see the reaction from the first debate. With this batch the post-debate polling continued to roll in, and while there were a couple of minor moves toward Trump, the net change in this update was a dramatic move toward Clinton:
- The expected result moved from Clinton by 6 electoral votes to Clinton by 154 electoral votes
- The tipping point moved from Clinton by 2.1% in CO to Clinton by 4.5% in MI
- Trump’s best case moved from a 60 EV win to a 26 EV win
- Clinton’s best case moved from a 208 EV win to a 196 EV win
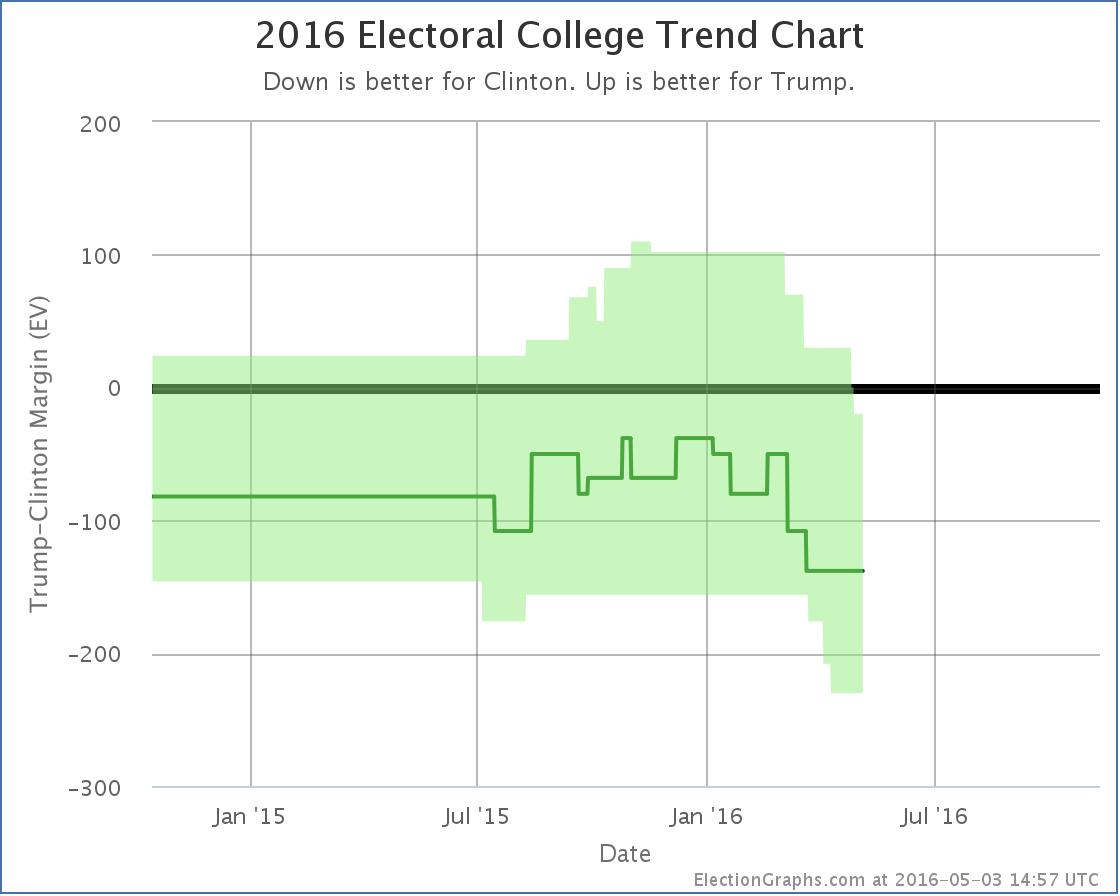
Looking at the charts:
The previous update mentioned some Trump losses starting a week or two before the debate. With a lot more polls filling in the time period right before the debate as well as right after, it now looks like those losses were reversed before the debate.
In the time after the debate though, all three indicators on the chart have moved in Clinton’s direction. The race is now essentially back to where it was at the beginning of September. We’re not yet back at Clinton’s high point from August, but it is getting close.
The tipping point chart is even more stark. As with the electoral college view, it looks like Trump’s mid-September declines were reversed by debate time, but after the debate everything falls off a cliff. Most of Trump’s gains from August and September are gone. Right before the debate he topped out with Clinton only ahead in the tipping point metric by 0.4%.
Clinton now leads by 4.5%. The tipping point state is Michigan. Clinton only has to increase her lead slightly there to not just take Michigan out of reach for Trump, but the Presidency.
What we are seeing in the polling results right now at this point probably fully factors in the debate itself. But we are just starting to see the impact from Trump’s “worst week in presidential campaign history ” that started with the debate, continued with his attacks on Alicia Machado, and ended with the leak of some of his tax information. The events of that week are not yet fully baked in.
And of course, the polls do not yet reflect the VP debate, or more importantly, the 2005 Trump video that was leaked on Friday. It is hard to imagine the events of the last few days NOT having an impact on the polls.
And the next debate is coming up. It should be interesting. If you were not planning on tuning in before, change your plans.
31.7 days left until the first actual election results start coming in.
State Details
A lot of states moved in order to produce the summary results above. For those interested in looking at the state by state details, they are below:
Weak Trump to Weak Clinton
Moving out of reach for Trump
Moving out of reach for Clinton
Moving into reach for Trump
States that changed categories but then moved right back again
For more information…
This post is an update based on the data on ElectionGraphs.com. Election Graphs tracks both a poll based estimate of the Electoral College and a numbers based look at the Delegate Races. All of the charts and graphs seen in this post are from that site. Additional graphs, charts and raw data can be found there. Follow @ElectionGraphs on Twitter or like Election Graphs on Facebook to see announcements of updates or to join the conversation. For those interested in individual general election poll updates, follow @ElecCollPolls on Twitter for all the polls as they are added. If you find the information in these posts interesting or useful, please consider visiting the tip jar.
States with new poll data since the last update: New Hampshire, Alabama, Illinois, Alaska, Arkansas, Arizona, California, Colorado, Connecticut, DC, District of Columbia, Delaware, Florida, Georgia, Hawaii, Iowa, Idaho, Indiana, Kansas, Kentucky, Louisiana, Massachusetts, Maryland, Maine, Michigan, Minnesota, Missouri, Mississippi, Montana, North Carolina, North Dakota, Nebraska, New Jersey, New Mexico, Nevada, New York, Ohio, Oklahoma, Oregon, Pennsylvania, Rhode Island, South Carolina, South Dakota, Tennessee, Texas, Utah, Virginia, Vermont, Washington, Wisconsin, West Virginia, Wyoming.
In addition to a handful of new polls, this batch of updates includes two sets of 50 states plus DC data from Morning Consult, one released in April covering January through March (with multiple candidate pairs), and another released in July covering April through June (covering only Clinton vs Trump). These span really long time periods and use a slightly different methodology than other polls, so I had initially not included them. But I was convinced by @hominidviews that I actually should include them, so they are now folded into the data.
In most cases, since the middates of the polling periods are fairly far in the past at this point, the addition of these polls only jiggled the lines around in the past rather than changing the situation as of today. Even in the sparsely polled states where these polls did change the average, categories did not generally change.
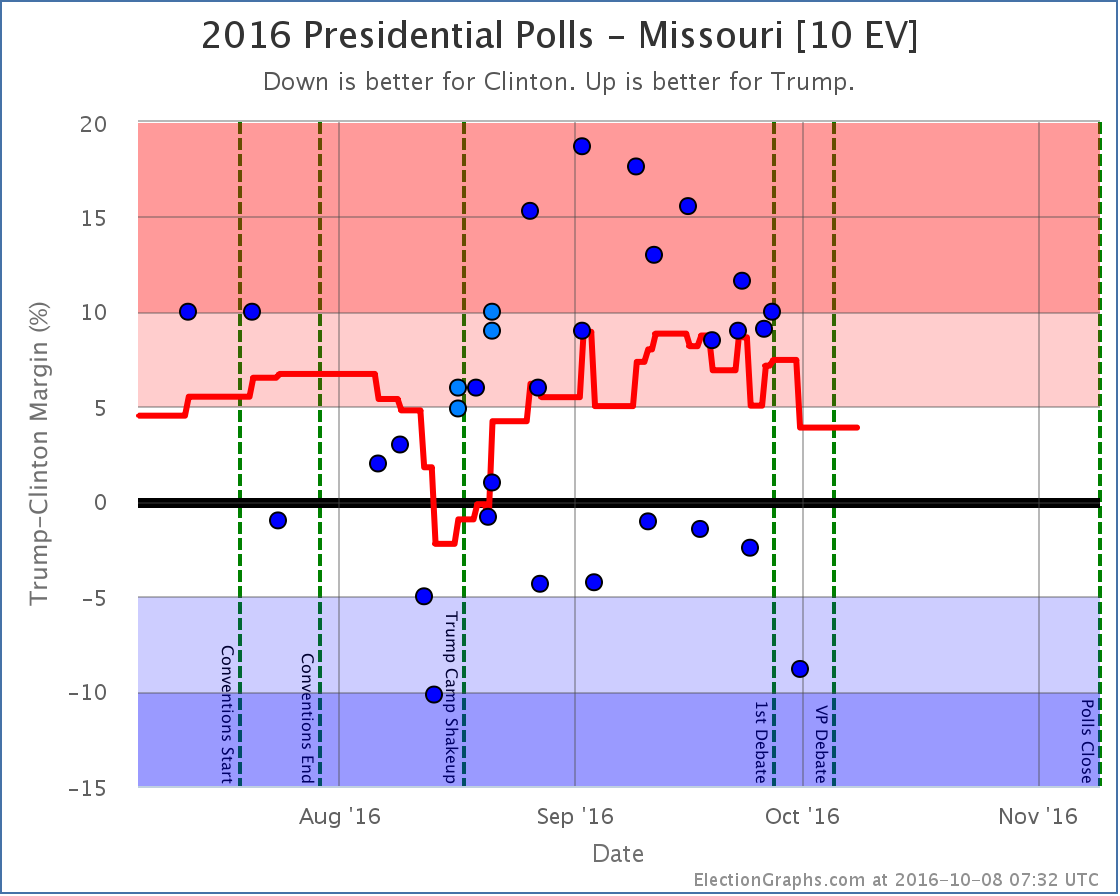
The one exception for Clinton vs Trump was Missouri:
Missouri
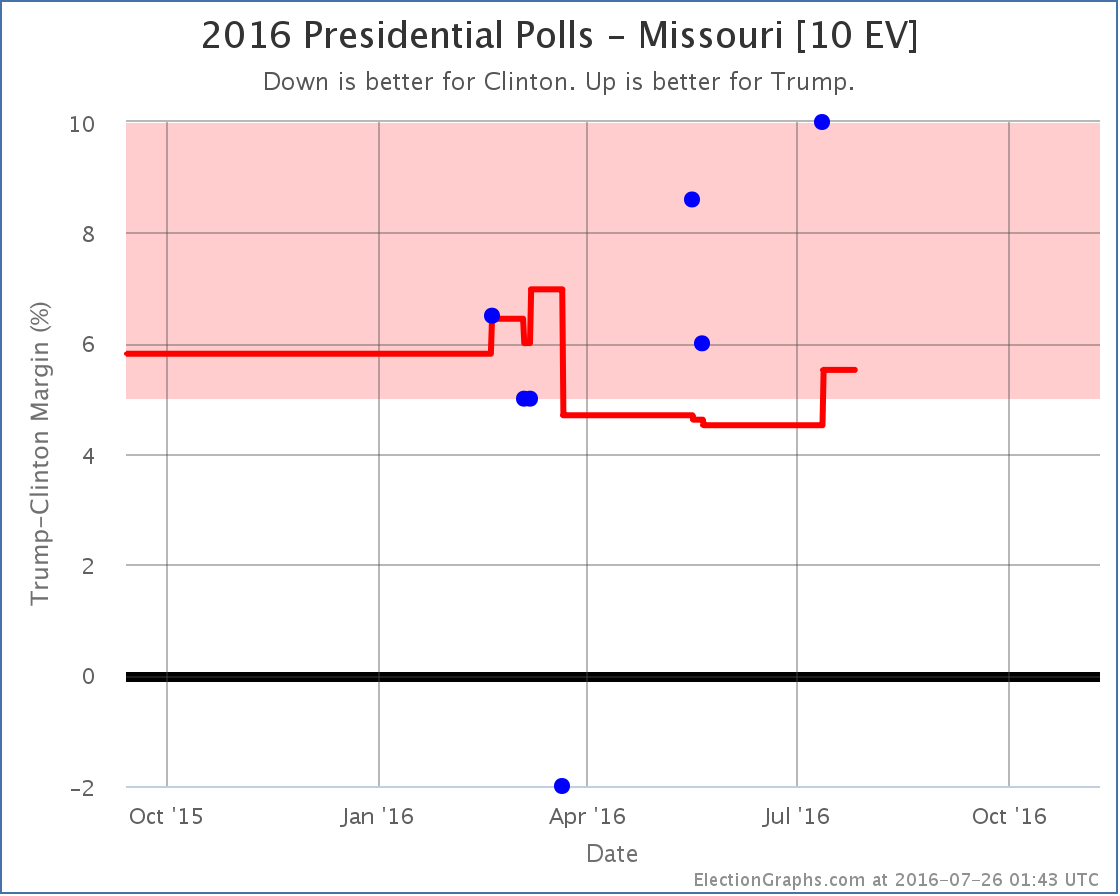
With the new Morning Consult poll centered in May added, the July PPP poll was enough to end Missouri’s time as a close state that was caused by a March DFM poll that now looks like a pretty clear outlier. So Missouri moves from “Weak Trump” to “Strong Trump” and it is therefore no longer listed as a possible pickup for Clinton.
Back in the past, you can see a few new features added by the Morning Consult polls… a dip in the expected line for a little while in May where Clinton briefly was in the lead in Georgia, and a spike in Clinton’s best case where she got within 5% in Texas… for one day.
The only change that hasn’t already come and gone is the change in Missouri. Clinton’s best case goes from winning by 230 electoral votes down to winning by 210.
Note this is not part of any “convention bump”. This change is due to poll information from before the convention. There should be new polls added soon that will tell us more about the impact of the conventions. This is not that.
Clinton vs Cruz
Oh, and the Morning Consult data had some Clinton vs Cruz information as well. Since that combination is still one of the five best polled combinations, even though Cruz lost, I’ll note the changes: Kentucky went from Strong Cruz to Weak Cruz, and Minnesota went from Strong Clinton to Weak Clinton. So Clinton’s best case moved from winning by 188 to winning by 204, and Cruz’s best case went from winning by 30 to winning by 50.
Note: This post is an update based on the data on ElectionGraphs.com. Election Graphs tracks both a poll based estimate of the Electoral College and a numbers based look at the Delegate Races. All of the charts and graphs seen in this post are from that site. Additional graphs, charts and raw data can be found there. Follow @ElectionGraphs on Twitter or like Election Graphs on Facebook to see announcements of updates or to join the conversation. For those interested in individual general election poll updates, follow @ElecCollPolls on Twitter for all the polls as they are added. If you find the information in these posts interesting or useful, please consider visiting the tip jar.
It has only been a few days since the last Electoral College update but there have already been polls added for Ohio, Indiana, California, Florida and Minnesota. A couple of these made differences to the ElectionGraphs.com models, so lets take a look…
Clinton vs Trump
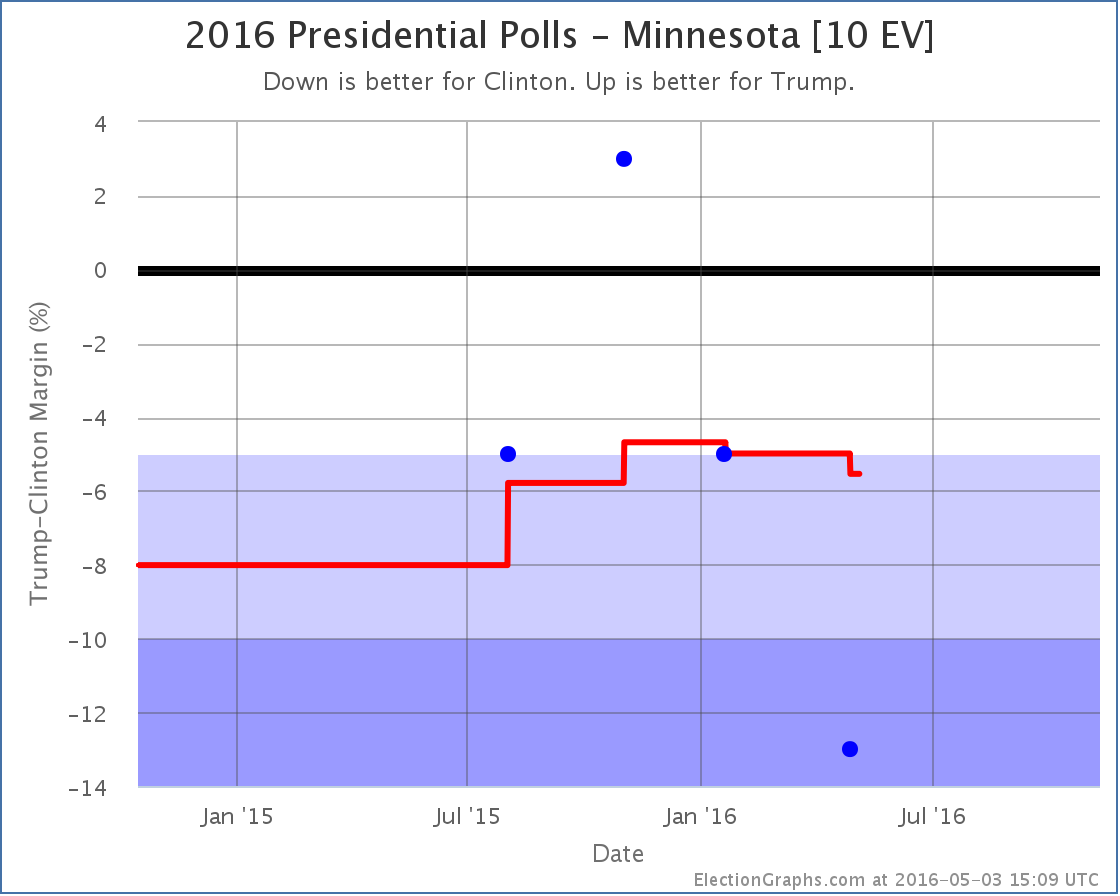
Minnesota has been lightly polled. The average still is padded with the 2012 election results. But with this addition, Clinton’s lead is now 5.5%, which puts the state out of the “Weak Clinton” category and into “Strong Clinton”. For the ElectionGraphs.com model that means for now we now assume that even in a very favorable case, Trump will not win Minnesota.
In the last update Trump’s best case was already an electoral college tie. So, with Minnesota out of the picture…
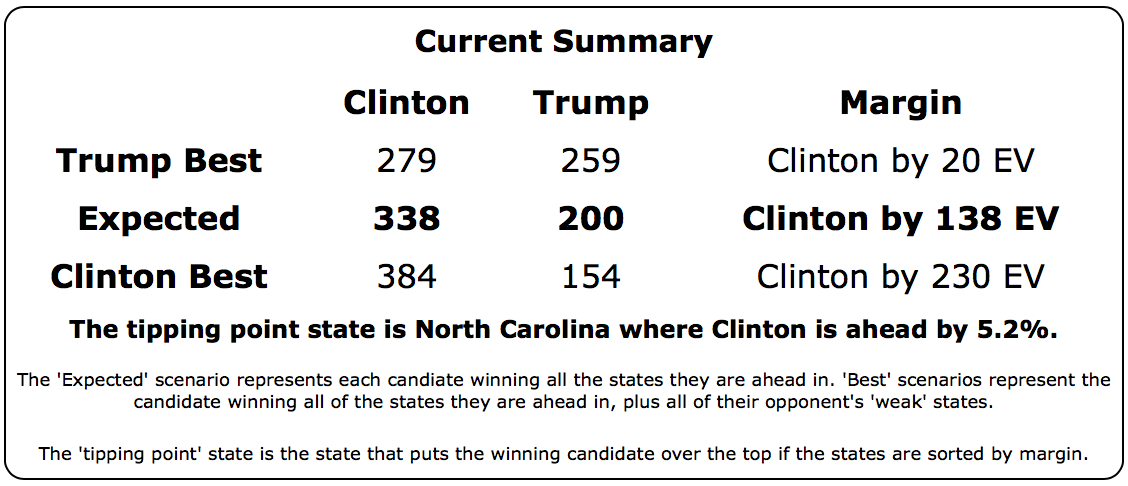
So yes. Trump’s best case… winning all the states where he leads in the polls, plus all the states where Clinton leads by less than 5%, is now to lose to Clinton by 20 electoral votes.
Now, it is important to mention that even though I call this Trump’s “best case”, it is the best case as of right now, with the polls we have today. It is May. We have months to go before the general election. A lot can change. So this doesn’t mean Trump can’t win. It just means that if today’s polling averages held, he couldn’t win.
The tipping point (the percentage you would have to move all the state polls to flip the winner) also moved toward Clinton:
All this together means that Trump is now very far behind Clinton. She has the clear advantage. A big advantage. Trump has a lot of work to do if he wants to catch up and be in a winning position by November. It is not impossible, but it will require changing a lot of minds.
Clinton vs Cruz
Oh yeah, Cruz is still in it too Cruz was still in it when this last batch of polls was taken, and he did badly as well. The latest poll in Florida didn’t change the categorization of Florida, but since Florida was the tipping point state it moved the tipping point:
Given the state of the nomination races though any combination other than Clinton vs Trump appears to be completely academic now, absent some catastrophic unexpected event.
188.8 days until polls close on election day 2016.
Note: This post is an update based on the data on ElectionGraphs.com. Election Graphs tracks both a poll based estimate of the Electoral College and a numbers based look at the Delegate Races. All of the charts and graphs seen in this post are from that site. Additional graphs, charts and raw data can be found there. All charts above are clickable to go to the current version of the detail page the chart is from, which may contain more up to date information than the snapshots on this page, which were current as of the time of this post. Follow @ElectionGraphs on Twitter or like Election Graphs on Facebook to see announcements of updates or to join the conversation. For those interested in individual general election poll updates, follow @ElecCollPolls on Twitter for all the polls as they are added.
Once again the headline out of a state is Trump winning. In Nevada the delegate count was:
14 Trump, 7 Rubio, 6 Cruz, 2 Carson, 1 Kasich
To be on the glide path for a 1st ballot victory though, Trump needed 15 of the 30 delegates. So he fell slightly short.
Now, don’t misunderstand. This is still an impressive victory, and looking at the upcoming states he has a clearer path to victory than anybody else. His margins were higher in Nevada than many people expected. But if today’s performance was replicated in all of the other states, Trump would come to the convention with more delegates than anybody else, but not the majority needed to win outright. Of course as we continue more people will drop out, and the amount with which states give bonuses to the winners increases, so that still seems like an unlikely final outcome.
Right now Trump continues to do everything he needs to do to win. Lets look at some of the graphs, then we’ll do a quick look at the March 1st “Super Tuesday” states.
The overall delegate count is now:
81 Trump, 17 Cruz, 17 Rubio, 6 Kasich, 5 Carson, and 7 for people who have dropped out
Trump continues to dominate. Lets look at this as percentages:
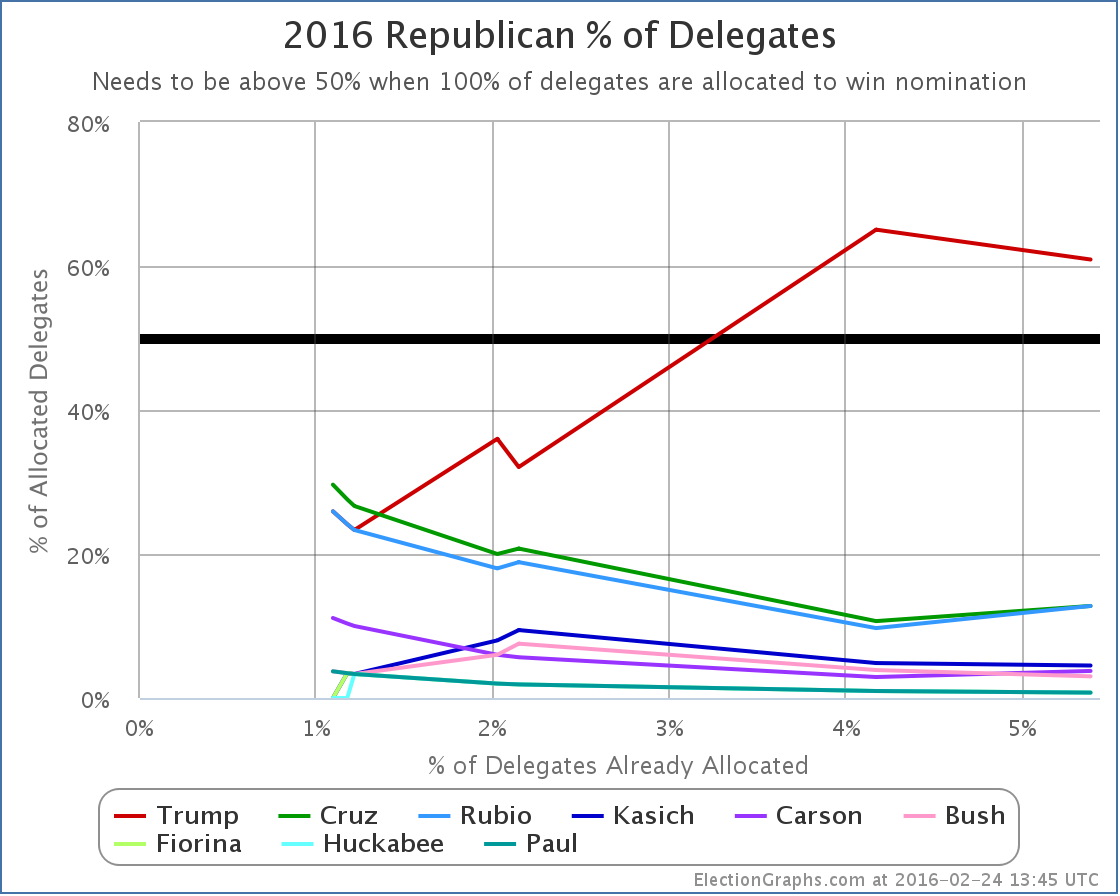
The “winners” here were actually Cruz, Rubio and Carson. Each of them improved their proportion of delegates with Nevada’s results. Trump actually went down. He doesn’t have to worry too much about that though. He still has a majority of the delegates allocated so far, and he is far far ahead of any of his opponents.
Finally, lets look at the “% of remaining delegates needed to win”, which I argue is the single most important thing to look at to understand where the race really is:
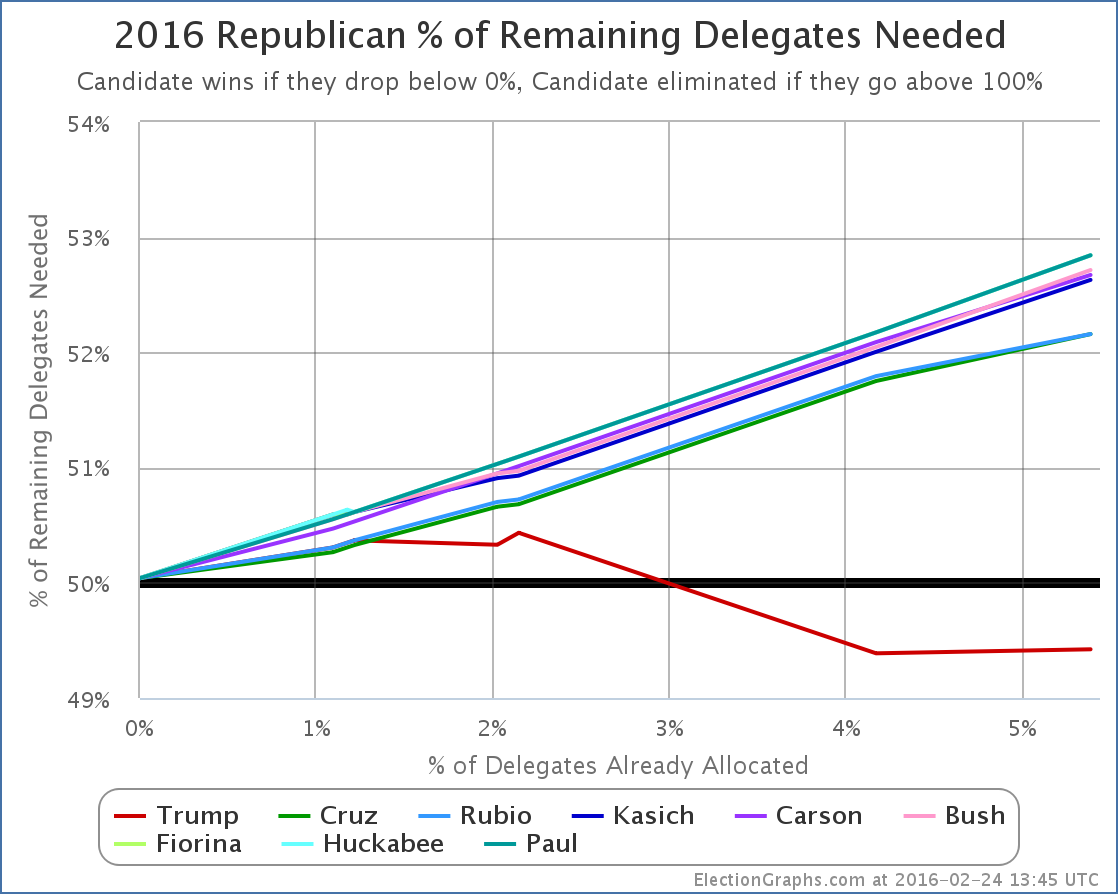
Because Trump got 14 delegates instead of 15 delegates, his line goes up a little bit. (Remember, on this chart down is good, up is bad.) The red line goes from needing 49.39% of the remaining delegates to needing 49.42%. This is a relatively trivial difference though. It is basically flat. Trump’s situation is very close to unchanged.
Meanwhile, the other lines keep going up at a decent pace. Kasich and Carson add about 0.6% to their numbers. Cruz and Rubio add about 0.4%.
This should be obvious, but the more they lose, the harder it is to catch up.
Many people are still talking about how as consolidation happens, the remaining non-Trumps will do better and the picture will change. Maybe, but nobody new announced they were dropping out after the Nevada results (yet anyway). So it looks like we may still go into March 1st with a five person race.
Lets run a hypothetical using current polling on the Super Tuesday states and see where we end up using RCP poll averages for the five remaining candidates. We’ll make delegate estimates based on the specific delegate allocation rules in each state.
Texas (155 delegates)
- Current poll averages: 37.3% Cruz, 28.0% Trump, 11.7% Rubio, 4.7% Carson, 3.0% Kasich
- Delegate estimates: 99 Cruz, 56 Trump
Georgia (76 delegates)
- Current poll averages: 35.0% Trump, 22.7% Cruz, 19.3% Rubio, 7.3% Carson, 6.3% Kasich
- Delegate estimates: 50 Trump, 26 Cruz
Tennessee (58 delegates)
- Last poll from November so using national average: 33.6% Trump, 20.4% Cruz, 16.4% Rubio, 9.8% Kasich, 7.4% Carson
- Delegate estimates: 37 Trump, 21 Cruz
Alabama (50 delegates)
- Last poll from December so using national average: 33.6% Trump, 20.4% Cruz, 16.4% Rubio, 9.8% Kasich, 7.4% Carson
- Delegate estimates: 32 Trump, 18 Cruz
Virginia (49 delegates)
- Using only February poll: 28% Trump, 22% Rubio, 19% Cruz, 7% Kasich, 7% Carson
- Delegate estimates: 17 Trump, 13 Rubio, 11 Cruz, 4 Kasich, 4 Carson
Oklahoma (43 delegates)
- Using only February poll: 32.5% Trump, 25.0% Cruz, 15.5% Rubio, 7.0% Carson, 0.0% Kasich
- Delegate estimates: 17 Trump, 15 Cruz, 11 Rubio
Massachusetts (42 delegates)
- Current poll averages: 41.0% Trump, 17.0% Rubio, 10.0% Cruz, 7.5% Kasich, 3.5% Carson
- Delegate estimates: 23 Trump, 9 Rubio, 6 Cruz, 4 Kasich
Arkansas (40 delegates)
- Using only February poll: 27% Cruz, 23% Trump, 23% Rubio, 11% Carson, 4% Kasich
- Delegate estimates: 18 Cruz, 13 Rubio, 9 Trump (giving Rubio the 2nd place finish breaking 23% tie by alphabetical order)
Minnesota (38 delegates)
- Last poll from January so using national average: 33.6% Trump, 20.4% Cruz, 16.4% Rubio, 9.8% Kasich, 7.4% Carson
- Delegate estimates: 18 Trump, 11 Cruz, 9 Rubio
Wyoming (29 delegates)
- No polls at all, using national average: 33.6% Trump, 20.4% Cruz, 16.4% Rubio, 9.8% Kasich, 7.4% Carson
- Delegate estimates: 12 Trump, 7 Cruz, 5 Rubio, 3 Kasich, 2 Carson
Alaska (28 delegates)
- Last poll from January so using national average: 33.6% Trump, 20.4% Cruz, 16.4% Rubio, 9.8% Kasich, 7.4% Carson
- Delegate estimates: 13 Trump, 8 Cruz, 7 Rubio
Vermont (16 delegates)
- No polls at all, using national average: 33.6% Trump, 20.4% Cruz, 16.4% Rubio, 9.8% Kasich, 7.4% Carson
- Delegate estimates: 10 Trump, 6 Cruz
OK, that’s it. Adding all that up…
Estimated Super Tuesday delegate totals: 294 Trump, 246 Cruz, 67 Rubio, 11 Kasich, 6 Carson
That gives Trump 47.1% of the super Tuesday delegates, Cruz 39.4%, and everyone else much less.
Trump needs 49.4% of the delegates to be on the path to an outright win though! So 47.1% would be in the realm where heading to a contested convention might be possible! Still unlikely, as the additional states in March will add up fast, and more candidates are likely to drop out. Still though, possible!
Adding in the existing delegates, we’d have a post-Super Tuesday race that looks like this:
375 Trump, 263 Cruz, 84 Rubio, 17 Kasich, 11 Carson, 7 for candidates who have already dropped out
Now, these are estimates based on current polling, and very few of these states were well polled as of this post, so much of the above is based on one or two polls, or using the national averages rather than state polls. And I had to make the assumption that all congressional districts would mirror state results (which is unlikely to be true). And Wyoming actually elects individual delegates rather than doing things based on candidate preference, so it may be an oddball in the end. And of course things are likely to change further before people actually vote next Tuesday. But… the general outlines of this aren’t likely to be too far off.
If this is even remotely close to where we are on March 2nd, we end up with Trump very close to the 50% of delegate mark. (The above has him EXACTLY at that mark.) He would need just a LITTLE bit more to actually push him over the edge to a clean win.
The flip side of that though is the combination of all the anti-Trumps would need just a LITTLE bit more in order to have this be on the path to a contested convention. I mentioned earlier that this is still an unlikely outcome. It is. After March 1st, the disproportionality of delegates given to the winner increases, and after March 15th we have pure winner take all states as well. If Trump remains in the overall lead, even with a plurality, then that is all it takes to push him over the edge.
If the anti-Trumps want to have any hope here at all, they need to be in a position by mid-March that they can win not just a few, but many states of the winner-take-most and winner-take-all variety. And frankly, the most likely scenario even then is just forcing a contested convention where Trump still has the most delegates, not someone else winning outright.
The anti-Trumps would have a hard road to get to an outright win. Cruz would need 56.8% of the remaining delegates to catch up and win after March 1st if things played out like my estimates above.
If you had to make a guess based on what we know now, a Trump nomination is far more likely than any other… and with an outright delegate majority on the first ballot, not after a contested convention.
6 days until Super Tuesday. We’ll see how close my estimates above turn out to be.
Update 2016-02-26 07:17 UTC – On February 22nd New Hampshire certified the results of their primary. In the final tally Trump had one more delegate than previous estimates, and Rubio one less. This did not seem worthy of a separate post, but a note here seemed appropriate. The totals on ElectionGraphs.com have been updates appropriately. This does not substantively change any of the analysis above.
Note: This post is an update based on the data on ElectionGraphs.com. Election Graphs tracks both a poll based estimate of the Electoral College and a numbers based look at the Delegate Races. All of the charts and graphs seen in this post are from that site. Additional graphs, charts and raw data can be found there. All charts above are clickable to go to the current version of the detail page the chart is from, which may contain more up to date information than the snapshots on this page, which were current as of the time of this post. Follow @ElectionGraphs on Twitter or like Election Graphs on Facebook to see announcements of updates or to join the conversation. For those interested in individual general election poll updates, follow @ElecCollPolls on Twitter for all the polls as they are added.
[Edit 16:28 UTC to correct math on % of remaining Cruz would need after Super Tuesday, I’d originally shown a higher number around 61%.]
[Edit 2016-02-27 17:06 UTC to fix place where Kasich had been autocorrected to Quash.]
[Edit 2016-02-28 22:03 UTC to add dropped out candidates to the after Super Tuesday estimate.]
With just a few days until Iowa, the concentration is naturally on the delegate races, but general election polling continues as well. Until we have actual delegate counts, we’re still following changes for the five best polled candidate combination. With the newest batch of polls, we have two of the Republicans strengthening their position against Clinton in Minnesota.
Clinton vs Rubio
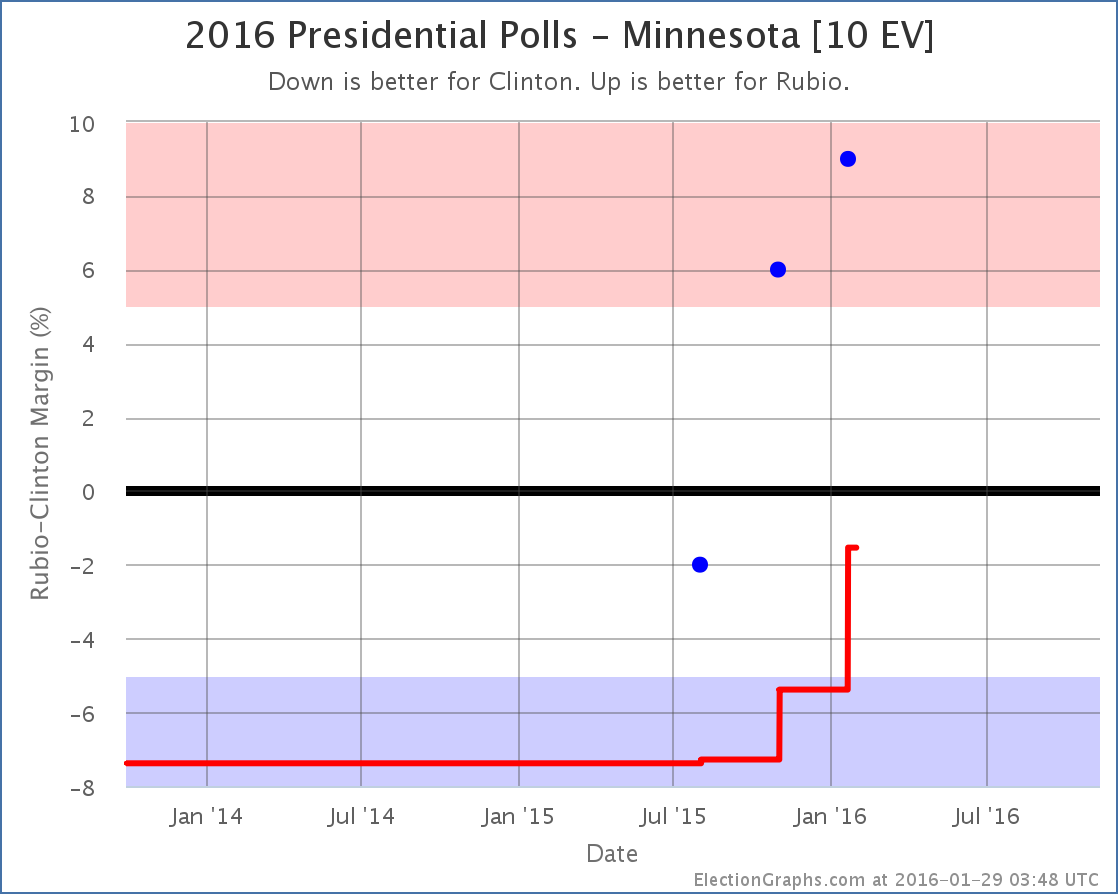
There hasn’t been a lot of polling in Minnesota, but what there is has been tilted further toward the Republicans than the five election average I use as a starting point for my poll averages. With the latest poll, the average moves to a Clinton lead of only 1.5%. This makes Minnesota start looking like a pretty close state. It makes Minnesota a possible pick up for Rubio, and therefore improves his “best case” against Clinton:
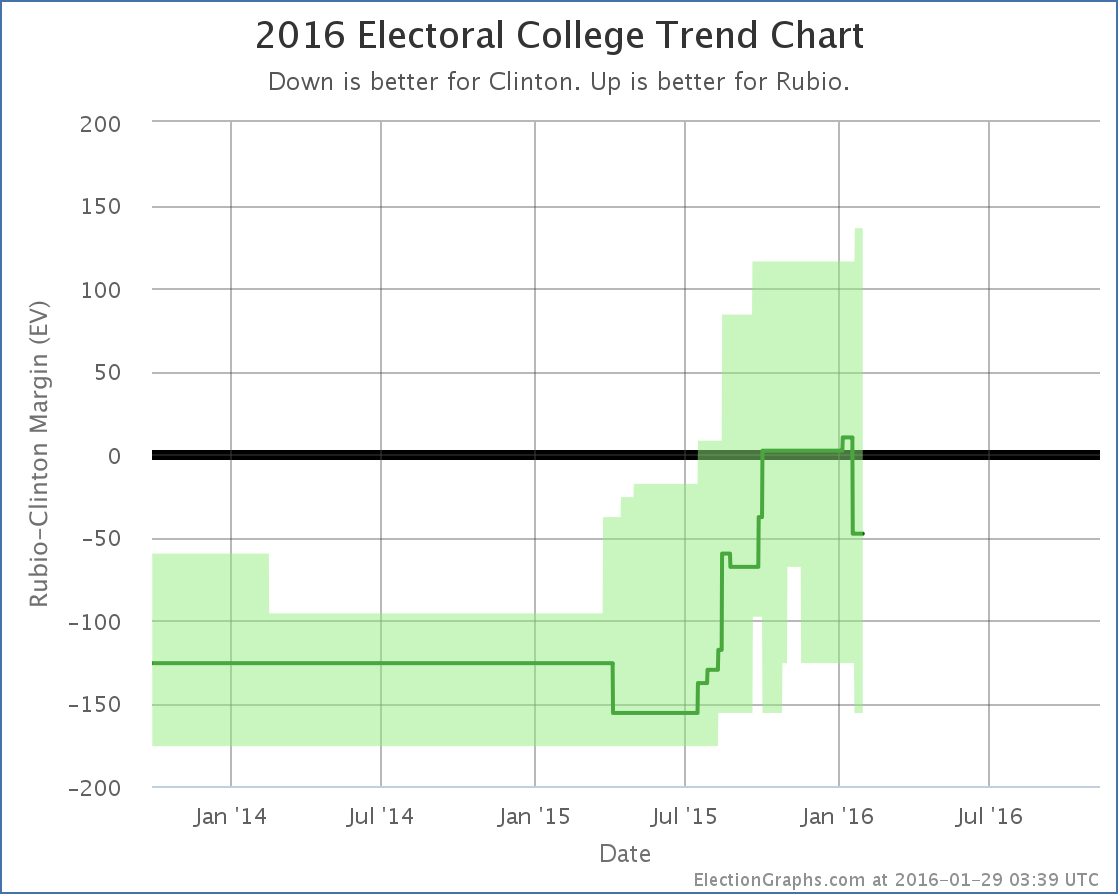
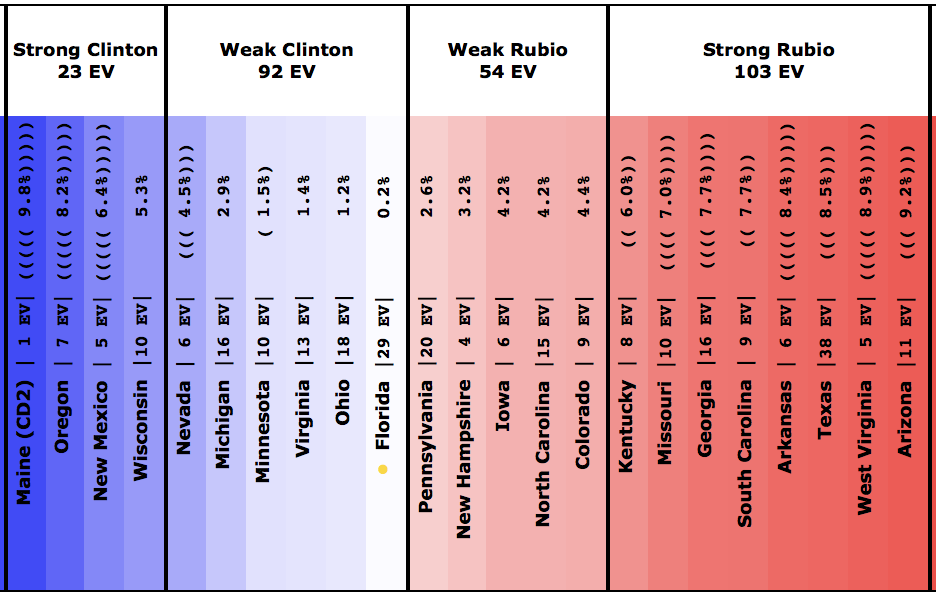
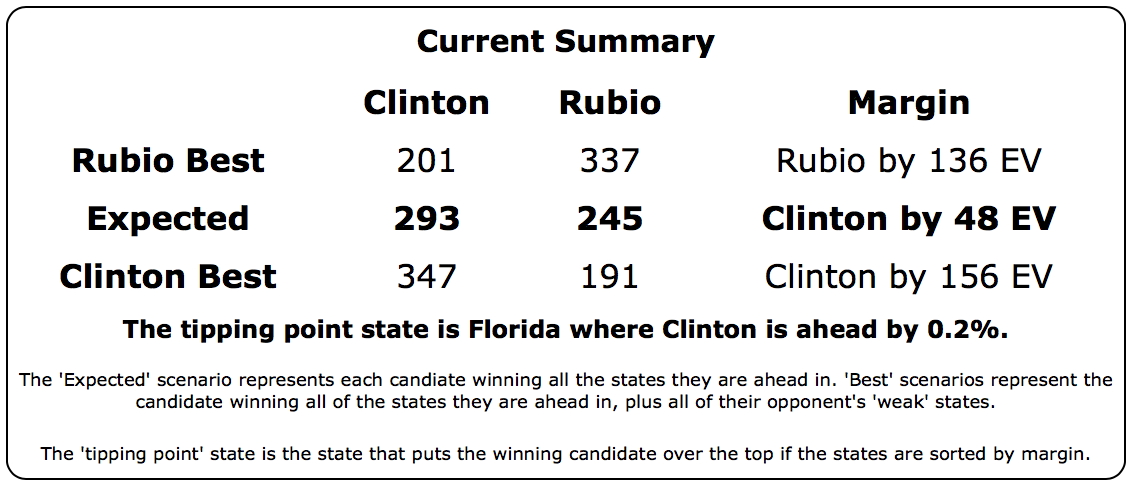
What’s remarkable looking at Clinton vs Rubio at this point is the huge number of close states. There are 146 electoral votes in the “up for grabs” category, where the polling margin is under 5% and it would be very easy to imagine the state going either way. Add to that that the tipping point is only a 0.2% Clinton lead, and Clinton vs Rubio is the most evenly matched of the five best polled candidate combinations by a decent margin. The race is very close, and the “best cases” for the two candidates are relatively close to being symmetric.
If the Republican race was about picking the candidate most likely to beat Clinton, Rubio would be way ahead. But it isn’t, and he isn’t.
Clinton vs Cruz
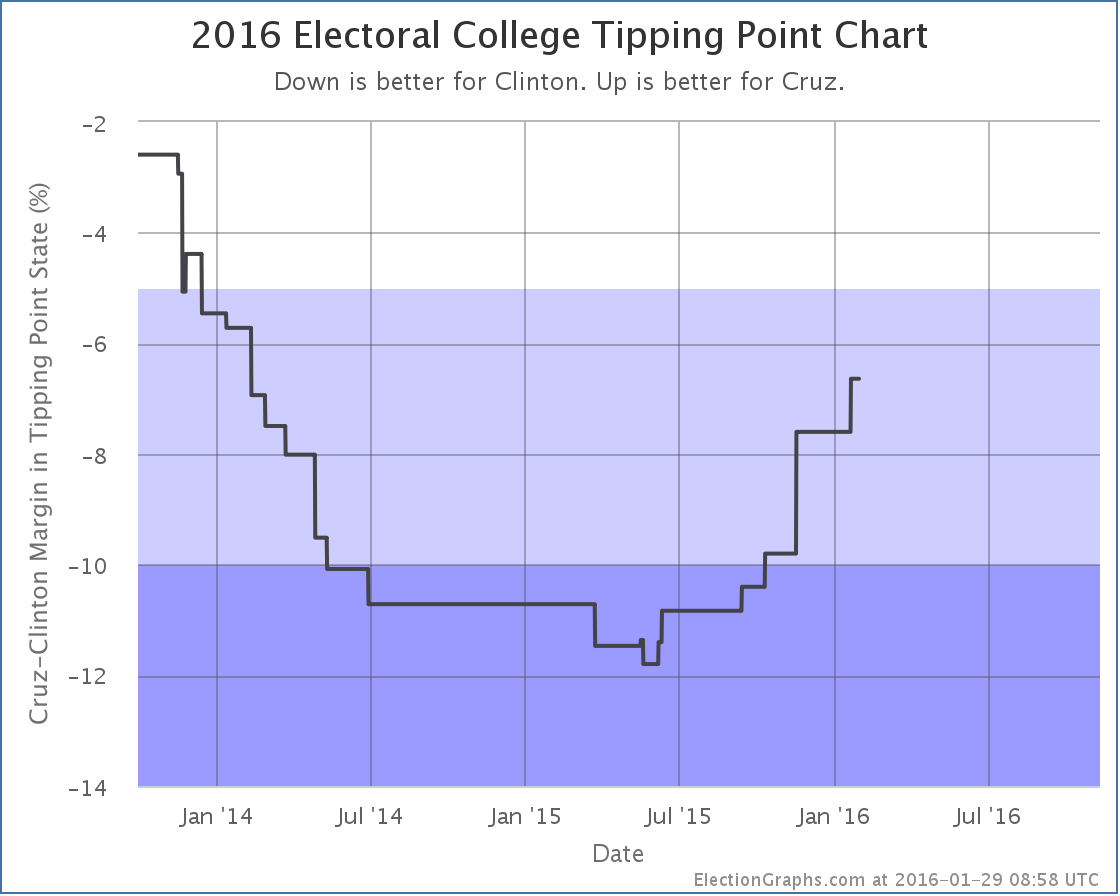
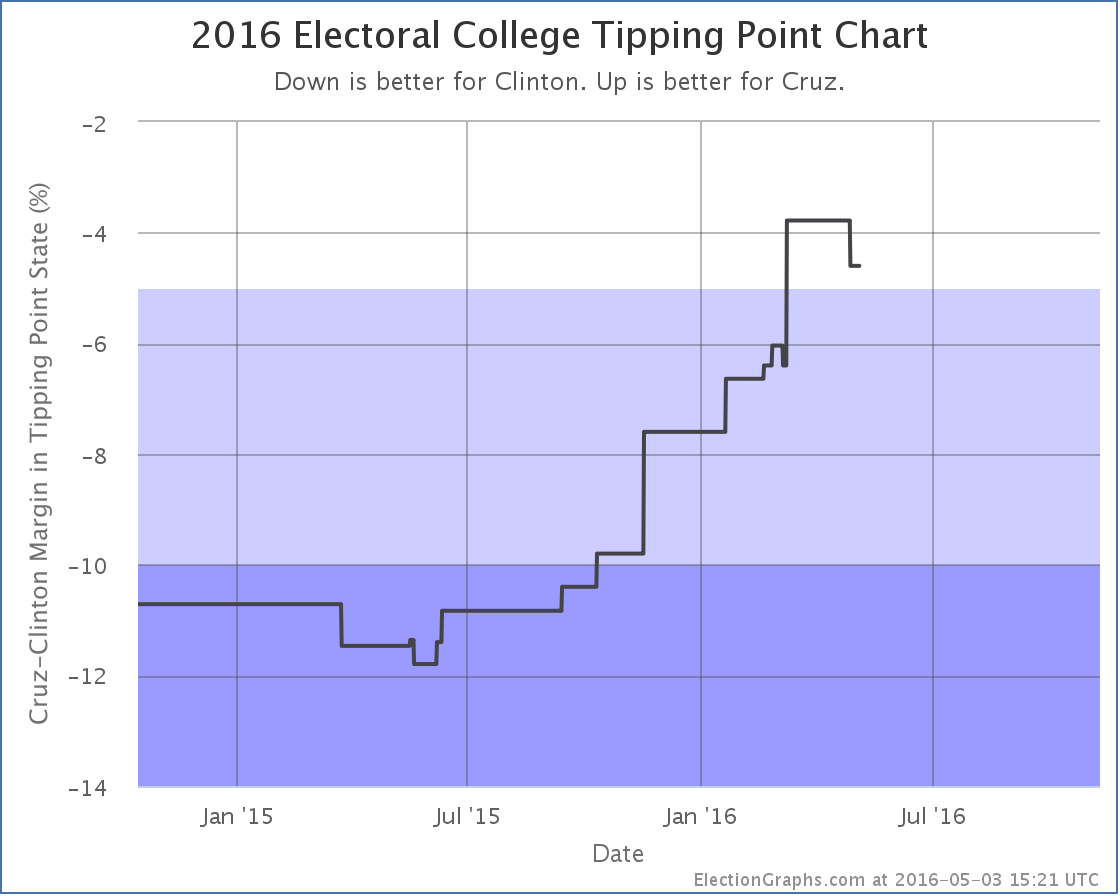
Cruz improved in Minnesota from being behind Clinton by 8.8%, to only being behind by 6.3%. This did not result in a category change, but it did move the tipping point… the state that puts the winning candidate over the edge if you put the states in order. We go from the tipping point being Virginia with a 7.6% Clinton lead, to being Florida with a 6.6% Clinton lead. This still means Cruz is very far behind. He is clearly losing to Clinton. It isn’t particularly close. But it is closer than it was. Cruz has been consistently improving on this metric since June. If Cruz stays in contention in the primaries, watch this number to see if this trend continues and Cruz starts making it an actually competitive race, or if Clinton vs Cruz continues to look like an easy Clinton win.
Clinton vs Trump
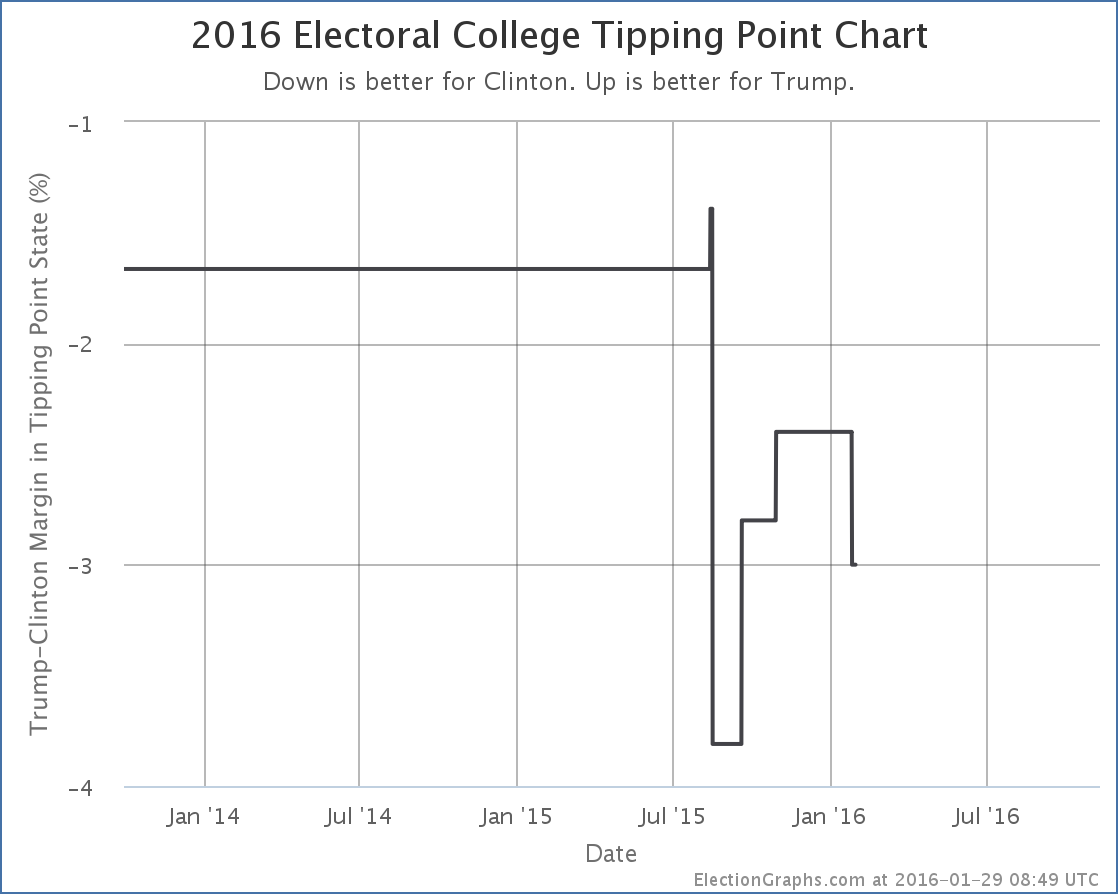
OK, technically Clinton vs Trump is #6 in terms of how well polled the candidate combination is, which means by my rules I wouldn’t be talking about it right now. But given Trump’s position in the polls, I’ll mention it anyway. New Clinton vs Trump polling in Michigan (not in Minnesota like the other two) increases Clinton’s lead from 2.4% to 3.0%. This does not move Michigan to a new category, but it does move the tipping point. In this case the tipping state was and still is Michigan, so the tipping margin just moves from 2.4% to 3.0%. There isn’t enough here to declare a real trend. And both 2.4% and 3.0% are “close”. So either way, a Clinton vs Trump race is one with a small Clinton advantage, but still a race that could go either way.
In just a few more days, we’ll have actual delegate leaders in both parties. Things are moving fast.
284.6 days until polls start to close on Election Day 2016.
Note: This post is an update based on the data on ElectionGraphs.com. Election Graphs tracks both a poll based estimate of the Electoral College and a numbers based look at the Delegate Races. All of the charts and graphs seen in this post are from that site. Additional graphs, charts and raw data can be found there. All charts above are clickable to go to the current version of the detail page the chart is from, which may contain more up to date information than the snapshots on this page, which were current as of the time of this post. Follow @ElectionGraphs on Twitter or like Election Graphs on Facebook to see announcements of updates or to join the conversation. For those interested in individual general election poll updates, follow @ElecCollPolls on Twitter for all the polls as they are added.


|
Romney |
Obama |
| Romney Best Case |
270 |
268 |
| Current Status |
206 |
332 |
| Obama Best Case |
190 |
348 |
With this update, there are no surprises, and no close states called, so Romney hangs on to his one glimmer of hope…
But the 04:15 update is coming soon, and the news is not good for Romney…


Two changes in category today, and bucking the recent trend, they are both moves toward Romney. In reverse order of electoral college weight:

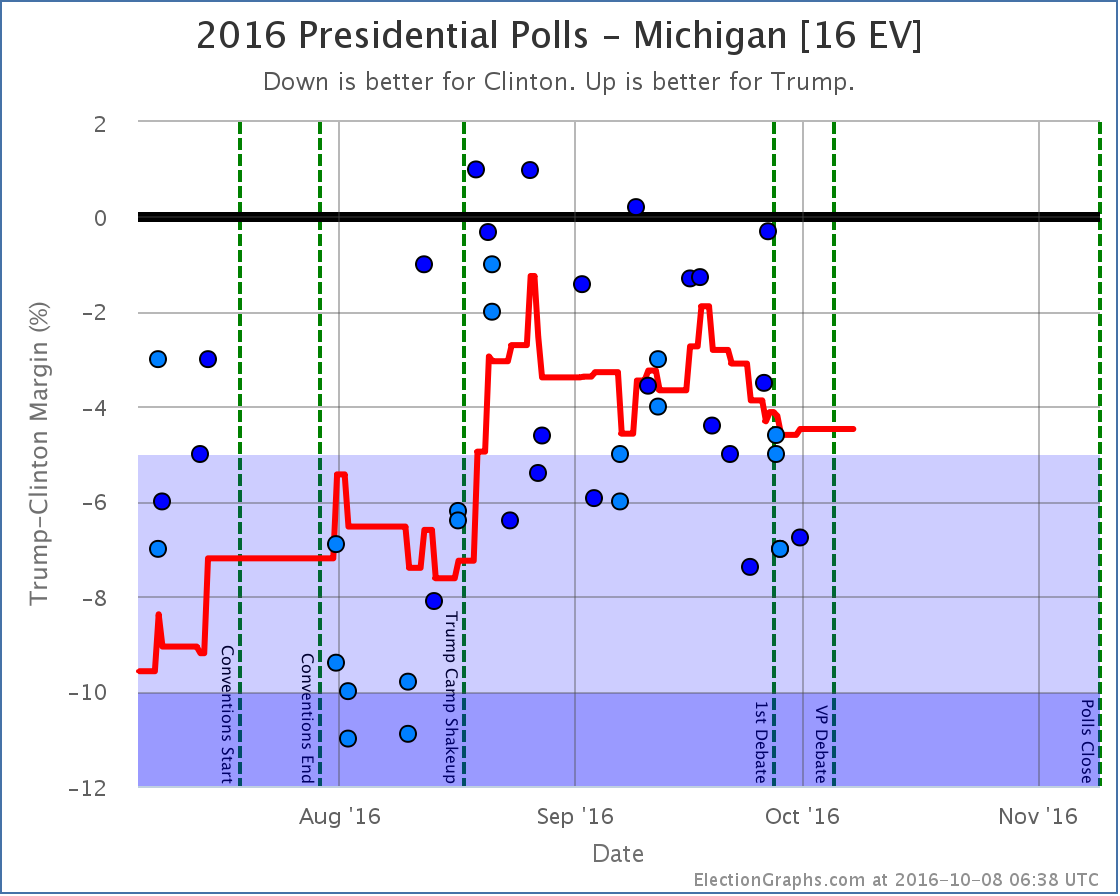
Minnesota (10 electoral votes) had been pretty sparsely polled before the conventions, and the five poll average had shown an Obama lead as high as 11.7% in July. With the batch of new polling in September, Obama’s lead has now dropped to only 7.9%. “Only” is of course relative. 7.9% is still a pretty substantial lead. Minnesota is not in play right now. The only question is how much Obama is going to win by. It looks like Obama’s margin will be less than it once looked like it might be. But this should still be an easy win for Obama.

Tennessee (11 electoral votes) is another state that hasn’t been polled all that often. The last set of polls, back in May, had moved the five poll average to a Romney lead of less than 5%, specifically a 4.2% lead. That had put Tennessee into the set of states my model thought could go either way. After all, a 4.2% lead is pretty slim. The right set of things happening, and perhaps Obama could have actually taken the lead there.
Well, the new set of polls added this week, which are actually two related results from YouGov, moves the average to a 5.8% Romney lead. As far as my model is concerned, that pulls Tennessee out of reach for Obama. Tennessee always seemed like a big stretch for Obama. It always seemed a bit odd that it was showing up in the “close states” category. Well, it now resumes a more natural looking position as a “Weak Romney” state, meaning that Romney has a big lead there, but maybe not so big a lead that he should completely ignore it.
Of course it will get ignored, because Obama doesn’t need it to win. Any scenario that has Obama winning Tennessee is probably an Obama landslide. So Obama isn’t going to pay attention to it. Meanwhile, if Romney is in a position where he is really fighting to win Tennessee, he has already lost. Given he is way behind right now, he needs to be concentrating on states where Obama is ahead to try to bring them back over to his side of the line. Spending time shoring up a state like Tennessee would be a waste of resources for Romney too. So, no attention for Tennessee. Poor Tennessee.
So where does this put the summary? Minnesota has no effect because it was never close. I no longer consider winning Tennessee to be a possibility for Obama, so Obama’s “best case” gets a little worse:
|
Romney |
Obama |
| Romney Best Case |
278 |
260 |
| Current Status |
191 |
347 |
| Obama Best Case |
191 |
347 |
The interesting thing here is of course that the current status is now the same as Obama’s best case. This is because there are no longer ANY close states where Romney is ahead. Tennessee is no longer close because it is now more solidly Romney. So that is good for Romney. Two states moved TOWARD Romney today. This is GOOD for Romney compared to yesterday.
But the overall situation remains very very difficult.
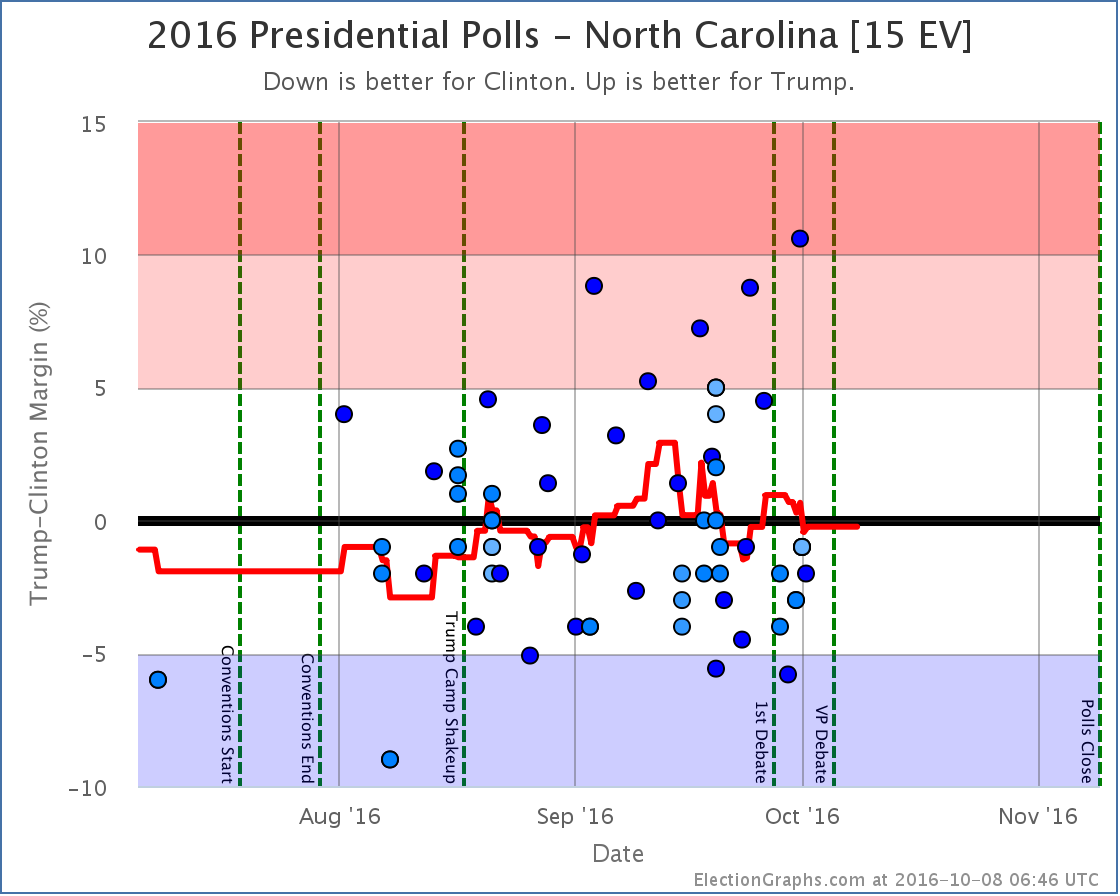
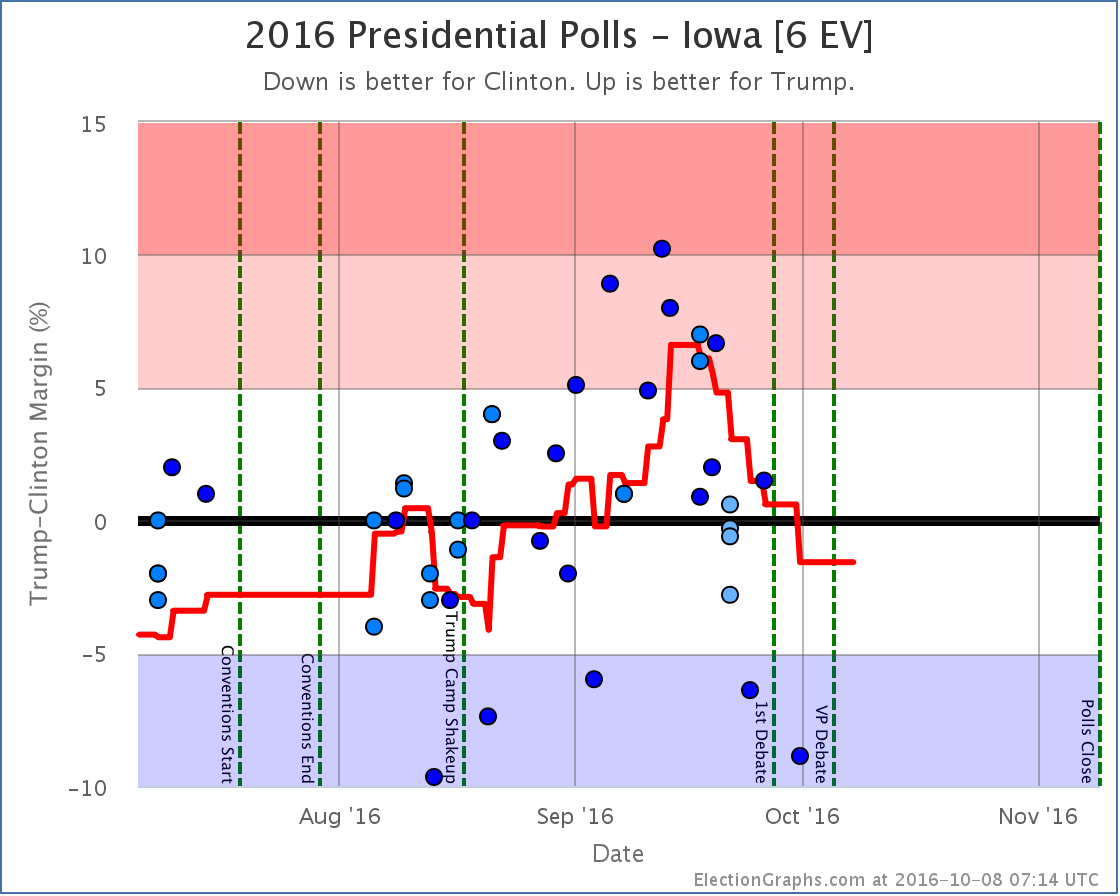
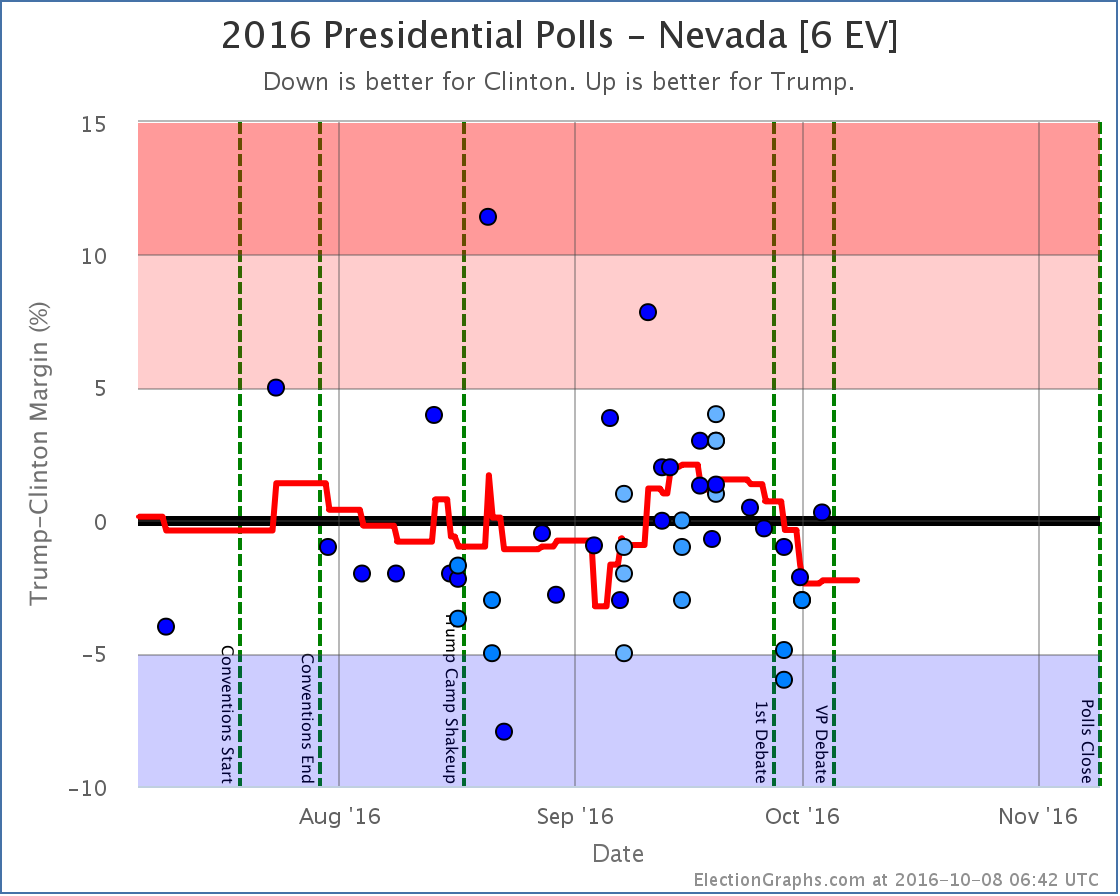
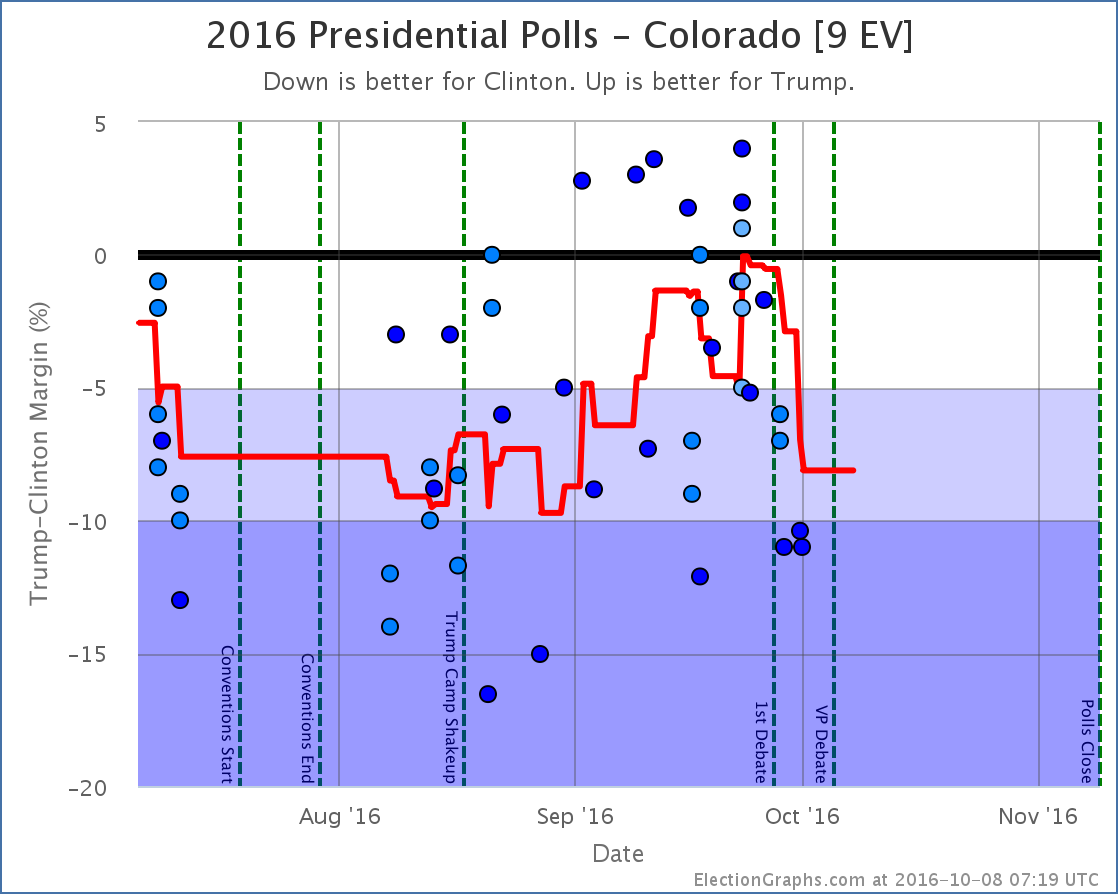
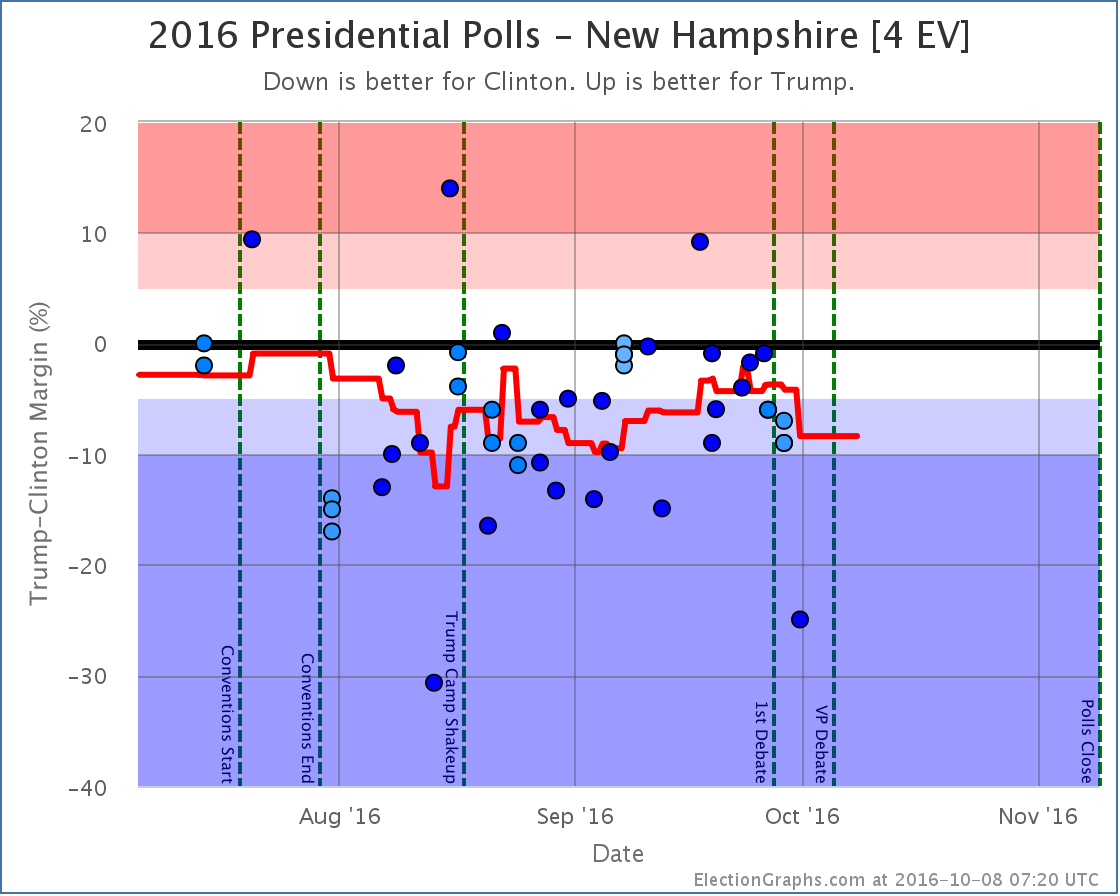
The remaining close states… Florida (29), Ohio (18), North Carolina (15), Colorado (9), Iowa (6), Nevada (6), and New Hampshire (4)… are all states where Obama is ahead.
Now, all of those states are close, and some of them are very close, with Obama’s lead no more than a sliver. Romney could retake the leads in one or more of these states with a little bit of a good news cycle and just one or two good polls.
But what this effectively does is put Obama at his ceiling. Previously, there was headroom above the “current” situation. You could imagine Obama doing a bit better and moving one or more states that were close but leaning Romney to being close but leaning Obama. Now there are no more Romney states that are close… states that one could easily imagine Obama picking up.
To do any better than a 347 to 191 win… which is where the state by state polls put him right now… Obama would need to start picking up states where Romney is ahead by more than 5% (but ones where he is ahead by less than 10%, because we need to retain at least some realism).
The areas in this category are now Georgia (16), Arizona (11), Indiana (11), Tennessee (11), Missouri (10), South Carolina (9), Montana (3) and Nebraska’s 2nd Congressional District (1). With the possible exception of Nebraska’s 2nd, which is very infrequently polled but where a poll this week showed the race tied, all of these seem like BIG stretches right now. Even if Romney collapses further and Obama expands his national lead, one could maybe see some of these getting closer again, but they have a long way to go to actually end up in the Obama win column.
As he was looking at the wiki between my update there and this post, a reader asked a question: Has this happened before?
I knew it hadn’t happened in this cycle, but I had a vague memory of there being some time in 2008 where all the close states were leaning in one direction. But I was wrong. Looking at my 2008 analysis, this didn’t happen then either. (I wasn’t doing this in 2004 or before, so I can’t speak to those years.) So indeed,with my method of classifying states… with leads in a five poll average less than 5% being considered “close” states that could go either way… this is the first time in two election cycles where ALL of the “close” states have leaned toward one candidate.
The positive spin for Romney is that Obama has reached a top. It will be very hard for him to do any better in the electoral college than where things are right now.
Of course, the flip side of that is that at the moment Obama is pretty far ahead, and to win Romney has to win almost all of the close states… all of which he is behind in at the moment.
This is not where a candidate wants to be in late September.
It isn’t quite time to just call the race for Obama and go home.
But it is getting close.
Last time around I “called the race” on October 3rd. In 2008 that was the first time we had a situation where McCain’s “best case” in my model was still losing. I didn’t actually think that situation would be sustained through November, but it the end it was. From October 3rd onward, the state by state polls showed a clear Obama win.
This time around, Romney has already been in that “best case is to lose” situation in my model three times. Each time he has recovered, but if Obama increases his lead in one or two key states, he could end up there again pretty easily. Unlike the last three times, there will be very little time to recover if he falls that far behind again. Of course, he would have to not just improve from that point, he would have to get to a point better than he has been at any time this year to actually pull into the lead.
At this very moment, his “current” line is well behind where McCain’s was four years ago too. Four years ago today it looked like McCain would get 256 electoral votes if the election was held then. That wasn’t enough to put him in the lead of course, but it was a lot better than the 191 Romney has in his column at the moment.
Romney needs some major game changing event to make this an interesting race again. He is running out of time for it.
He must wake up every day hoping that Obama will make some major mistake. Instead though, in the last few weeks anyway, it seems like it is Romney putting his foot in his moth over and over again. That isn’t what he needs to be able to start closing the gap, let alone to take the lead.
Note: With a new poll that I added to my spreadsheet today, the date that Wisconsin moved from Lean Obama to Weak Obama shifts from September 20th to September 21st. The trend chart at the top of this post reflects that adjustment.
Note: Chart and map from the Abulsme.com 2012 Electoral College Prediction page. Both assume Obama vs Romney with no strong third party candidate and show polling as it currently exists. Things will change before election day. On the map red is Romney, blue is Obama, gold states are too close to call. Lines on the chart represent how many more electoral votes a candidate would have than is needed to tie under several different scenarios. Up is good for Obama, Down is good for Romney.


Chart and map from the Abulsme.com 2012 Electoral College Prediction page. Both assume Obama vs Romney with no strong third party candidate. Both show polling as it currently exists. Things will change before election day. On the map red is Romney, blue is Obama, gold states are too close to call. Lines on the chart represent how many more electoral votes a candidate would have than is needed to tie under several different scenarios. Up is good for Obama, Down is good for Romney.
Two states change status today, and they are both moves in Obama’s direction:

First up, Minnesota (10 ev) moves to “Strong Obama” as Obama’s lead in the state in the five poll average tops 10%. Minnesota has been pretty sparsely polled. Obama has always been significantly ahead in Minnesota, but some polls from last year had it close enough that maybe Obama would need to do a little defense in Minnesota. With the new polls, it is looking like Minnesota is safe enough that Obama can essentially ignore it. At least for now.

Second and more importantly, Obama’s lead in Wisconsin once again moves over 5%. From May 17th until today Obama’s lead had dropped below 5%, leading me to classify Wisconsin as only “Lean Obama” and therefore as a swing state. This weakening appears to have been short lived. Wisconsin is now back in the “Weak Obama” status, meaning that Obama has a significant lead, but not a big enough lead to feel safe about the state and ignore it.
Of these two changes, only Wisconsin effects the range of scenarios, reducing Romney’s margin in his best case, since that state is no longer on the table for him.
|
Romney |
Obama |
| Romney Best Case |
281 |
257 |
| Current Status |
206 |
332 |
| Obama Best Case |
159 |
379 |
This now gives Romney a 12 electoral vote margin above the 269 he needs to tie. This makes Florida (29), Ohio (18), North Carolina (15) and Virginia (13) all into “must win” states for Romney. He can afford to lose any one of Arizona (11), Tennessee (11), Missouri (10), Colorado (9) or Iowa (6), but not two.
Finally, as I continue to go through the old data provided by Darryl at HorsesAss I find another old poll that requires a correction to my time series chart. This time it is an old Tennessee poll from October 2011. Frankly, it looks very much like an outlier compared to other Tennessee polls, showing Romney ahead by 18%, where his strongest showing in any other poll was a 7% lead, but it is a poll I would have included had I known about it, so there it is. The result of including this poll is to change the date when Tennessee moved from “Weak Romney” where it started the year to “Lean Romney” where it is now from March 2nd to May 24th. This is an almost three month move because Tennessee has been very sparsely polled. This only changes the historical status, not where Tennessee is today, which is a 4.2% Romney lead in the five poll average, making Tennessee a “swing state” in our model, but just barely.
The historical graphs have been corrected as of today’s post.


Charts from the Abulsme.com 2012 Republican Delegate Count Graphs page. When a candidate gets down to 0%, they have clinched the nomination. If they get above 100%, they have been mathematically eliminated. The first chart is by date, the second is by “% of Delegates Already Allocated”. These numbers include estimates of the eventual results of multi-stage caucus processes which will be refined as the later stages occur.
Updates for three states today.
First of all, Minnesota. The state convention was Friday and Saturday, but our source The Green Papers didn’t update their counts until a few hours after I did my daily scan of the delegate counts on Tuesday. I did my scan at 02:41 UTC yesterday, GP updated their counts sometime between then and 07:00 UTC. If I’d done my scan a little later as I sometimes do, this would have been its own update yesterday, but I didn’t, so it gets included in today’s update instead.
Regardless, based on the results of the state conventions, the estimates for Minnesota change. Previously, the estimates were Paul 24, Santorum 8, Romney 2, Gingrich 2, TBD 4. Now, after the convention: Paul 32, Santorum 2, Gingrich 1, TBD 5. Notice Romney now has no delegates in Minnesota at all. Wow. (Although some of the TBDs may go that way when they eventually choose.) Net for this update in Minnesota: Paul +8, Gingrich -1, Romney -2, Santorum -6. This would be great for Paul except for the fact that he is so far behind that it doesn’t matter. But fun stuff in Minnesota none the less.
Now we get to the two states that voted in primaries on Tuesday. Both are Romney shutouts.
Arkansas: Romney gains 33 delegates. New totals: Romney 35, TBD 1
Kentucky: Romney gains 42 delegates. New totals: Romney 42, TBD 3
So, the total take for the day: Romney +73, Paul +8, Gingrich -1, Santorum -6
New overall totals by our count: Romney 1052, Santorum 255, Gingrich 143, Paul 125.
Romney only needs 92 more delegates to win. That is 12.9% of the remaining delegates (down from 21.0% before today’s update).
Texas is Tuesday and has more than enough delegates to push Romney over the edge.
Tuesday should be it.
|
|


