This is the website of Abulsme Noibatno Itramne (also known as Sam Minter).
Posts here are rare these days. For current stuff, follow me on Mastodon
|
For once this is an update with good news for Clinton! Specifically, the latest Florida poll brings the state back into reach…
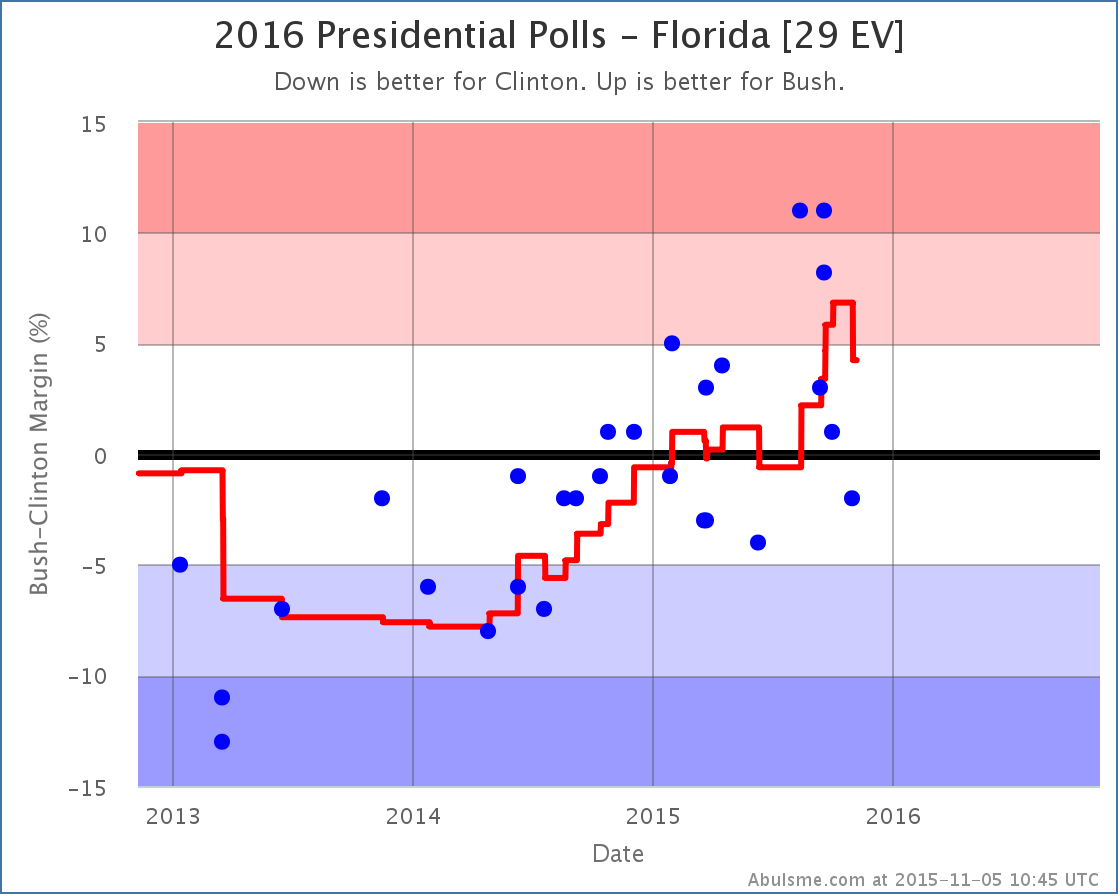
Well, into reach against Bush. Bush hasn’t been having the best time of things lately. But Bush now leads Clinton by only 4.2% in our average, so we consider Florida one of those states that could go either way.
Meanwhile though, against Rubio…
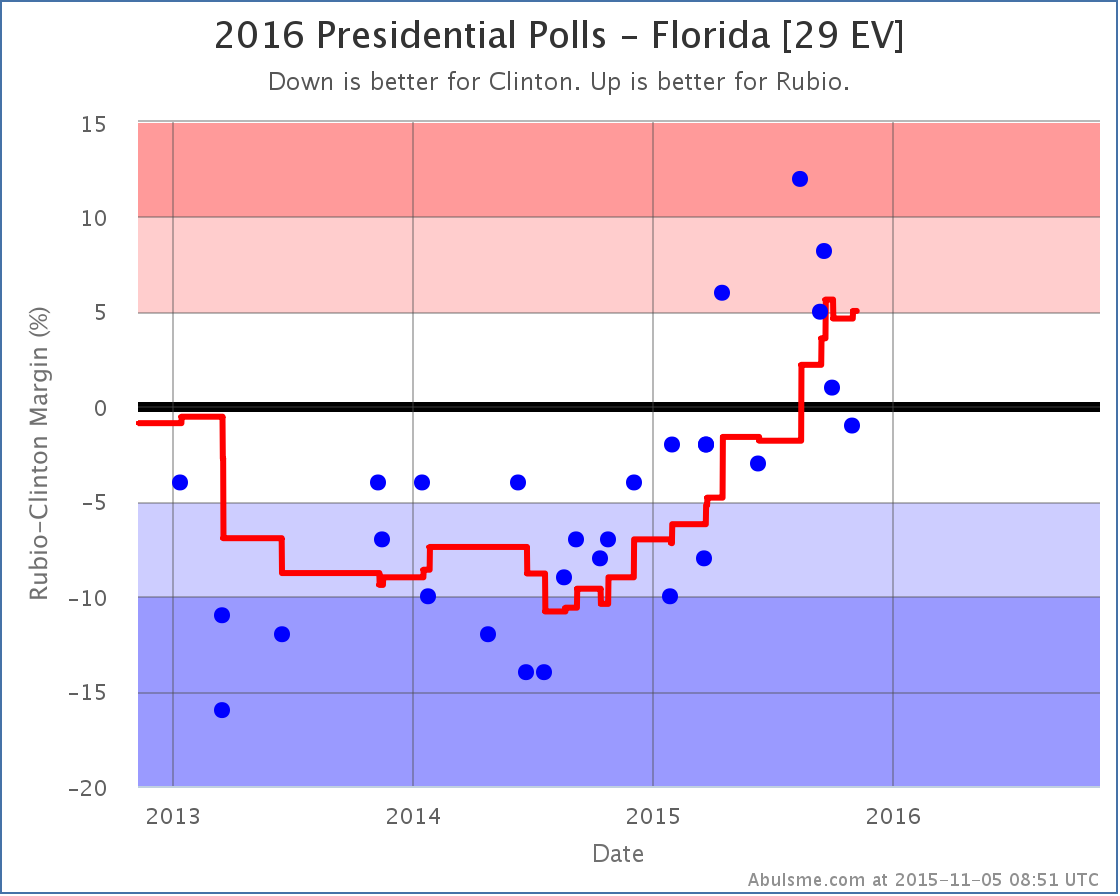
With this latest poll Rubio’s lead grows to just barely over 5%, so once again we take it out of the “possible” list for Clinton.
So Clinton gains Florida as a possible pickup against Bush, but loses it agains Rubio. Is that a wash over all? Probably.
It is also worth noting though that in both of these cases the averages are very close to the 5% boundary between the actually pretty arbitrary “Weak” and “Strong” categories. It should not be surprising if the next polls just reverse today’s changes.
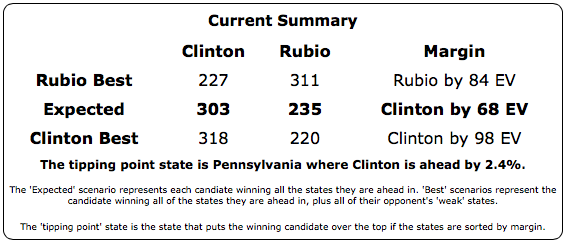
For the moment though:
- Clinton’s best case vs Bush improves from winning by 98 electoral votes to winning by 156 electoral votes.
- Clinton’s best case vs Rubio drops from winning by 126 electoral votes to only winning by 68 electoral votes.
The “expected” cases, where each candidate just wins the states they lead in the average, remain Clinton winning by 48 electoral votes against Bush, and losing by 2 electoral votes against Rubio.
369.1 days until the first polls start to close.
Note: This post is an update based on the data on ElectionGraphs.com. All of the charts and graphs seen here are from that site. Graphs, charts and raw data can be found there for the race nationally and in each state for every candidate combination that has been polled at the state level. In addition, comparisons of the best polled candidate combinations both nationally and each in each state are available. All charts above are clickable to go to the current version of the detail page the chart is from, which may contain more up to date information than the snapshots on this page, which were current as of the time of this post. Follow @ElecCollPolls on Twitter for specific poll details as I add them. And like Election Graphs on Facebook!
This week on the Curmudgeon’s Corner podcast Ivan and Sam’s big topics are the Presidential race, the goings on in Congress, and Ivan’s musings on tech while attending Oracle OpenWorld. That gets you everything from the Benghazi hearing to the appeal of Carson to Speaker Ryan, the Budget Deal, and even Twitter and Hadoop. But it all starts with a bit on San Fransisco, and Sam breaking his foot. Fun!
Click to listen or subscribe… then let us know your own thoughts!

Recorded 2015-10-28
Length this week – 1:53:06
 1-Click Subscribe in iTunes 1-Click Subscribe in iTunes
 View Podcast in iTunes View Podcast in iTunes
 View Raw Podcast Feed View Raw Podcast Feed
 Download MP3 File Download MP3 File
 Follow the podcast on Facebook Follow the podcast on Facebook
Show Details:
- (0:00:10-0:25:41) But First
- Agenda
- San Fransisco
- Sam broke his foot
- (0:26:20-0:48:45) Election 2016
- Future Sam on Republican Debate
- Ivan touches things
- Democratic Polls
- Clinton Benghazi Hearing
- Clinton turnaround
- Clinton vs the Republicans
- Trump losing… to Carson?
- The appeal of Trump and Carson
- Bush concentrating on Rubio
- The other Republicans
- (0:59:33-1:19:56) Congress
- Speaker Ryan
- Budget Deal
- CISA Passes Senate
- Politicians and Tech
- One more Carson thing
- (1:21:00-1:52:46) Tech Update
- Oracle OpenWorld
- What is Hadoop?
- Rise of the cloud
- Speed of Innovation
- Tech Company Earnings
- Apple
- Twitter
- Native Advertising
- Taking Companies Private or non-Profit
- Book: The Scarlet Plague
On this week’s Curmudgeon’s Corner we apologize for last week’s show, then jump right in on Election 2016 analysis. We cover Biden’s exit and the results of last week’s debate, and what all that means for Clinton. Then we move on to the Republicans, talking about Trump’s staying power, how the only one close to him is Carson of all people, and how Bush is crashing and burning. With the Presidential race out of the way, we spend some time on Paul Ryan and the race for Speaker. Then finally in our lightning round we hit Back to the Future Day, iPads and iPhones, the hospital bombing in Afghanistan, book and movie reviews, and more!
Click to listen or subscribe… then let us know your own thoughts!
Recorded 2015-10-22
Length this week – 1:32:48
1-Click Subscribe in iTunes
View Podcast in iTunes
View Raw Podcast Feed
Download MP3 File
Follow the podcast on Facebook
Show Details:
- (0:00:10-0:09:08) But First
- Sounds Ivan makes
- Allergy Meds
- Making fun of Ivan falling asleep
- Forced Break
- Future Debates
- Agenda
- (0:10:09-0:21:49) The Democrats
- Biden Out
- Debate Results
- Clinton’s Position
- Sad for Joe
- (0:22: 53-0:56:17) The Republicans
- Debate Demands
- Trump not going away
- Trump vs Bush
- Efforts to stop Trump
- Trump in the general?
- Thinning the crowd
- The Republican Split
- (0:56:56-1:11:18) Speaker of the House
- Future Sam Disclaimer
- Ryan’s Conditions
- Ryan’s Options
- Ryan the RINO
- Weakened Ryan?
- (1:12:07-1:32:28) Lightning Round
- Back to the Future Day
- iPad vs big iPhone
- Car bluetooth issue
- US hospital bombing
- Apple Music Subscriber Numbers
- Movie: Mud
- Book: The Son Also Rises
Continuing the trend, in today’s update Clinton just weakens further. Let’s just jump right into the details:
Clinton vs Bush
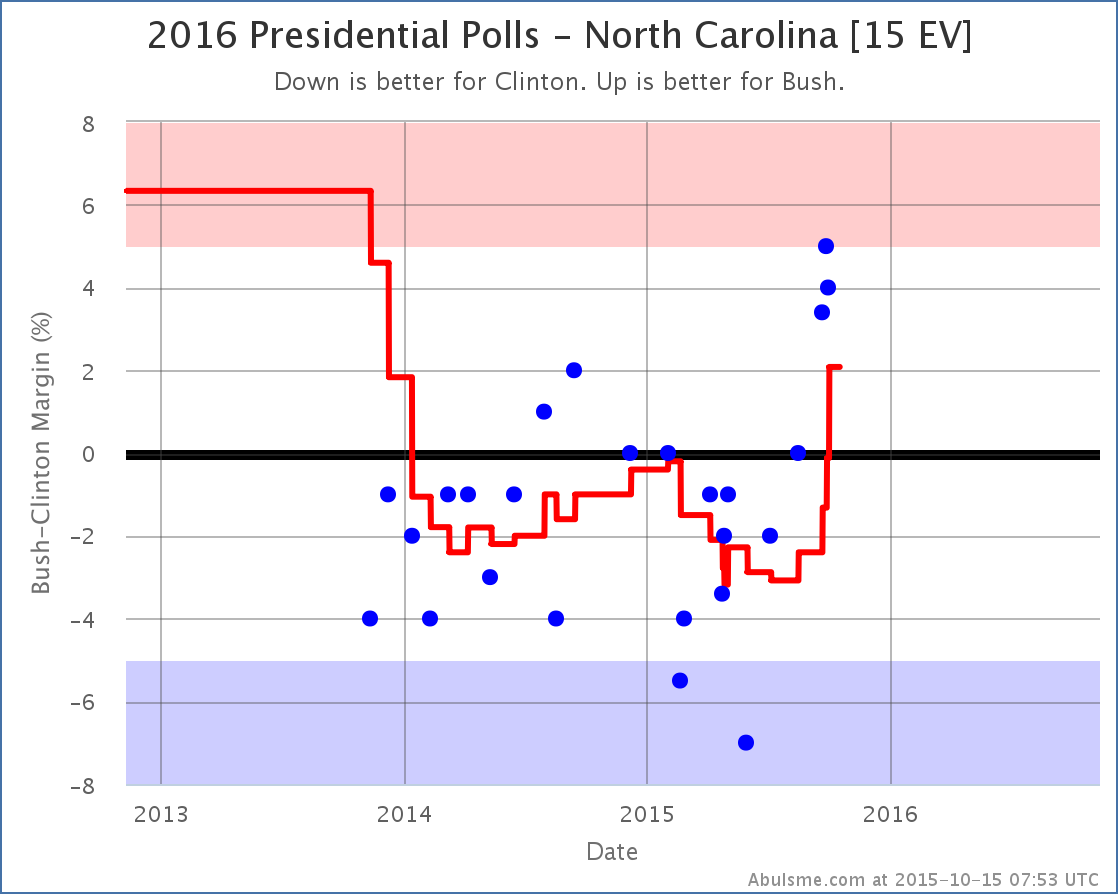
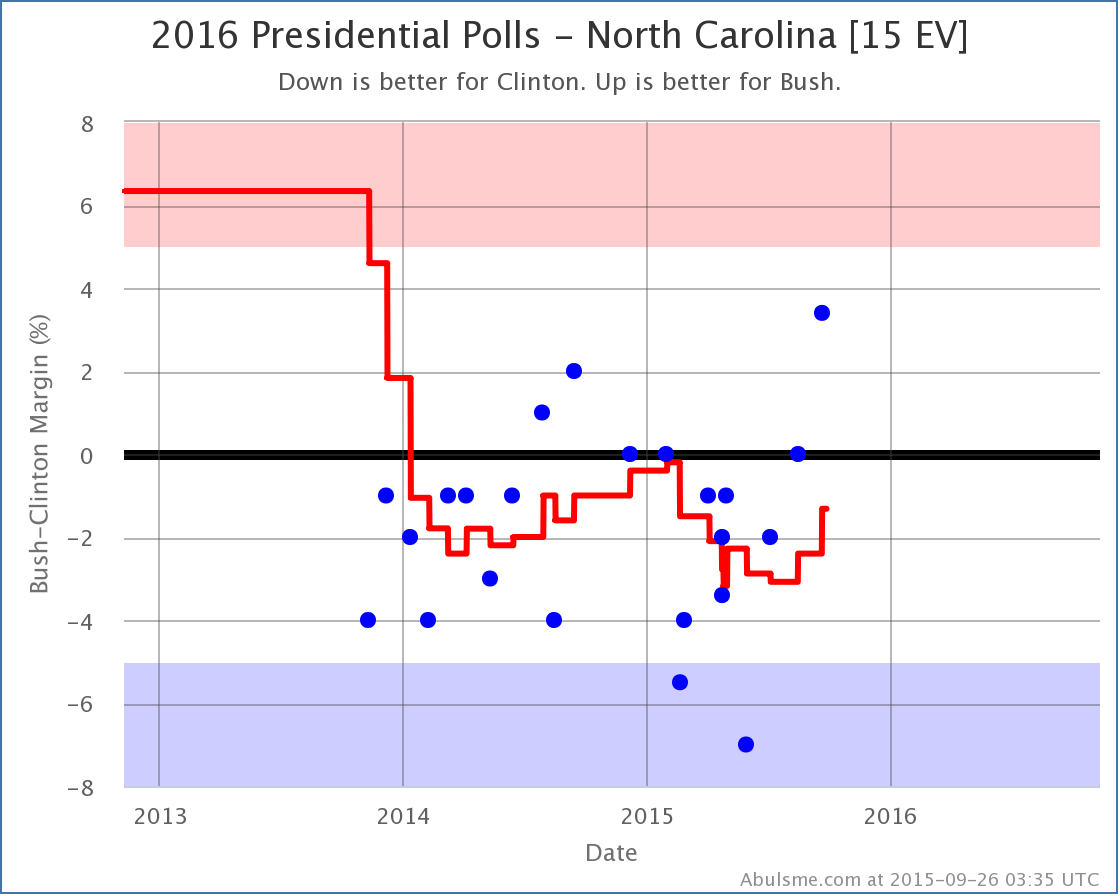
With the latest polls Bush surges to the lead in North Carolina. This has been a pretty quick move. All three polls taken since mid-September have shown a Bush lead. Before that he hadn’t managed better than a tie in North Carolina since September 2014.
This of course improves Bush’s “expected case” where he wins all the states where he leads in my poll average:

This brings the expected result to Clinton 293 to Bush 245. Still a 48 electoral vote loss for Bush, but that is closer than it has ever been before.
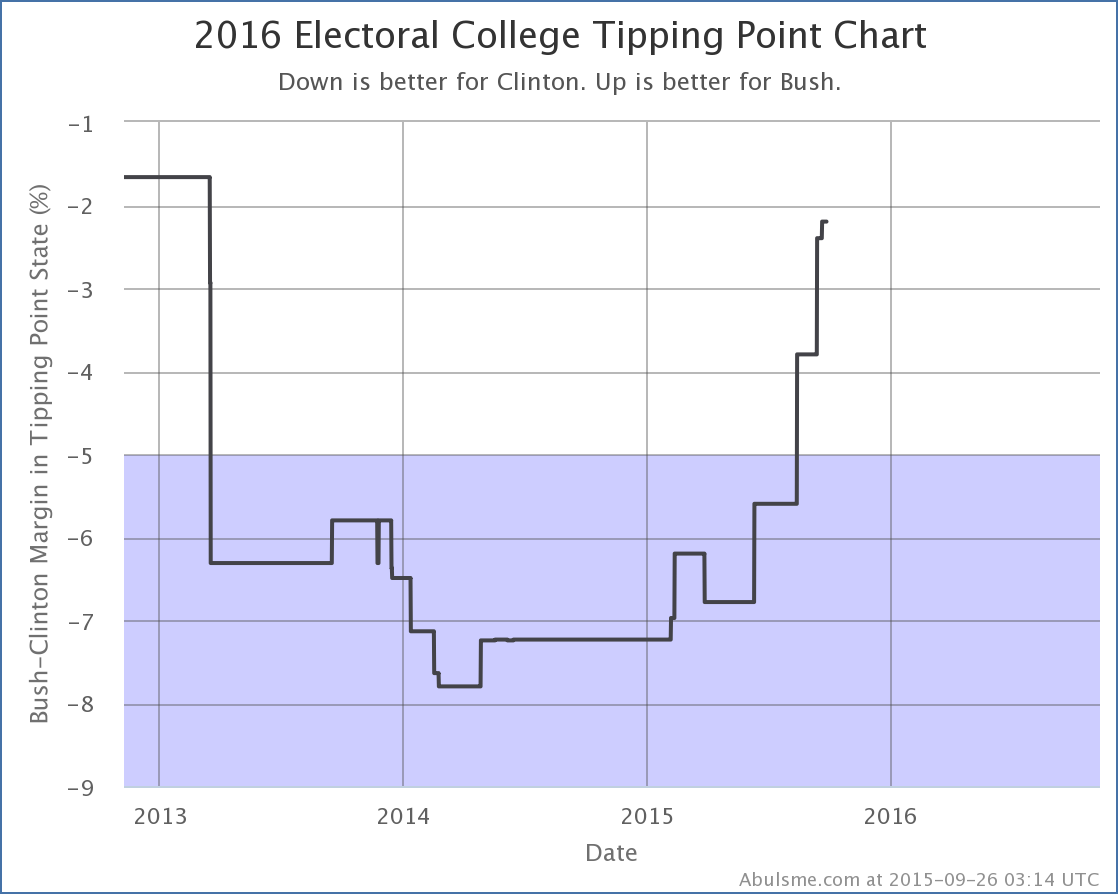
Bush also improved against Clinton in Virginia. This did not result in a category change, but it did move the tipping point further in Bush’s direction:
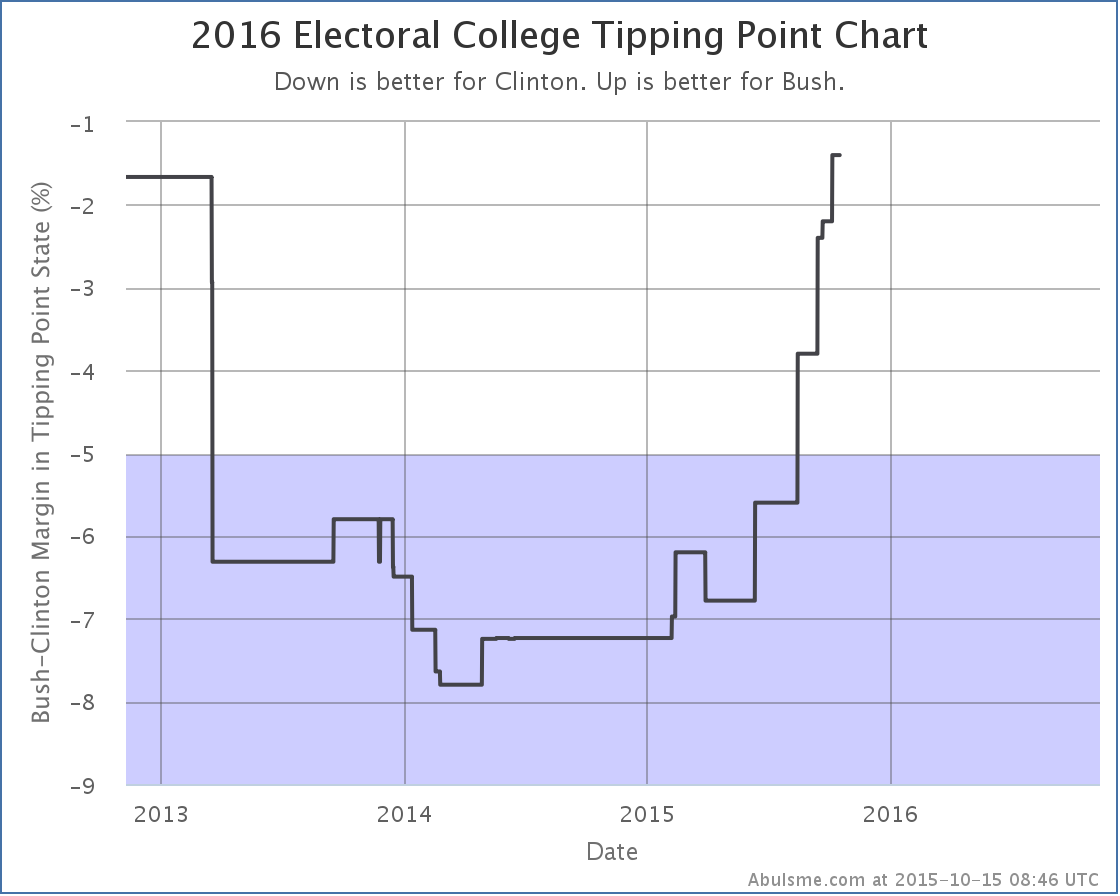
The tipping point is now 1.4% in Michigan in Clinton’s favor. So a national poll move of as little as 0.7% would flip the electoral college to Bush’s side. Bush may not be leading yet like Rubio is, but he is actually very close to that. His best case is to win by 104 electoral votes if he gets all the close states. So Bush is certainly competitive with Clinton at the moment.
Bush vs Christie
Christie? Is he still running? I thought he was just about gone. Before today’s update, nobody had bothered to include Christie in a state level poll since late August. More than a month. But CNU decided to include him in a new Virginia poll, and it improved his position in Virginia:
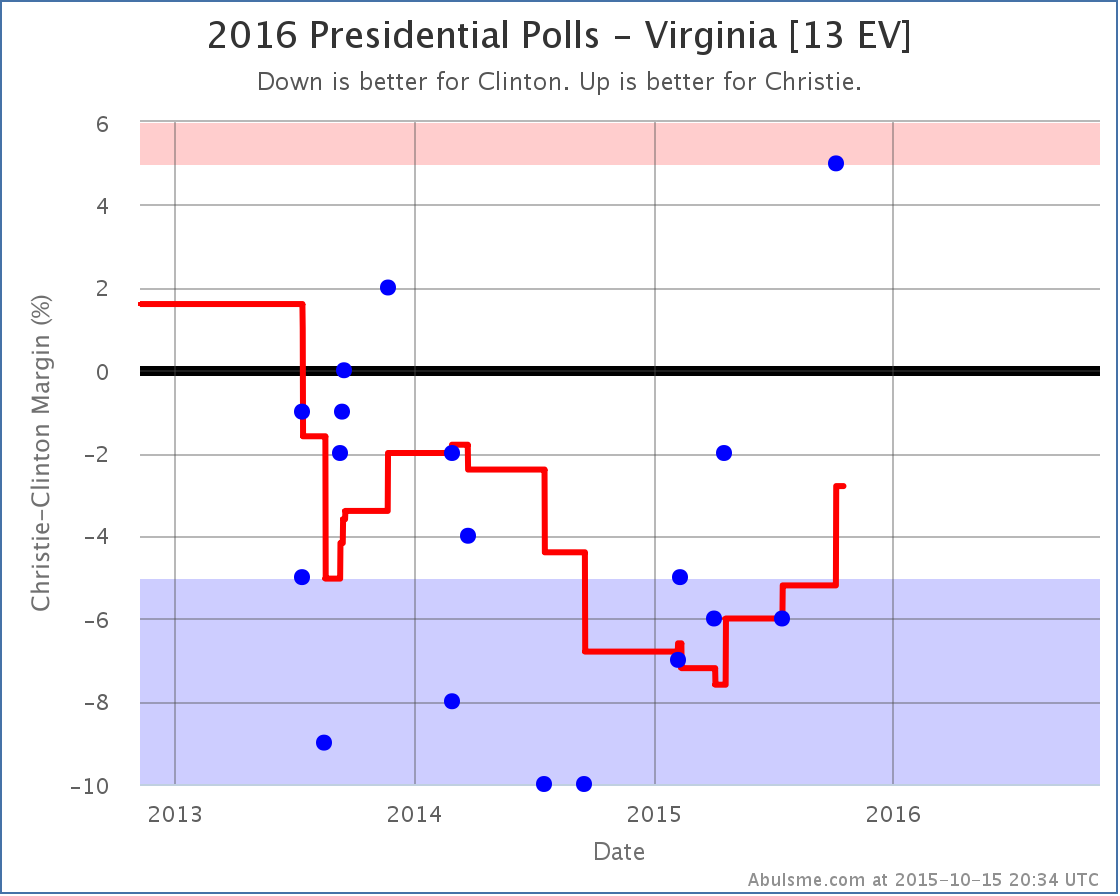
This drops Clinton’s lead against Christie in Virginia to only 2.8%, making the state once again a “swing state” that could go either way.
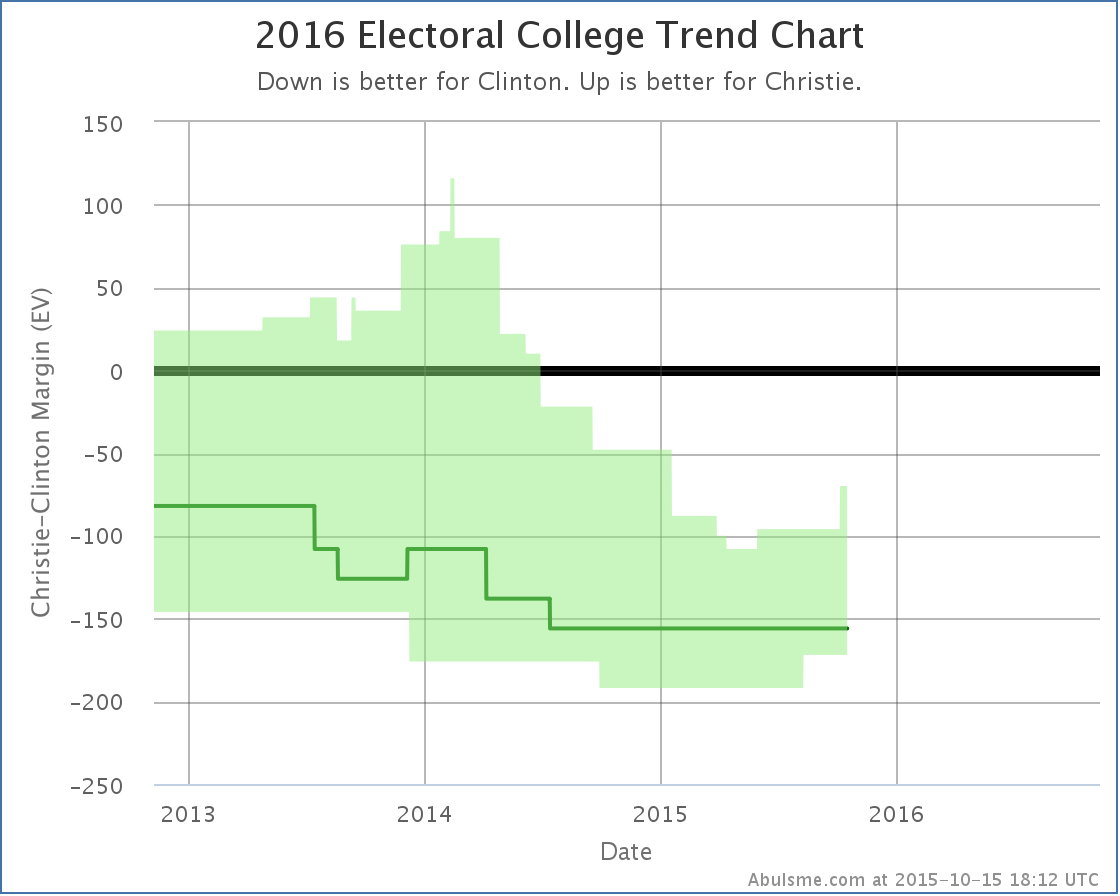
Christie’s best case, if he wins all of the close states, is now to lose by 70 electoral votes. His expected case is still to lose by 156 electoral votes. Unlike Bush, Christie is not competitive with Clinton at the moment. Things can change quickly though, so you never know! But with Christie at 1.9% in the RCP average of national Republican polls, I’m not sure if Christie will have a chance to find out.
390.1 days until the polls start to close!
Note: This post is an update based on the data on ElectionGraphs.com. All of the charts and graphs seen here are from that site. Graphs, charts and raw data can be found there for the race nationally and in each state for every candidate combination that has been polled at the state level. In addition, comparisons of the best polled candidate combinations both nationally and each in each state are available. All charts above are clickable to go to the current version of the detail page the chart is from, which may contain more up to date information than the snapshots on this page, which were current as of the time of this post. Follow @ElecCollPolls on Twitter for specific poll details as I add them. And like Election Graphs on Facebook!
This week on the Curmudgeon’s Corner podcast, Sam and Ivan talk about Russia’s involvement in Syria, the chaos around the race for Speaker of the House, and of course the weekly rundown of the 2016 Presidential race. In the lightning round we spend way more than the allotted 2 minutes on self driving cars, but also touch on Jade Helm, drug prices, singing Happy Birthday, and more! Oh yeah, we also mention the coming apocalypse that will destroy us all!
Click to listen or subscribe… then let us know your own thoughts!
Recorded 2015-10-09
Length this week – 1:53:43
1-Click Subscribe in iTunes
View Podcast in iTunes
View Raw Podcast Feed
Download MP3 File
Follow the podcast on Facebook
Show Details:
- (0:00:15-0:05:33) But First
- (0:06:36-0:28:07) Syria and Russia
- Who is Russia Targeting?
- For Domestic Consumption?
- Good or bad for Russia?
- Accidental Escalation?
- US Reaction
- (0:28:45-0:48:19) Speaker of the House
- How the speaker election works
- McCarthy Out
- Paul Ryan?
- The other options
- (0:49:27-1:27:31) Election 2016
- Election Graphs Analysis: Rubio beats Clinton!
- Election Graphs Analysis: Others vs Clinton
- Continued Clinton Deterioration
- RCP vs Pollster
- Democratic Race
- Republican Race
- Carson/Bush Dumb Comments
- (1:28:46-1:53:23) Lightning Round
- Jade Helm
- Apocalypse?
- Self Driving Cars
- Predatory Drug Price Increase
- Happy Birthday Copyright
- Afghanistan Child Abuse
- Movie Serial: Radar Men from the Moon
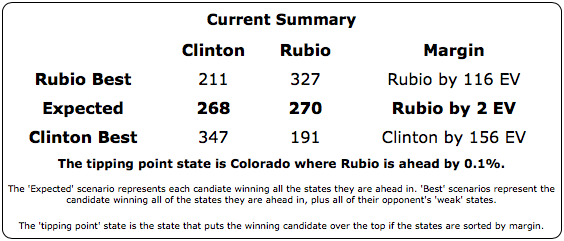
This is probably the most significant update I’ve posted since launching this analysis in November. For the first time, one of the Republicans with significant amounts of polling is actually leading Clinton. Specifically, in Clinton vs Rubio, the “expected result” where each candidate wins all the states where they currently lead in my polling average, is now Clinton 268 to Rubio 270. That is a narrow win, but that is a win.
Since the spring, almost every update has been bad news for Clinton, but the collapse here has been more rapid than that. As recently as July, Clinton was leading Rubio by 156 electoral votes in my analysis. In less than three months, this lead completely evaporated. It is a long way until the election still. And some deterioration was expected. But this trend for Clinton is dramatic. Has she reached the bottom yet? Absent additional major negative revelations, she must be close to a floor… but there is no slowing of this trend visible yet. Things just get worse and worse for Clinton. (At least vs Rubio and Bush… for other opponents, either the trend is less dramatic, or there is just not enough recent state level polling data to draw good conclusions yet.)
Clinton vs Rubio
Lets look into the details. First of all, Pennsylvania:
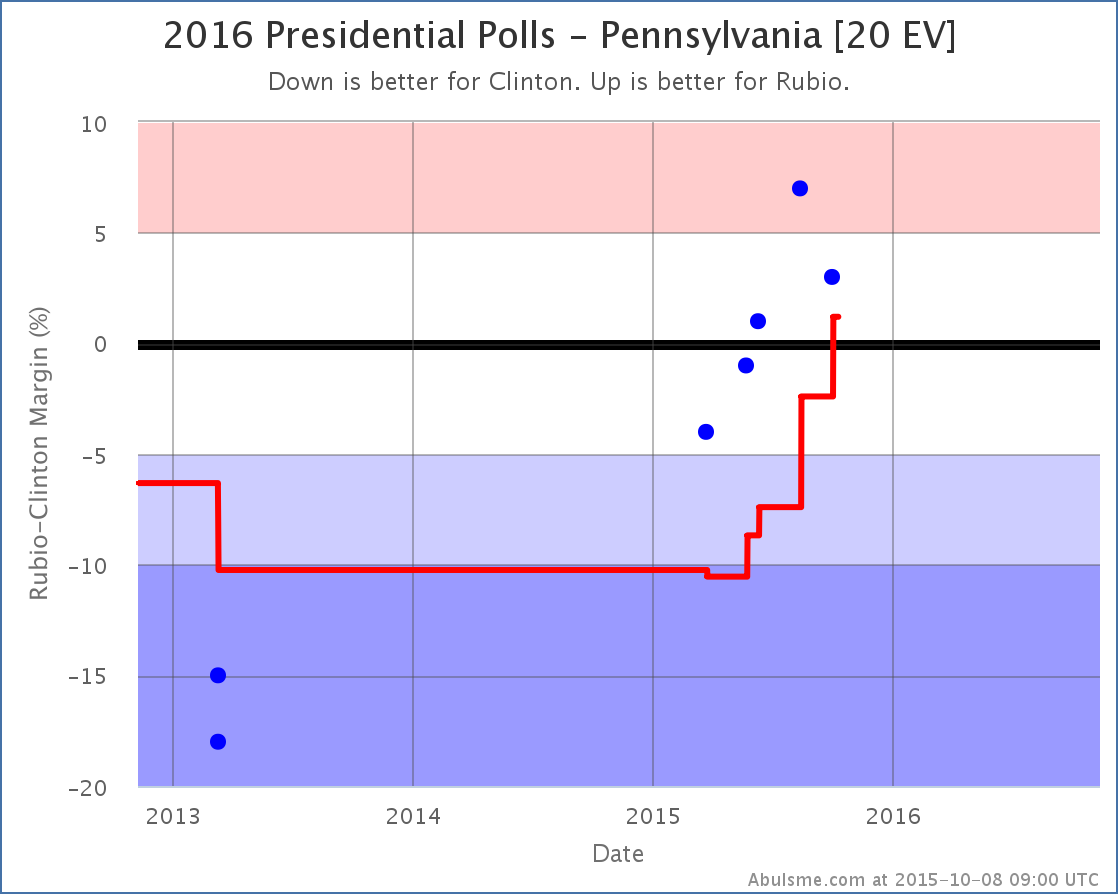
Pennsylvania has not been as heavily polled as some other states, the poll average still covers 6.6 months, but the trend here resembles the trend in many other states, with Clinton losing ground with almost every poll. With this last poll, the average was pulled over to Rubio’s side of the center line. Pennsylvania’s 20 electoral votes was enough to make Rubio the overall winner. This was the big change that caused today’s headline.
Between Pennsylvania’s move, and a smaller move in Ohio that didn’t cross category lines, the tipping point of course moved too:
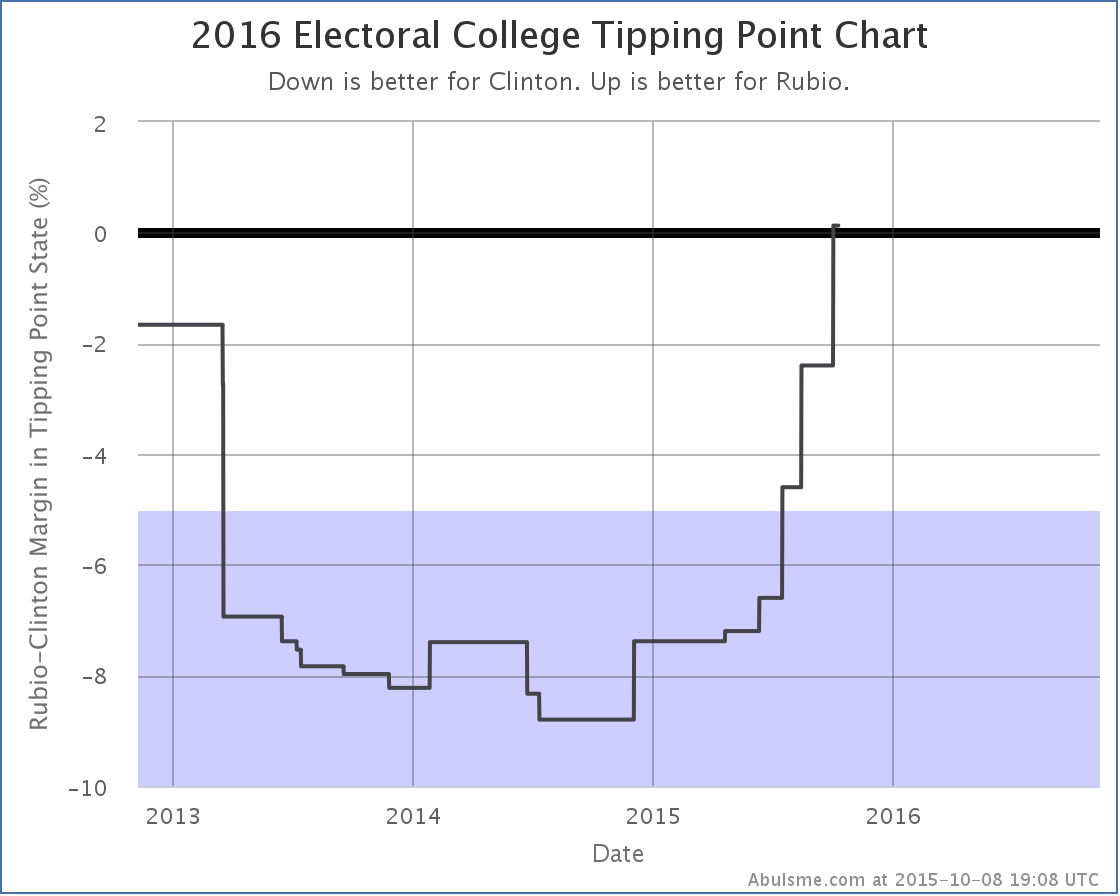
A year ago the tipping point was at 8.8% in Clinton’s favor. It is now Rubio by 0.1%. That is a razor thin margin, but it is a Rubio win.
Which brings us to the fact that there actually was one positive thing for Clinton in the latest Clinton vs Rubio results. Florida.
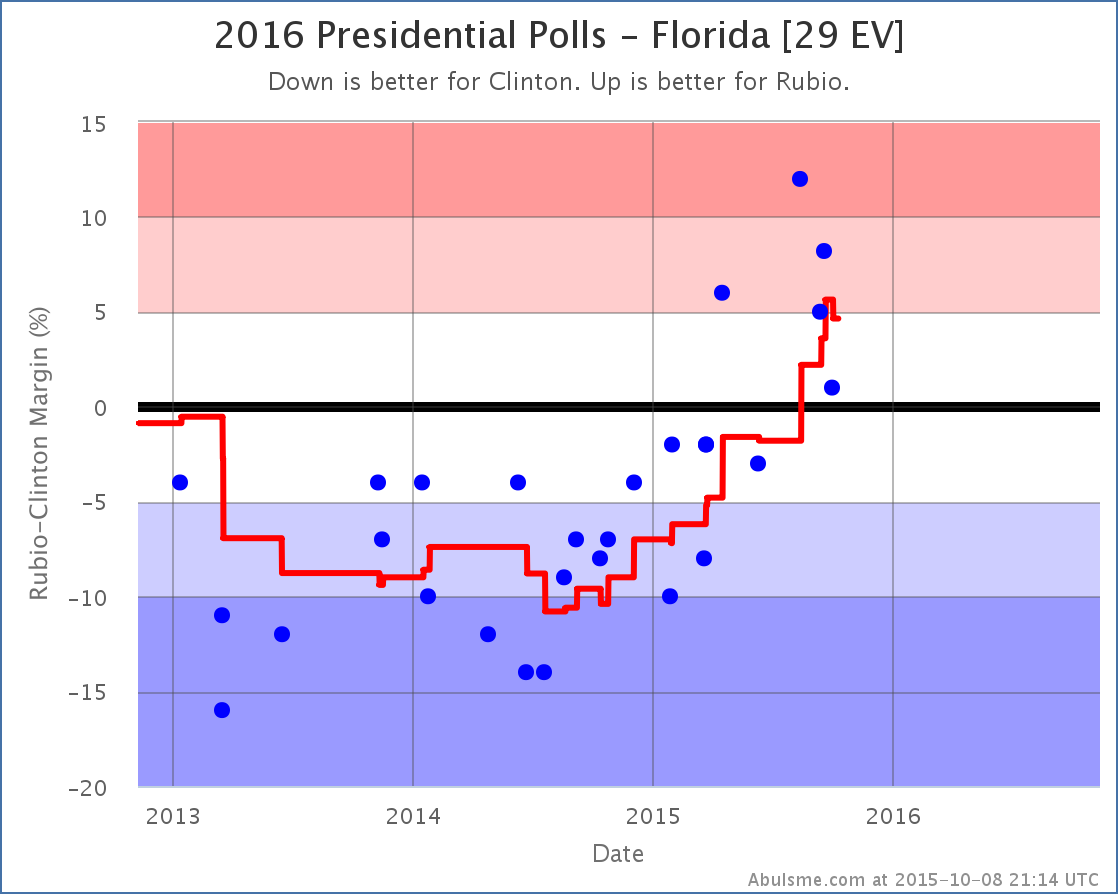
The poll average in Florida actually moves a little toward Clinton with the latest poll, bringing it to a 4.6% Rubio lead. This once again puts Florida in the “could go either way” category based on my classifications, and so improves Clinton’s best case.
With all of these changes, here is the new “bubble”:
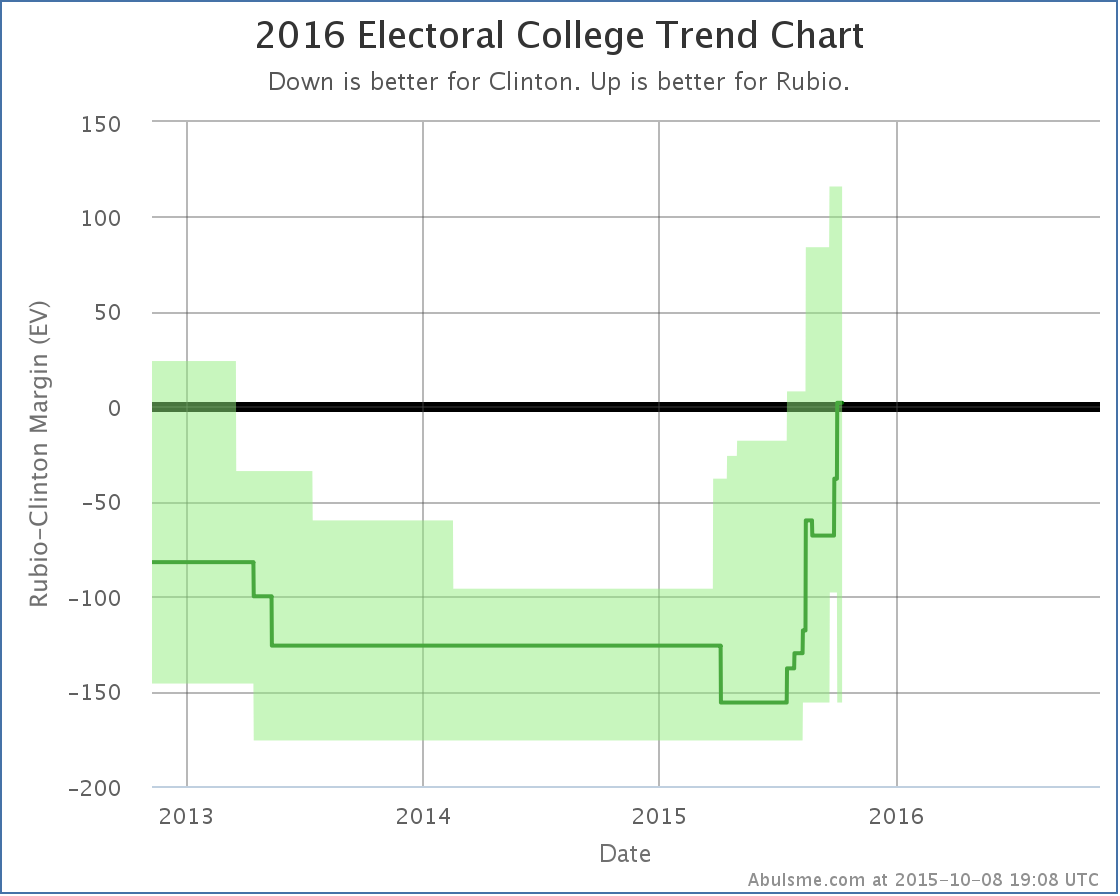
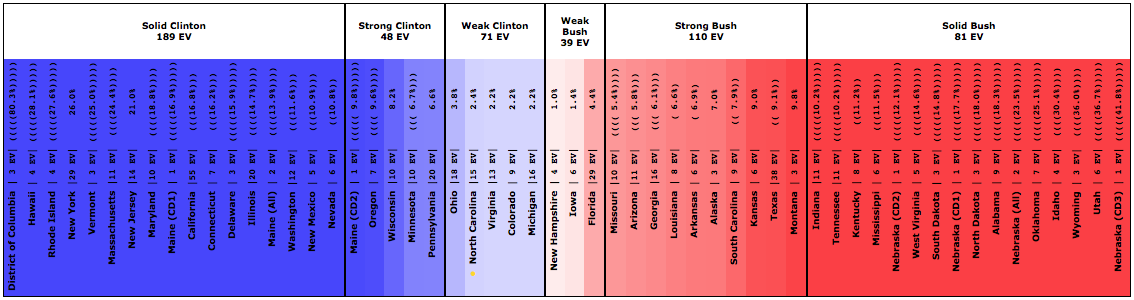
One of the most surprising things about this chart, especially compared to how things looked a year ago, is just the height of that bubble… the range of possible outcomes that are reasonable given the current state of polling. Right now the summary looks like this:
And the state spectrum:
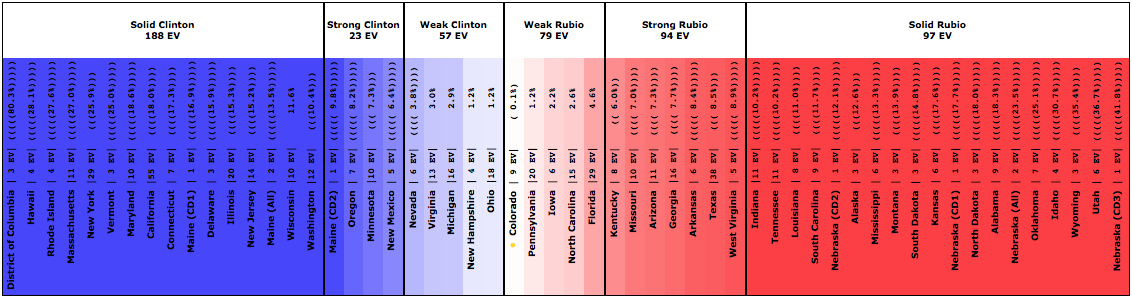
There are now TEN states where the polling is close. 136 electoral votes. Everything from Clinton winning by 156 to Rubio winning by 116 is plausible given only minor moves in the polls. This is a huge range of possible outcomes here.
Right now, the tipping point is right smack in the middle of those states, five on each side of the line… with a margin in the tipping point state of only 0.1% and Rubio ahead by only TWO electoral votes. The only way this could be closer is if we were actually looking at a 269-269 tie.
Right now, 13 months from the election, Clinton vs Rubio is as close to an even race as you could possibly imagine. But with the huge number of close states, it is “close” in the sense of too close to call, but we can’t rule out the possibilities of either candidate winning by a significant margin! There are just too many states that could go either way. (Having said that, results closer to the middle of the range are indeed more likely than those at the edges. Having ALL the close states go to one candidate or the other is extremely unlikely.)
A lot can and will happen in the next year… it is certainly possible that neither of these two candidates end up as the nominees. But this can’t be where Clinton hoped to be at this point. She wanted to be seen as not just inevitable for the Democratic nomination, but with a very healthy lead in the general election.
That is not what is happening.
The question now is if Rubio is able to start strengthening this into a clear lead, instead of just a toss up. Can he start flipping Ohio? New Hampshire? Michigan? If current trends continue, it would not be surprising…
Clinton vs Bush
Although the big news was in Clinton vs Rubio, there was also a change in Clinton vs Bush. It also favored the Republican.
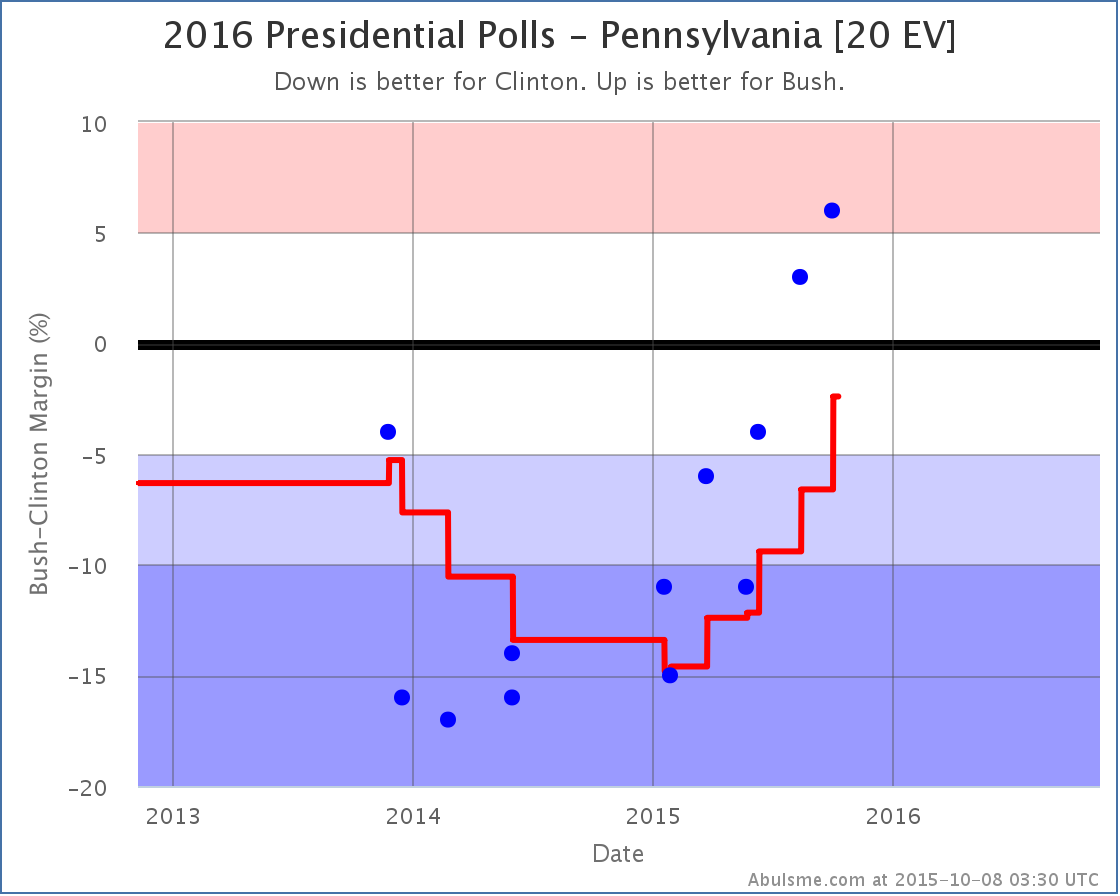
Bush is a bit behind Rubio in his Pennsylvania polling against Clinton, but it has also been consistently improving for months. With today’s new poll, Clinton’s lead drops to 2.4%, putting Pennsylvania in the swing state category, and improving Bush’s best case.
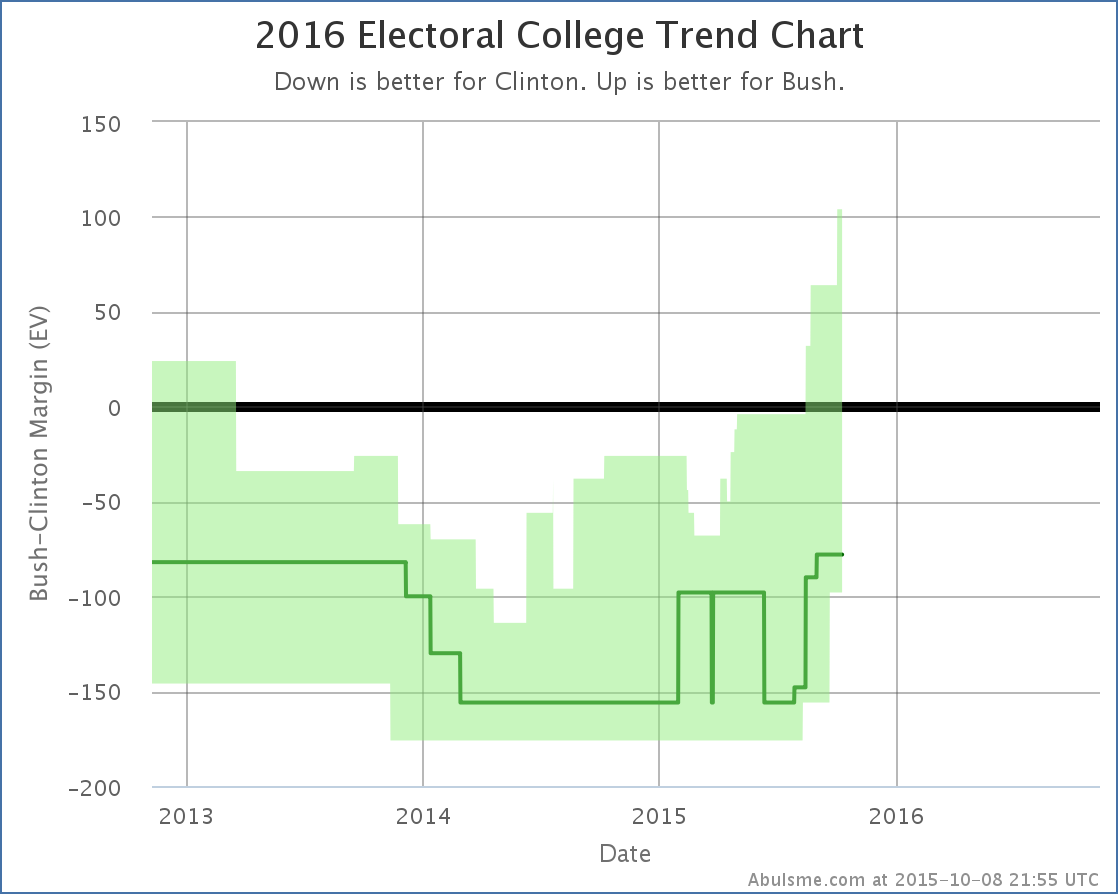
Pennsylvania moving into the realm of the possible is that spike in the upper right. Bush’s best case is now to win by 104 electoral votes. The range of possibilities isn’t quite as wide as with Rubio, but at 101 electoral votes in play, it is still pretty wide.
None of this is a prediction of what will happen in November 2016. We are still too far away for that. It is just a snapshot of where we are today.
397.1 days until polls start to close. A lot of drama yet to come in those days.
Note: This post is an update based on the data on ElectionGraphs.com. All of the charts and graphs seen here are from that site. Graphs, charts and raw data can be found there for the race nationally and in each state for every candidate combination that has been polled at the state level. In addition, comparisons of the best polled candidate combinations both nationally and each in each state are available. All charts above are clickable to go to the current version of the detail page the chart is from, which may contain more up to date information than the snapshots on this page, which were current as of the time of this post. Follow @ElecCollPolls on Twitter for specific poll details as I add them. And like Election Graphs on Facebook!
Another day, another state moving away from Clinton. This time it is Florida moving toward Bush:
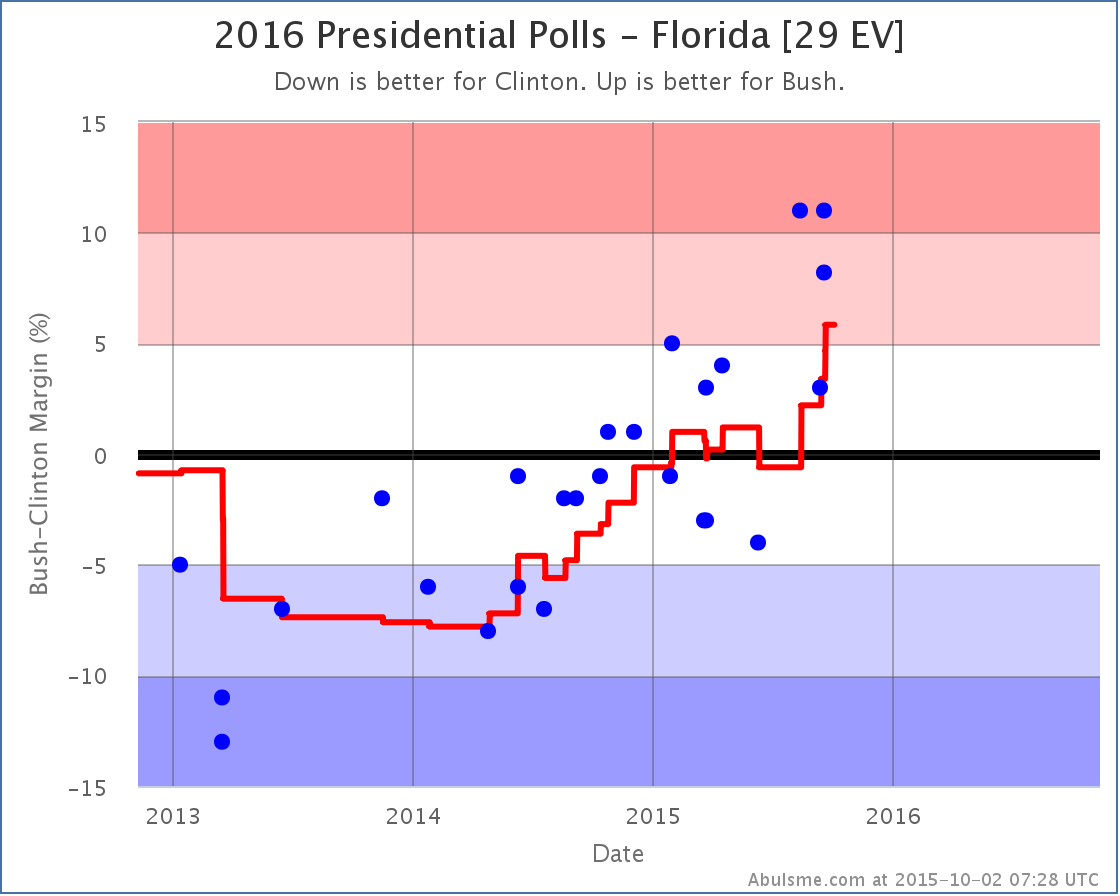
In a pattern remarkably similar to Rubio’s, Bush has consistently been improving against Clinton in Florida for over a year. After a bit of a pause for a few months, that trend has now accelerated. As of the last poll the average goes to Bush +5.8%. This takes Florida out of the “close” category and out of what I consider to be Clinton’s “best case”.
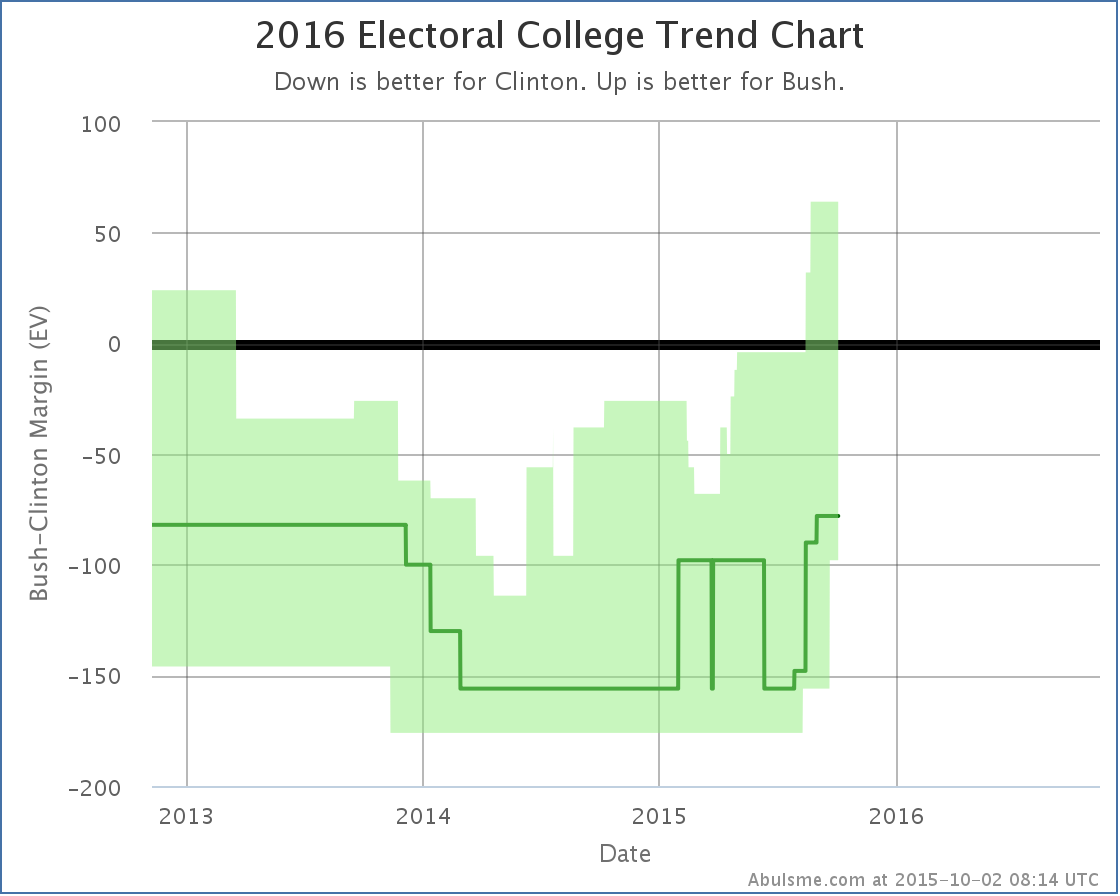
Florida slipping out of Clinton’s reach is that notch in the bottom right of the “bubble” above. Clinton’s best case is now worse for her than her WORST case was back in June 2014. Although I predicted back in November that Clinton was probably at her high water mark and would fall from there, the degree of the fall has been dramatic. The open question is of course, “When does the bleeding stop?”. Right now Clinton is still ahead, although it is much closer than it once looked. But she is only a state or two away from actually being behind. (At least against Bush and Rubio.)
403.4 days until polls start to close on Election 2016.
Note: This post is an update based on the data on ElectionGraphs.com. All of the charts and graphs seen here are from that site. Graphs, charts and raw data can be found there for the race nationally and in each state for every candidate combination that has been polled at the state level. In addition, comparisons of the best polled candidate combinations both nationally and each in each state are available. All charts above are clickable to go to the current version of the detail page the chart is from, which may contain more up to date information than the snapshots on this page, which were current as of the time of this post. Follow @ElecCollPolls on Twitter for specific poll details as I add them.
It is getting boring to keep saying “Republican getting stronger against Clinton”, but it is time for yet another update saying just that. As has been common lately, the Republican in question is Rubio, so lets look at these moves:
North Carolina
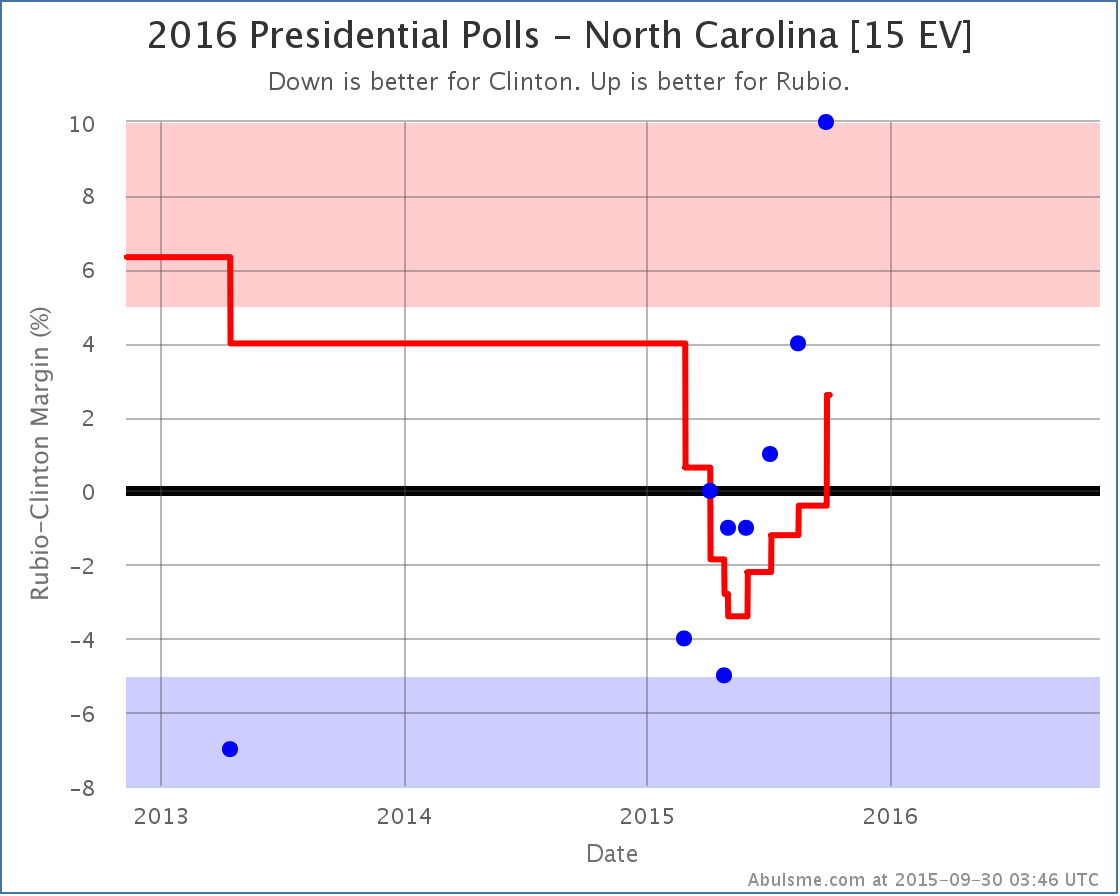
Look at that trend! It just gets worse and worse for Clinton. Every new poll in the last few months has been worse than the poll before. And with the latest, the average flips to Rubio’s side of the line.
North Carolina was never going to be a blow out for Clinton, but it was looking for awhile that she was in a good position to pull out a narrow win. That possibility seems to be evaporating quickly.
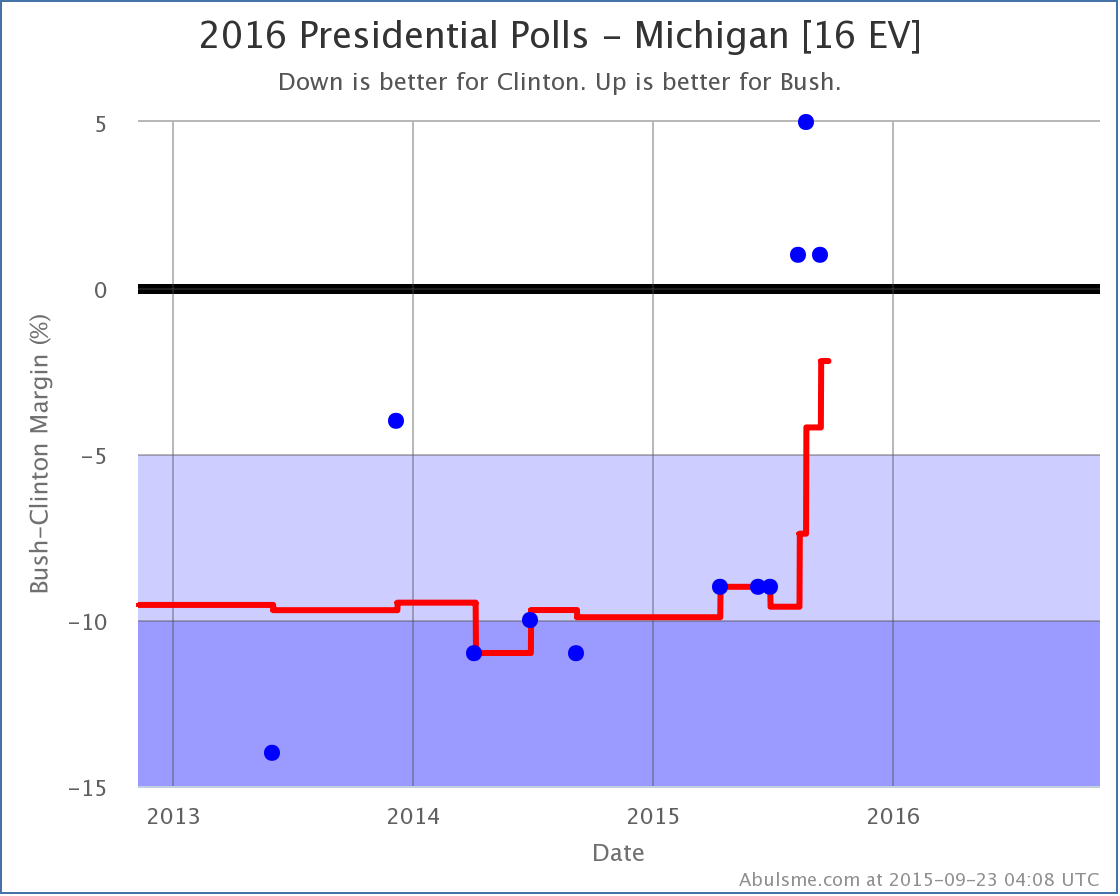
Michigan
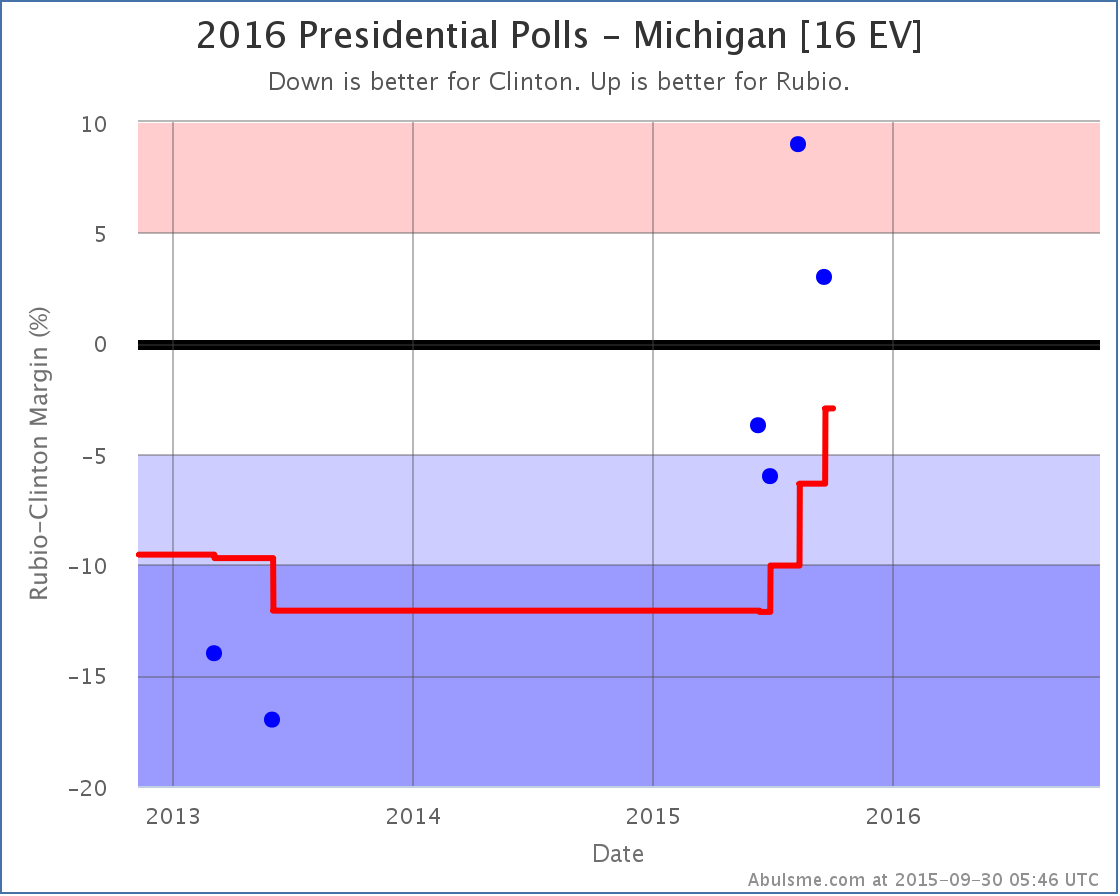
There are less polls to back it up, but the move in Michigan is potentially more dramatic. In a few months the average has gone from a strong Clinton lead, to Michigan essentially being a toss up.
Once again, not a good trend for Clinton. Michigan has not gone Republican since voting for George HW Bush in 1988. In 5 of those 6 elections the winning margin for the Democrats was over 5%. In two of them it was over 10%. A close Michigan means a Clinton in trouble.
National Overview


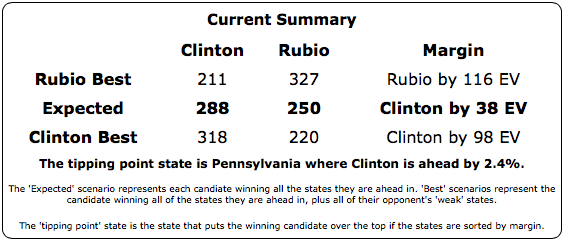
Yes, if everybody wins the states where they are leading in my poll average, Clinton still wins… barely. But there are a HUGE number of states where it is close. In this matchup, nine states are in play and the range of possible outcomes is very wide. Right now Rubio’s best case (if he sweeps all the close states) is actually better than Clinton’s best case (if she sweeps the close states).
Clinton still has an advantage here, but just by the slimmest of margins. There is a long way to the election, but for the moment, at least in the Clinton vs Rubio matchup, this is a close race…
Other Candidates
So Rubio is doing well against Clinton, and that is the only one of the five best polled candidate combinations with a change today, but a quick look at the comparison is still useful.
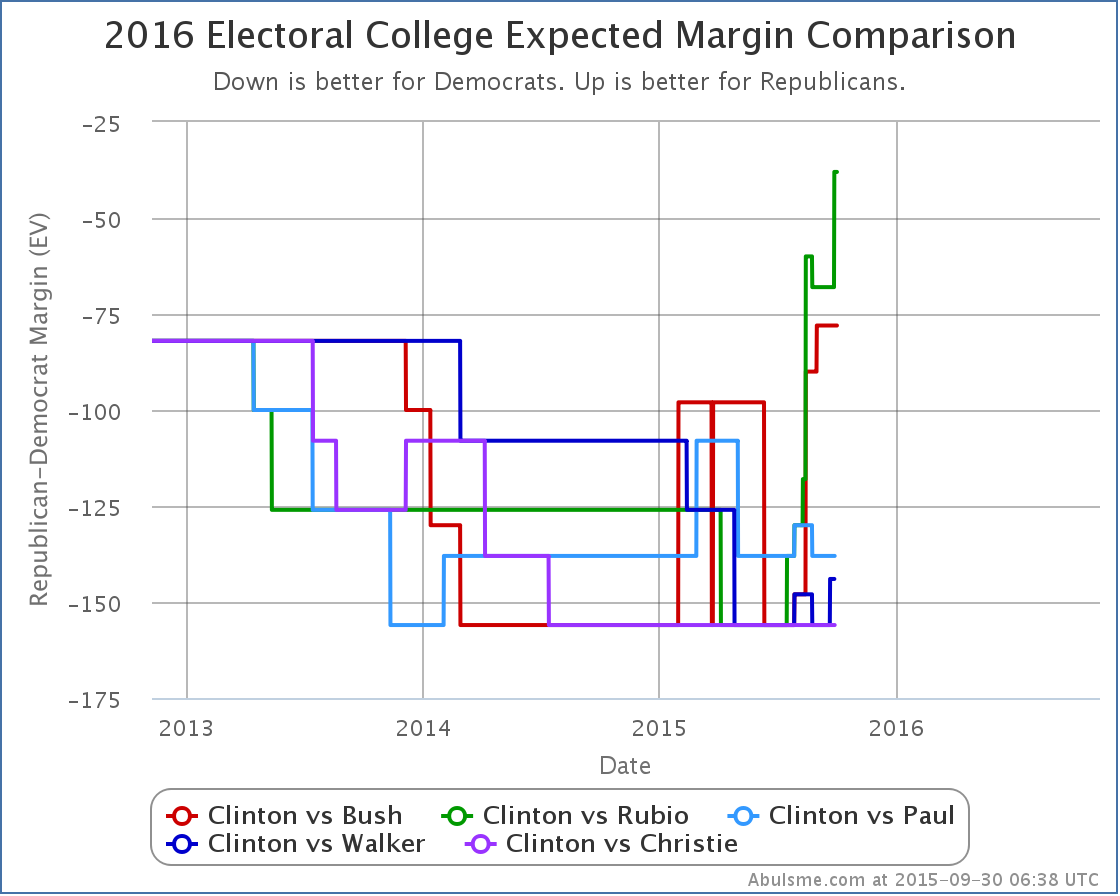
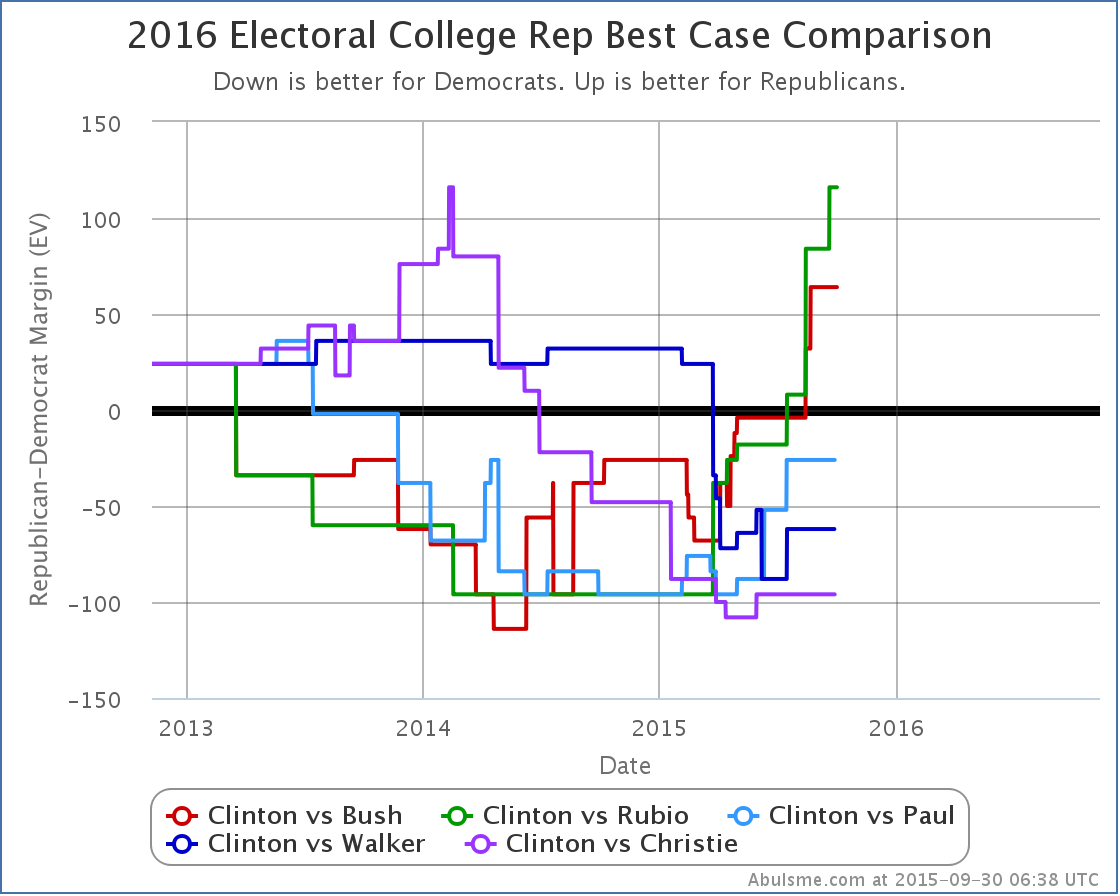
Highlighting these two comparisons specifically because of the Rubio changes today, but similar trends show up for the other comparisons. Of the five best polled combinations, Bush and Rubio are standing out and have been dramatically improving their positions vs Clinton. Paul, Walker and Christie… have not. At least not lately. Of course, Walker has already dropped out at this point, and Christie and Paul are on life support, with their national Real Clear Politics polling averages at 3% or less right now. So they just aren’t getting the attention… or the polling volume lately… of Bush and Rubio.
As I’ve mentioned before, other candidates are getting a lot more attention now, but they are still way behind these five in the arbitrary polling quality metric I use. They just haven’t had enough sustained polling to get a comparable picture yet. That will change if the folks like Trump and Carson and Fiorina remain viable and folks like Paul, Walker and Christie fade away. Same thing for Sanders and Biden. It just takes a bit of time to get enough good state polls to start paying serious attention to the results in an analysis like this.
405.1 days until polls start to close.
Note: This post is an update based on the data on ElectionGraphs.com. All of the charts and graphs seen here are from that site. Graphs, charts and raw data can be found there for the race nationally and in each state for every candidate combination that has been polled at the state level. In addition, comparisons of the best polled candidate combinations both nationally and each in each state are available. All charts above are clickable to go to the current version of the detail page the chart is from, which may contain more up to date information than the snapshots on this page, which were current as of the time of this post. Follow @ElecCollPolls on Twitter for specific poll details as I add them.
Aside from that one blip of good news in August every single update I’ve posted in many months has been more bad news for Clinton. This update is no exception, with two changes worth noting, both in favor of the Republican.
Clinton vs Bush
The new poll in North Carolina didn’t shift move the state to a new category, but the move from a Clinton lead of 2.4% down to a Clinton lead of 1.3% moved the tipping point, which had been North Carolina. With North Carolina shifting Bushward, the tipping point becomes Colorado, where Clinton is ahead by 2.2%.
This is a relatively small blip upward for the tipping point, but it continues the trend. This race just keeps getting closer. Remember, the tipping point is how far polls have to move nation wide in order to flip the result of the election. The gap is now only 2.2%. That is tiny. A 2.2% lead can disappear over night, or be an illusion cased by a bias in the polls. Right now, Bush and Clinton are effectively neck and neck. Yes, Clinton has a lead, but it is extremely narrow.
The spectrum of the states now looks like this:
Clinton’s buffer is down to just Colorado, Michigan and North Carolina, all states where her lead is less than 2.2%. We’re only a few Republican leaning polls in those three states away from having a Republican in the lead for the first time since I launched this site.
Clinton vs Walker
Well, he dropped out. But a poll in Iowa that included him wrapped up just before his announcement. And that poll was good for Walker. So, one last hurrah…
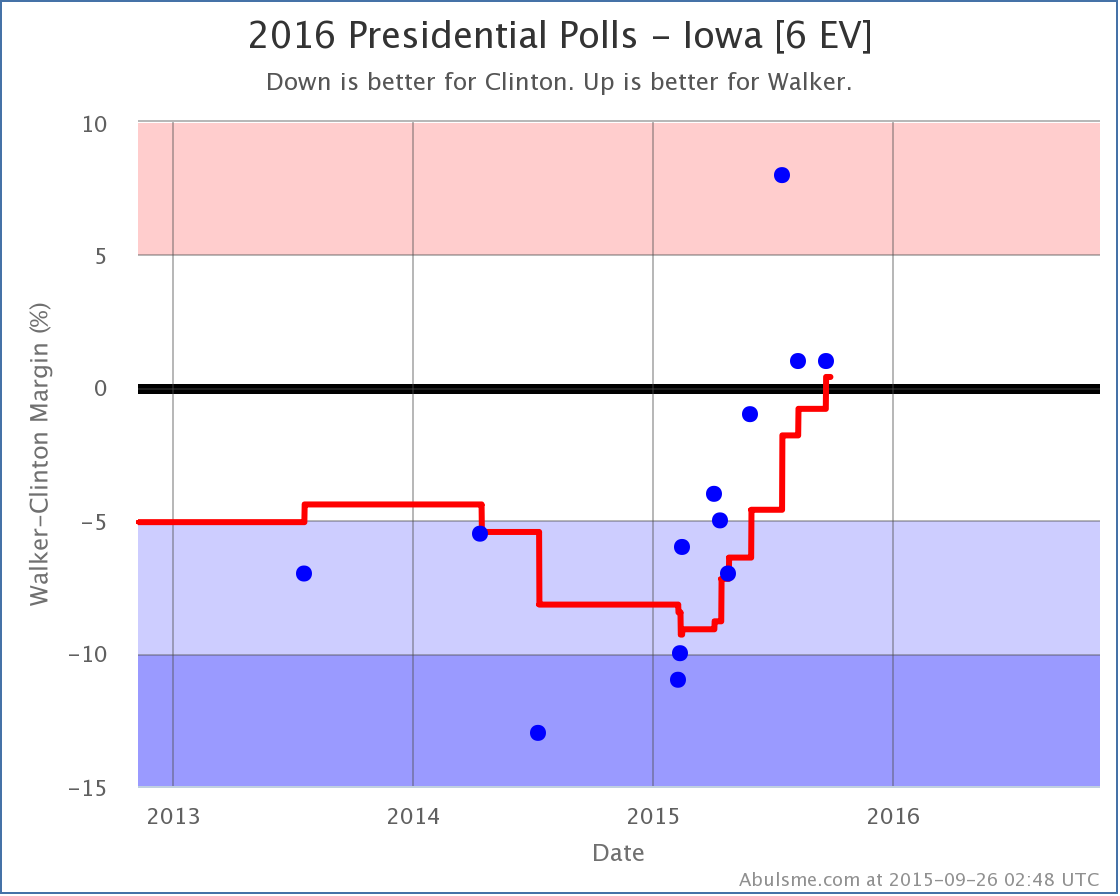
With this last poll… and it will be surprising if there are any more with Walker… Walker takes a narrow lead vs Clinton, and so moved Iowa into his column, increasing his “expected” result against Clinton…
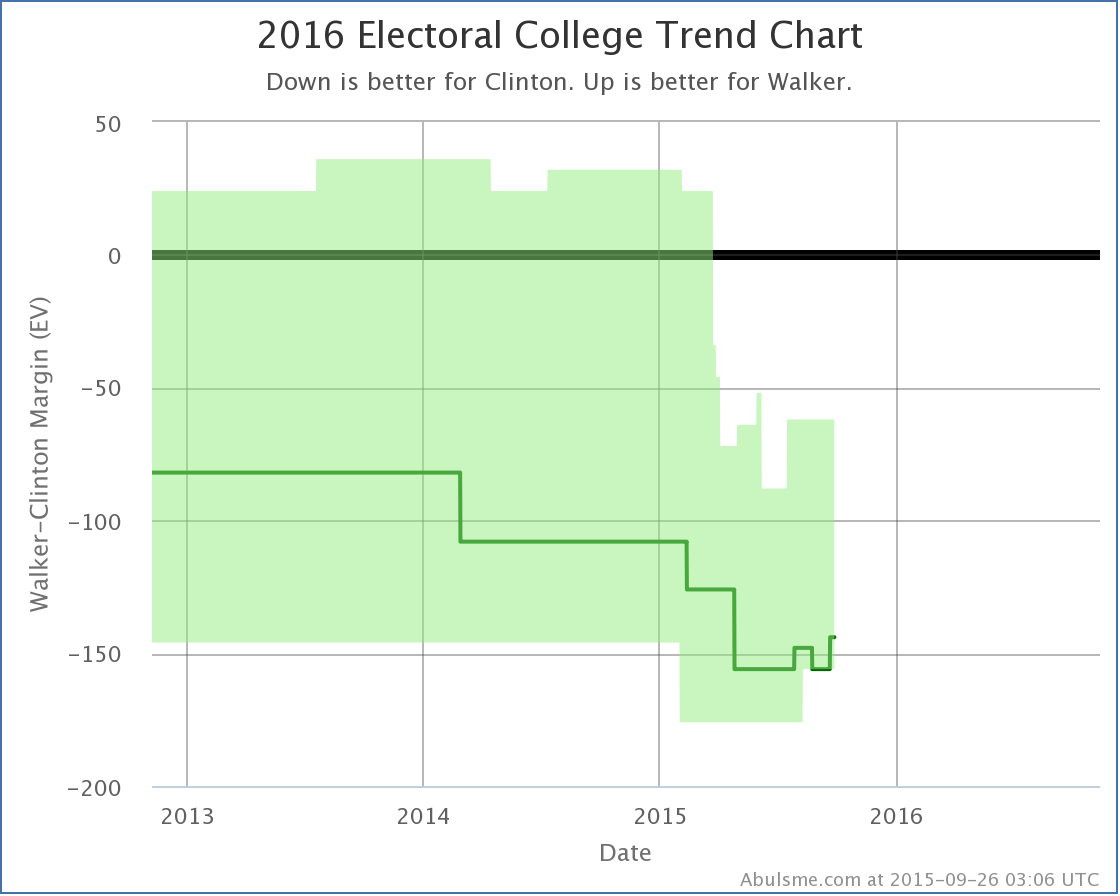
He increases his expected result to… losing by 144 electoral votes! Well, OK, Walker wasn’t the most competitive of the Republican candidates against Clinton.
Goodbye Walker.
409.8 days until polls start to close.
Note: This post is an update based on the data on ElectionGraphs.com. All of the charts and graphs seen here are from that site. Graphs, charts and raw data can be found there for the race nationally and in each state for every candidate combination that has been polled at the state level. In addition, comparisons of the best polled candidate combinations both nationally and each in each state are available. All charts above are clickable to go to the current version of the detail page the chart is from, which may contain more up to date information than the snapshots on this page, which were current as of the time of this post. Follow @ElecCollPolls on Twitter for specific poll details as I add them.
Clinton’s deterioration against the Republican field continues. There are two changes of note today, both show Republicans getting stronger against Clinton.
Clinton vs Rubio

Clinton has now not been ahead in a Clinton vs Rubio poll in Florida since June. And four of the five polls in the average show Rubio leads of 5% or more. With the latest one of these polls, my poll average now shows Rubio’s lead in Florida as 5.6%. That takes Florida out of the “close state” category. So Clinton’s “best case” no longer includes winning Florida.
The scale of this collapse in Florida is particularly striking. As recently as last October, Clinton had a greater than 10% lead against Rubio in Florida. This put Florida in the “Solid Clinton” category. But over the course of the last year, that lead evaporated. And now Rubio is not just ahead, but significantly ahead. Now, this chart itself is a perfect example of how much things can change in a year. We are too far away for election day for this to be predictive of what would actually happen in Florida in a Clinton vs Rubio race next year. But this still looks very bad for Clinton.
The new situation summary for Clinton looks like this:
Clinton is still ahead… barely. But it is looking much more like a toss up. A tipping point of 2.4% could literally disappear overnight with the right events happening in the campaign. As recently as March, Rubio’s best case was to lose by 96 electoral votes. Now Clinton vs Rubio is too close to make a confident prediction, and even Clinton’s best case is deteriorating.
Florida is a big state, Florida is important. Clinton being this far behind in Florida is a significant issue for Clinton. Clinton doesn’t NEED Florida to win, but the paths without it are much tighter.
Clinton vs Bush
The latest results in Michigan for Clinton vs Bush don’t change the category of the state. It was “Weak Clinton” before the latest poll, and is “Weak Clinton” after the poll. But the move from Clinton by 4.2% to Clinton by 2.2% moved Michigan past several other states when you order the states by Clinton vs Bush margin, including moving past Ohio, which had been the tipping point state. Without Michigan to the left of Ohio, the tipping point moved from Clinton by 3.8% in Ohio, to Clinton by 2.4% in North Carolina.
Only four very close states, all with margins at 2.4% or less, need to flip to put Bush in the lead. In terms of tipping point, Clinton vs Bush is now tied with Clinton vs Rubio as the two of the five best polled candidate pairs that do the best against Clinton.
(Walker has of course now dropped out, he will likely be replaced in this comparison chart soon.)
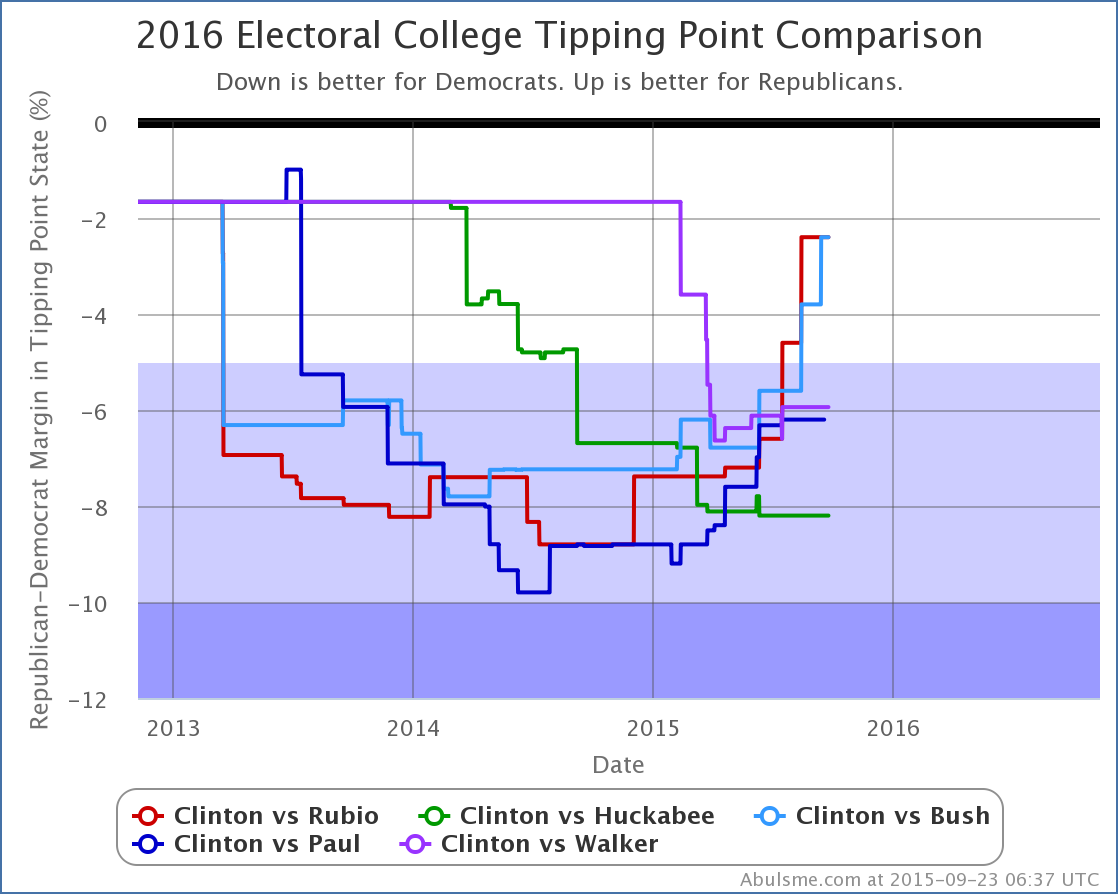
When looking at the tipping point across these five candidate matches, while all but Huckabee made significant gains over Clinton in the last year, it is clear that in the last few months only Rubio and Bush have continued that movement in the last few months… but they have moved things significantly. The picture for the general election is starting to look very different depending on which Republican is up against Clinton.
What about Trump? Carson? Fiorina? Or what about Sanders and Biden? The bottom line is that compared to the candidates above, they simply have not been considered “serious candidates” for long enough to have a significant amount of state level polling. In my ranking of the best polled candidate combinations, Clinton vs Fiorina is #21, Clinton vs Carson is #22, Clinton vs Trump is #23. The highest combination with Sanders is #9. The highest with Biden is #10. You can look at these combinations if you want, but frankly there simply has not been enough polling yet on the state level to get a good picture of what those races really would look like, so interpret anything you see there with extreme caution.
412.4 days until polls start to close.
Note: This post is an update based on the data on ElectionGraphs.com. All of the charts and graphs seen here are from that site. Graphs, charts and raw data can be found there for the race nationally and in each state for every candidate combination that has been polled at the state level. In addition, comparisons of the best polled candidate combinations both nationally and each in each state are available. All charts above are clickable to go to the current version of the detail page the chart is from, which may contain more up to date information than the snapshots on this page, which were current as of the time of this post. Follow @ElecCollPolls on Twitter for specific poll details as I add them.
|
|