This is the website of Abulsme Noibatno Itramne (also known as Sam Minter). Posts here are rare these days. For current stuff, follow me on Mastodon

Categories

Calendar

April 2024
S M T W T F S
 123456
78910111213
14151617181920
21222324252627
282930  

Republicans: Trump sweeps Nebraska and West Virginia

With the final results all but inevitable, these updates will be somewhat mechanical absent something unexpected happening.

After Indiana, Trump needed 36.02% of the remaining delegates to win.

In Nebraska and West Virginia, Trump seems to have gotten all 70 of the available delegates. (There may end up being some oddness due to West Virginia geographic restrictions on delegate allocation that shifts this slightly.)

In other changes since Indiana due to uncommitted delegate preference changes in American Samoa and Louisiana as well as Louisiana’s Rubio delegates moving to Trump, there were net changes of: Trump +14, Cruz -3, Rubio -5.

So total change since Indiana: Trump +84, Cruz -3, Rubio -5

So Trump actually got 111% of the delegates since Indiana. (Over 100% is possible since he actually took delegates from his opponents as well as collecting “new” delegates.)

So Trump obviously well exceeded the required numbers to be on pace for a win.
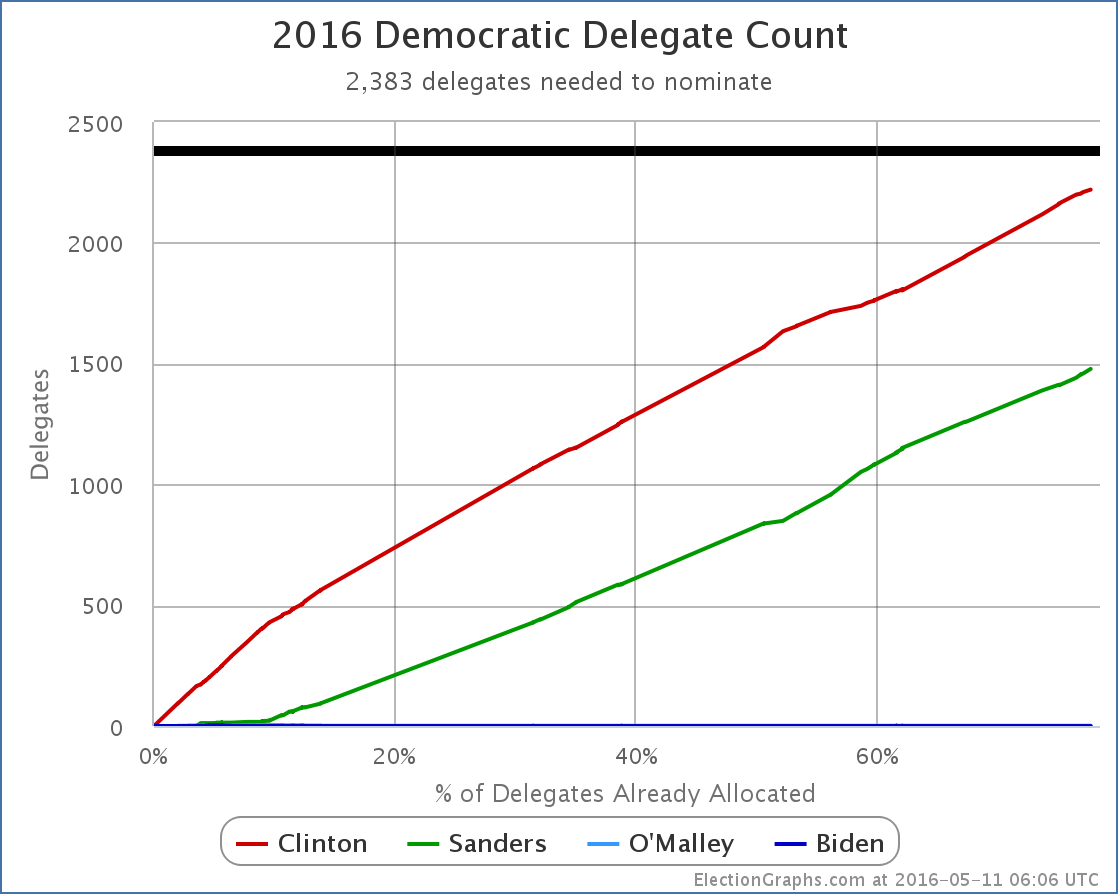
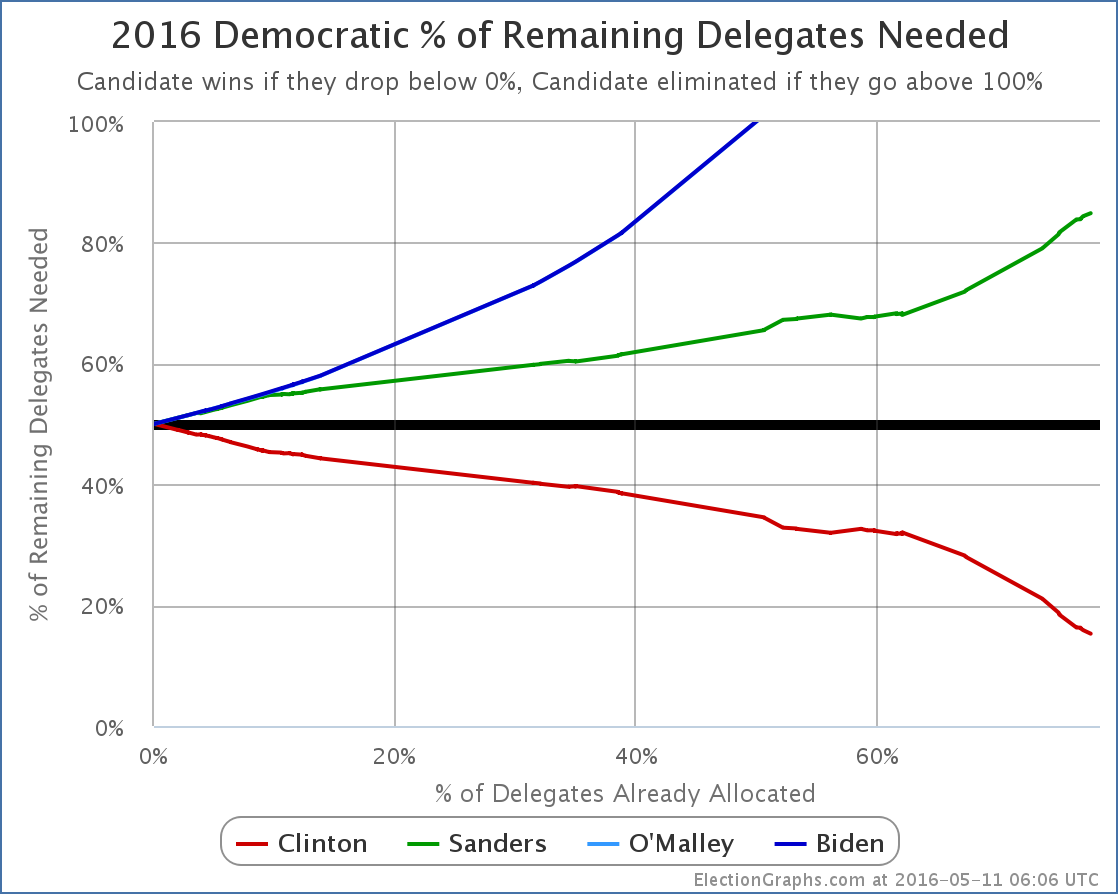
Updated graphs:

chart-139

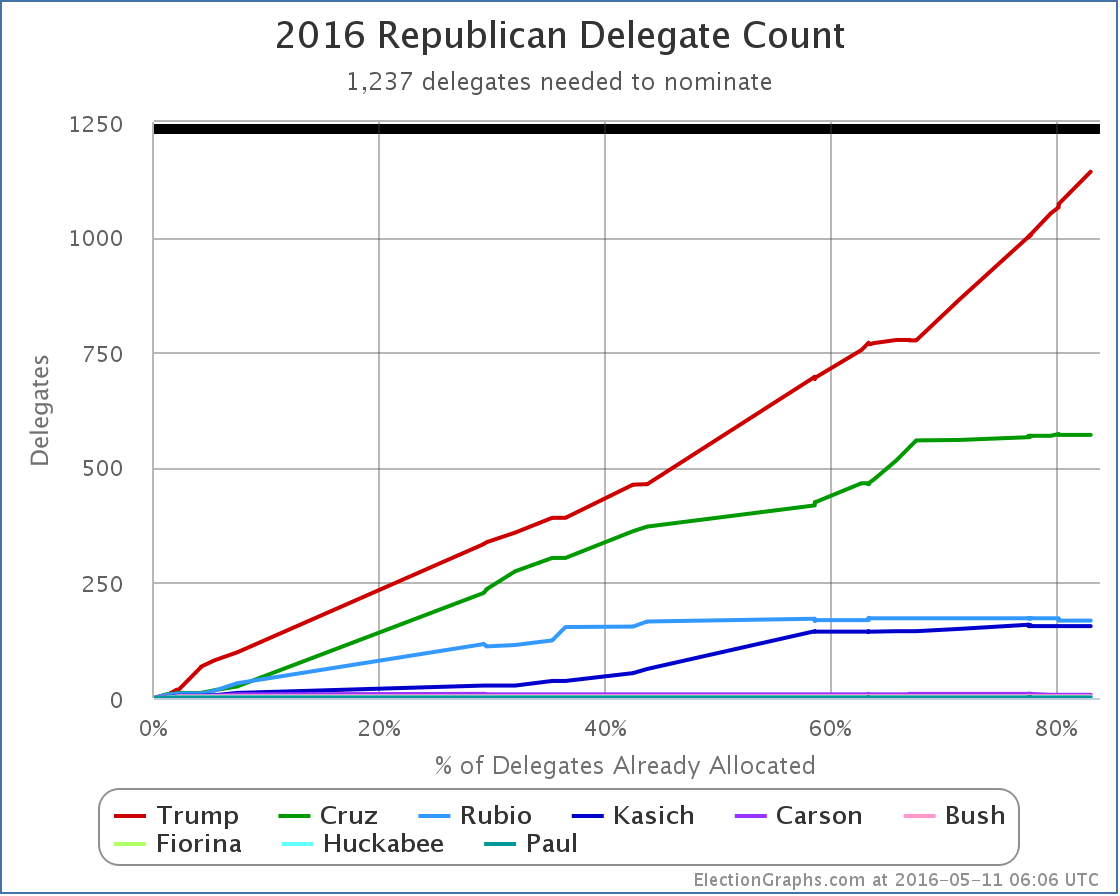
New delegate totals: Trump 1142, Cruz 571, Rubio 168, Kasich 156, Carson 7, Bush 4, Fiorina 1, Huckabee 1, Paul 1.

There are 421 delegates left. Trump needs 95 of them.

chart-140

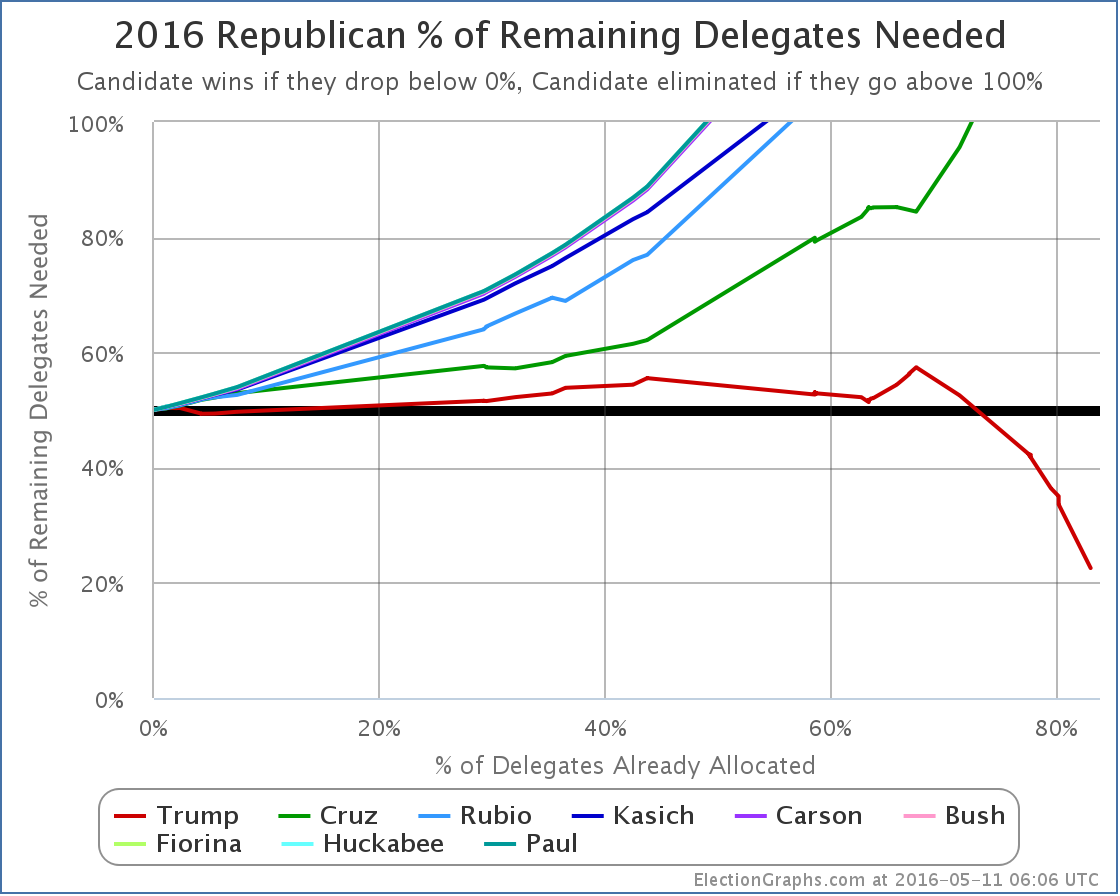
Trump now needs 22.57% of the remaining delegates to win.

Update 2016-05-14 14:31 UTC: Once the geographic restrictions on delegates was finalized and factored in, the final results in West Virginia were officially Trump 30, Kasich 1, Uncommitted 3. Two of the three uncommitted delegates have stated they are for Trump though, so we count this as Trump 32, Kasich 1, TBD 1. Net change from before: Trump -2, Kasich +1.

Update 2016-05-17 17:03 UTC: Update from New York. Net change: Trump -1, Kasich +1.

Update 2016-05-18 17:26 UTC: Update from Guam uncommitted delegates. Net Change Trump +9, Cruz -1.

Note: This post is an update based on the data on ElectionGraphs.com. Election Graphs tracks both a poll based estimate of the Electoral College and a numbers based look at the Delegate Races. All of the charts and graphs seen in this post are from that site. Additional graphs, charts and raw data can be found there. All charts above are clickable to go to the current version of the detail page the chart is from, which may contain more up to date information than the snapshots on this page, which were current as of the time of this post. Follow @ElectionGraphs on Twitter or like Election Graphs on Facebook to see announcements of updates or to join the conversation. For those interested in individual general election poll updates, follow @ElecCollPolls on Twitter for all the polls as they are added.

Democrats: Sanders wins West Virginia and falls further behind

With the final results all but inevitable, these updates will be somewhat mechanical absent something unexpected happening.

After Guam, Sanders needed 84.23% of the remaining delegates to win, Clinton only needed 15.95%.

In West Virginia, Sanders got 18, Clinton got 11.

In other changes since Guam due to superdelegate updates and revisions in the results from Maine, there was a net change of Clinton +1, Sanders +1.

So total change since Guam: Sanders +19, Clinton +12.

That is Sanders 61.29%, Clinton 38.71%.

So Clinton met her target, Sanders did not.

Updated graphs:

chart-137

New delegate totals: Clinton 2220, Sanders 1478, O’Malley 1.

There are 1066 delegates left. Clinton needs 163 of them. Sanders needs 905 of them.

chart-138

Clinton now needs 15.29% of the remaining delegates to win. Sanders needs 84.90%.

Update 2016-05-14 16:09: Superdelegate scan yields net change Clinton +2.

Update 2016-05-17 16:56: Superdelegate scan yields net change Clinton -2.

Update 2016-05-18 14:44: Superdelegate scan yields net change Clinton +1, Sanders -1

Note: This post is an update based on the data on ElectionGraphs.com. Election Graphs tracks both a poll based estimate of the Electoral College and a numbers based look at the Delegate Races. All of the charts and graphs seen in this post are from that site. Additional graphs, charts and raw data can be found there. All charts above are clickable to go to the current version of the detail page the chart is from, which may contain more up to date information than the snapshots on this page, which were current as of the time of this post. Follow @ElectionGraphs on Twitter or like Election Graphs on Facebook to see announcements of updates or to join the conversation. For those interested in individual general election poll updates, follow @ElecCollPolls on Twitter for all the polls as they are added.

Electoral College: 00:45 – WV and SC go as expected

Romney Obama
Romney Best Case 310 228
Current Status 206 332
Obama Best Case 190 348

Still no changes to the three scenarios. No close states called yet.

BTW, I am judging “called states” by CNN.

2012 Republican Delegate Count: West Virginia Update

Charts from the Abulsme.com 2012 Republican Delegate Count Graphs page. When a candidate gets down to 0%, they have clinched the nomination. If they get above 100%, they have been mathematically eliminated. The first chart is by date, the second is by “% of Delegates Already Allocated”. These numbers include estimates of the eventual results of multi-stage caucus processes which will be refined as the later stages occur.

Very minor update today. One West Virginia delegate that was thought to be a Romney delegate turns out to really still be TBD. This makes the total in West Virginia: Romney 23, Santorum 2, TBD 6.

This in turn makes the overall total: Romney 956, Santorum 258, Gingrich 143, Paul 114, TBD 815

Romney’s “% of remaining needed to win” moves from 23.0% to 23.1%.

2012 Republican Delegate Count: NC, IN, WV Results – Santorum Eliminated

Charts from the Abulsme.com 2012 Republican Delegate Count Graphs page. When a candidate gets down to 0%, they have clinched the nomination. If they get above 100%, they have been mathematically eliminated. The first chart is by date, the second is by “% of Delegates Already Allocated”. These numbers include estimates of the eventual results of multi-stage caucus processes which will be refined as the later stages occur.

Yawn! This is so past over it isn’t funny, but I’ll be doing these posts until Romney gets to 1144!

Anyway, the new delegates awarded tonight are:

  • North Carolina – Romney 36, Santorum 6, Paul 6, Gingrich 4
  • Indiana – Romney 27
  • West Virginia – Romney 22, Santorum 2

So that makes the total for today Romney 85, Santorum 8, Paul 6, Gingrich 4.

Hmm. Wonder who won tonight?

With 82.5% of the delegates, Romney did way better than the 29.7% of the delegates he needed to continue on pace for clinching the nomination.

Meanwhile, Santorum finally reached the point where even if he got 100% of the remaining delegates he could not catch up and win.

So now there is only one. But Romney still has to finish mopping up the delegates.

He now only needs 23.0% of the delegates that are left in order to get to 1144. Next up is Oregon on the 15th. Then Kentucky and Arkansas on the 22nd. Then Texas on the 29th. Texas will probably be the state that puts Romney over the top unless he does much worse than expected between now and then.