This is the website of Abulsme Noibatno Itramne (also known as Sam Minter).
Posts here are rare these days. For current stuff, follow me on Mastodon
|
States with new poll data added since the last update: All 50 states, DC, and the Maine congressional districts
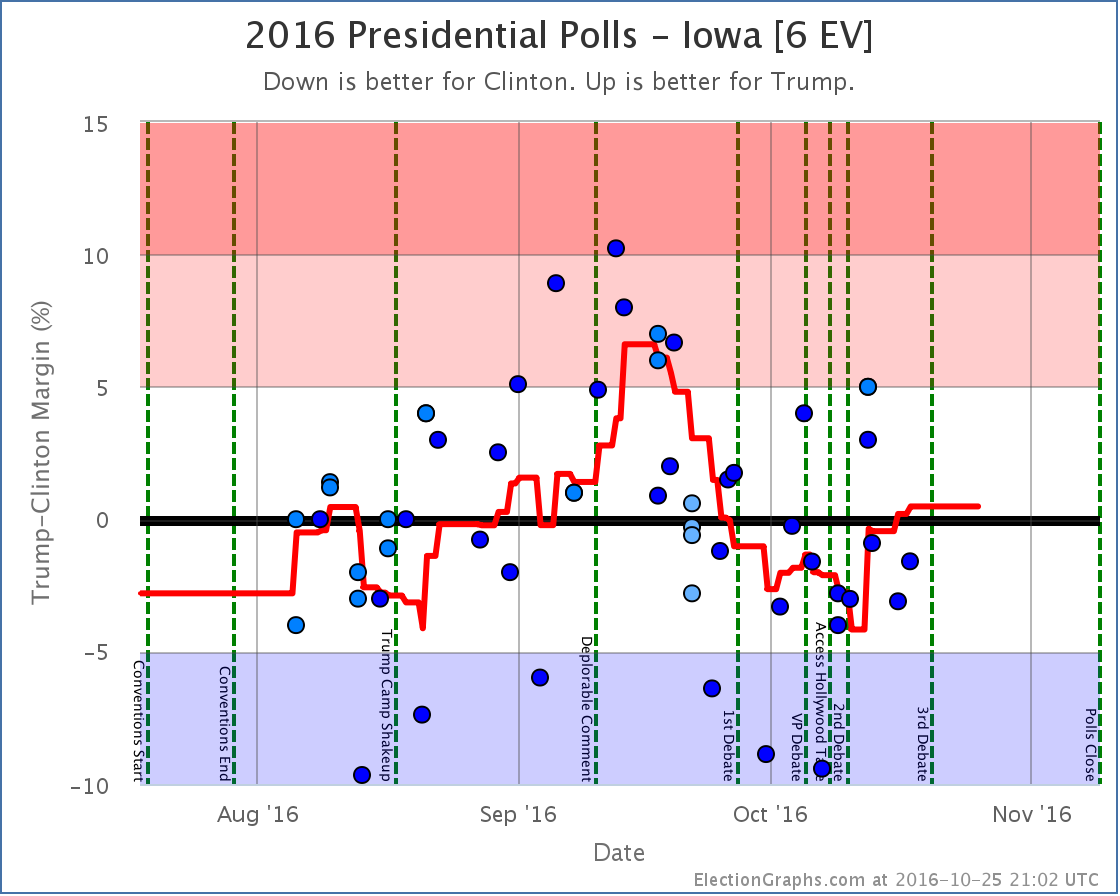
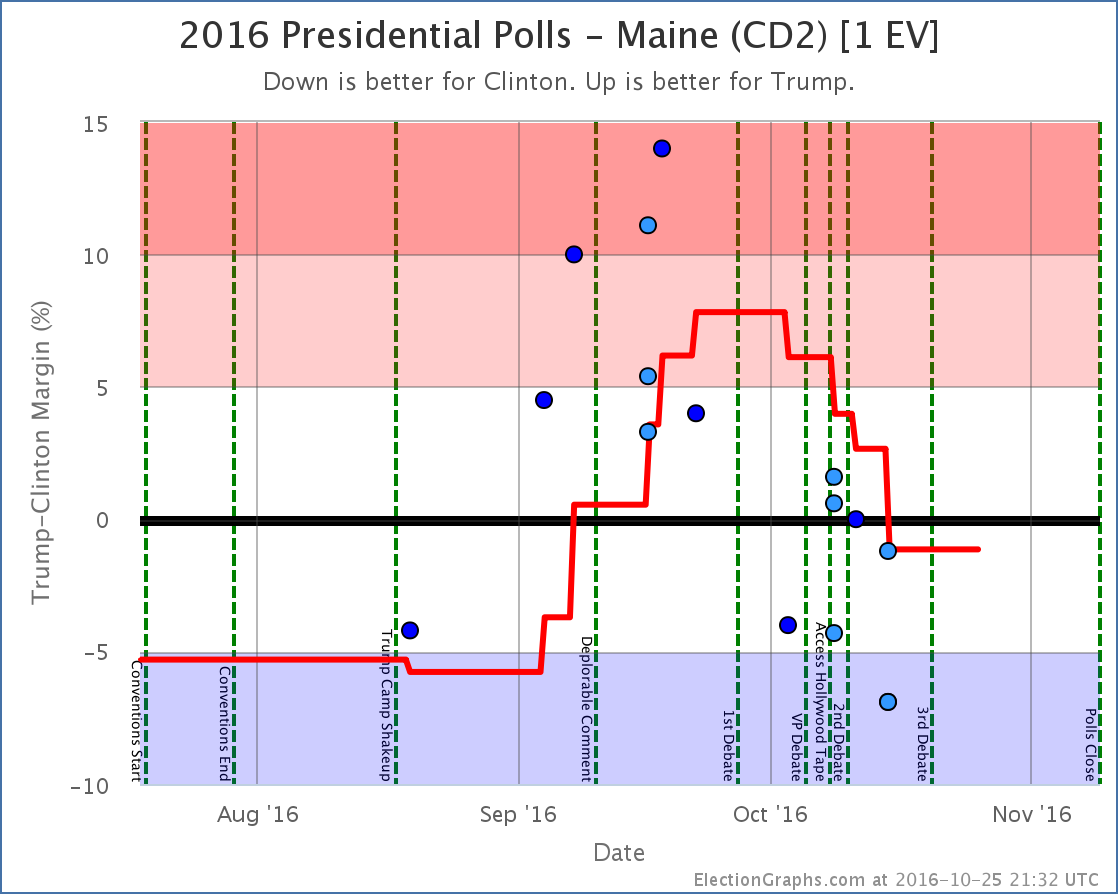
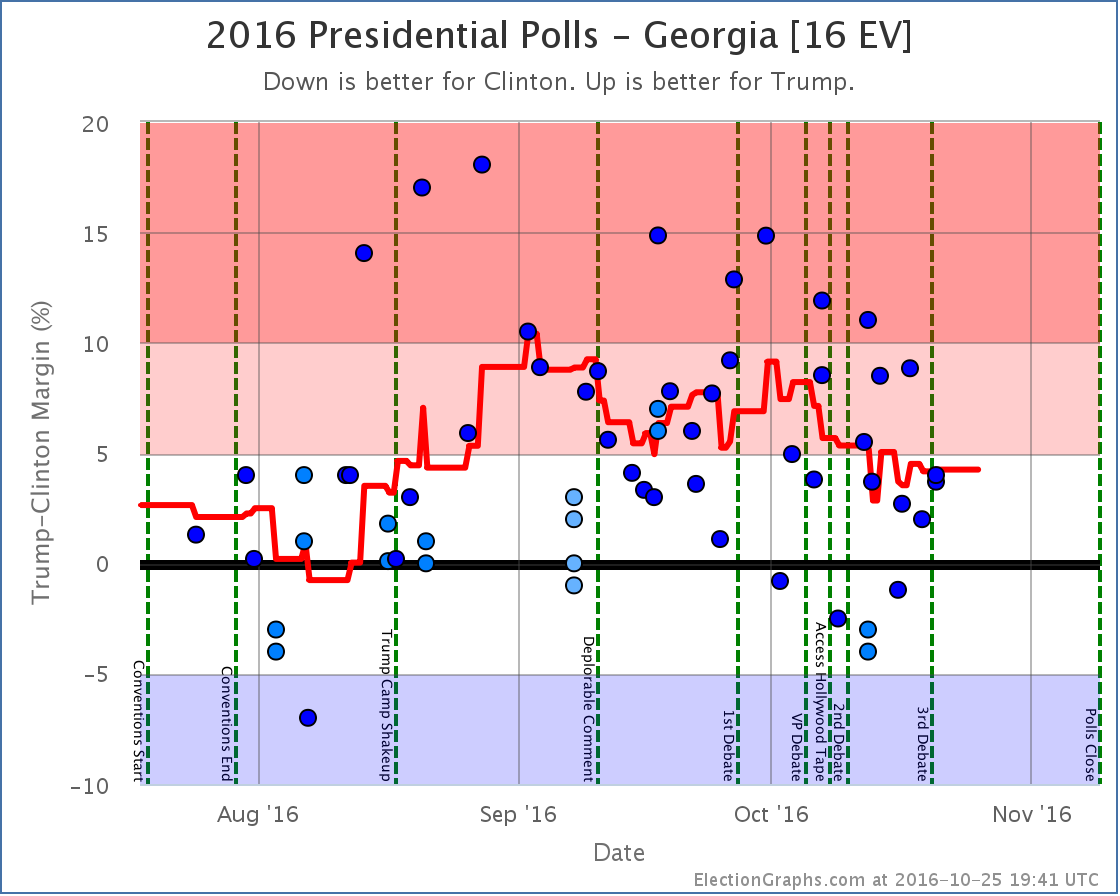
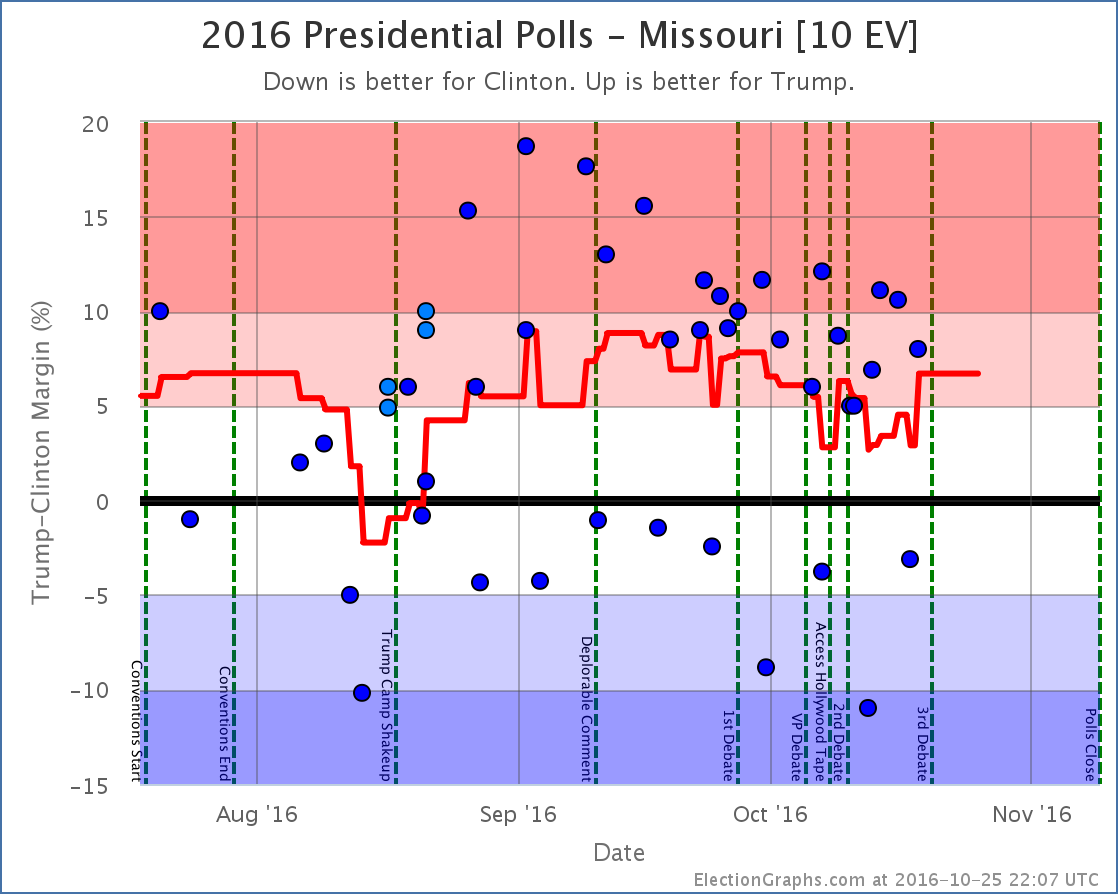
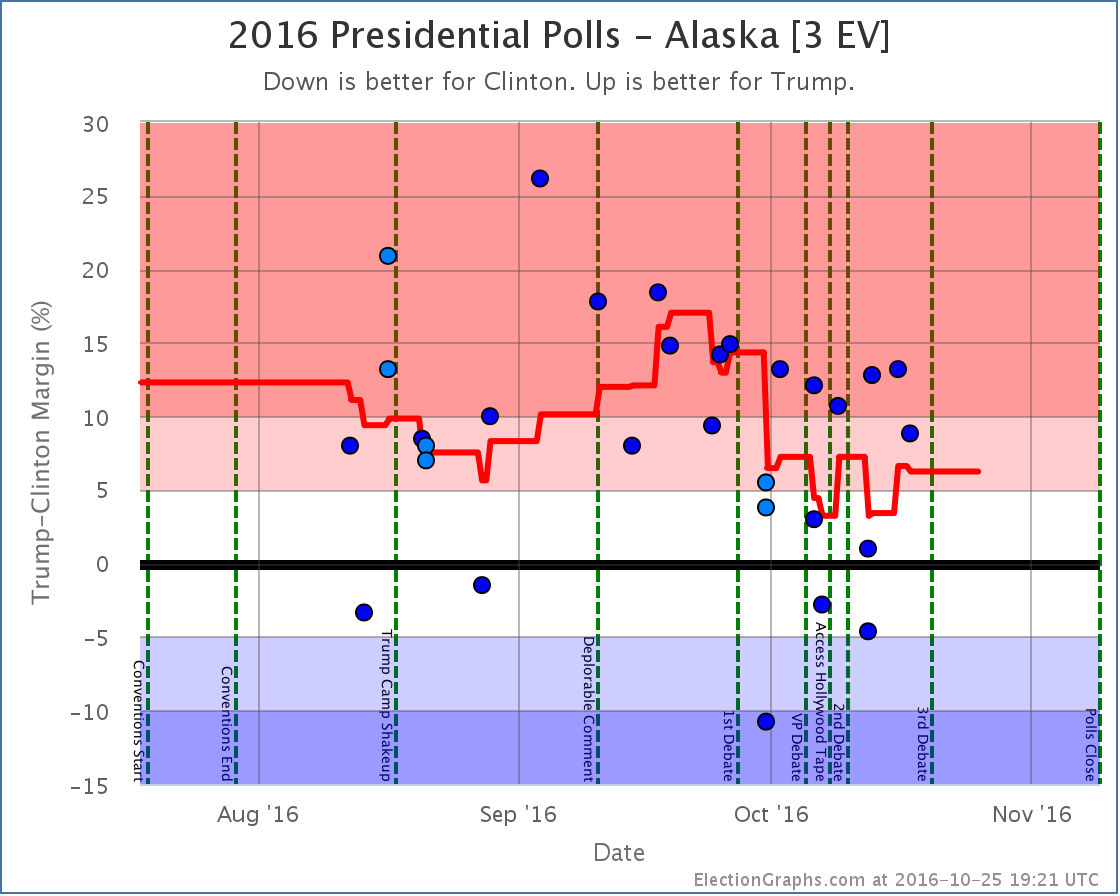
Notable changes in: Iowa, Georgia, Utah, Alaska, Indiana, Missouri, Maine (CD2), and the tipping point
National Summary
It has been about six days since my last update and the trend since then has been toward Trump. Here are the stats:
Good for Trump:
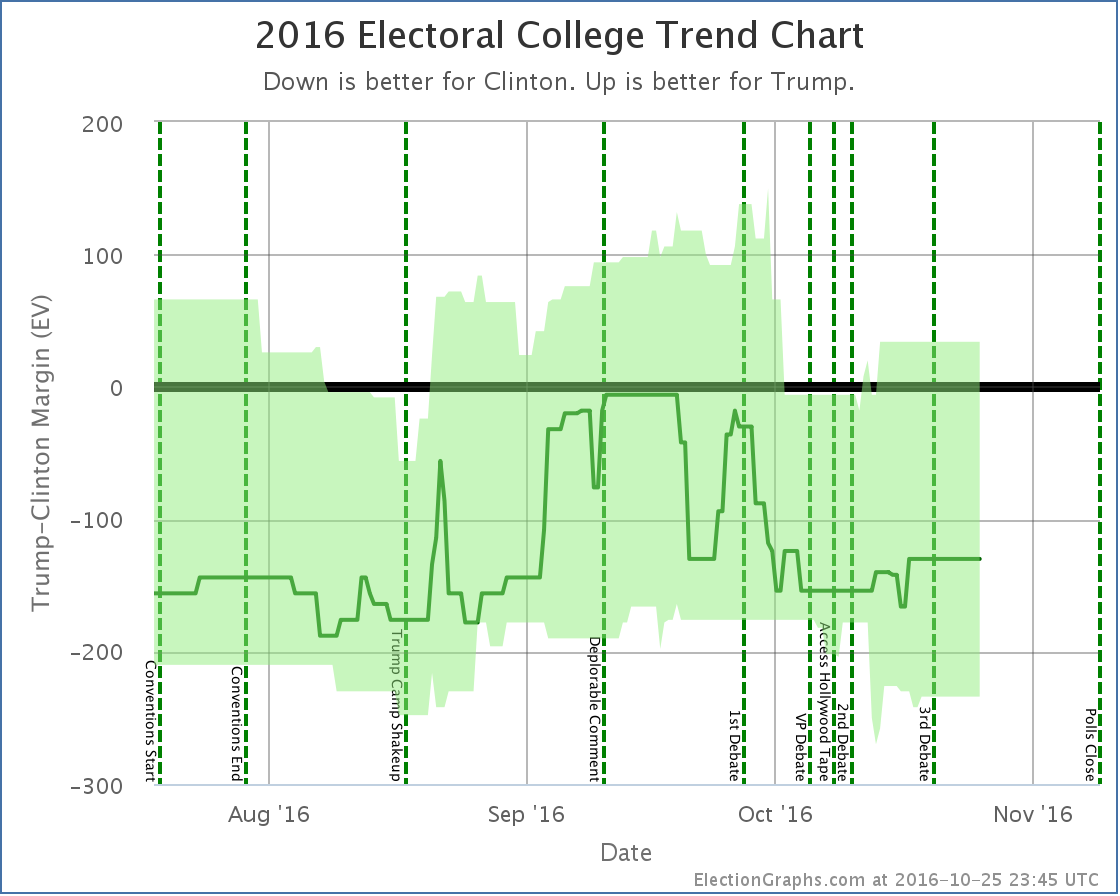
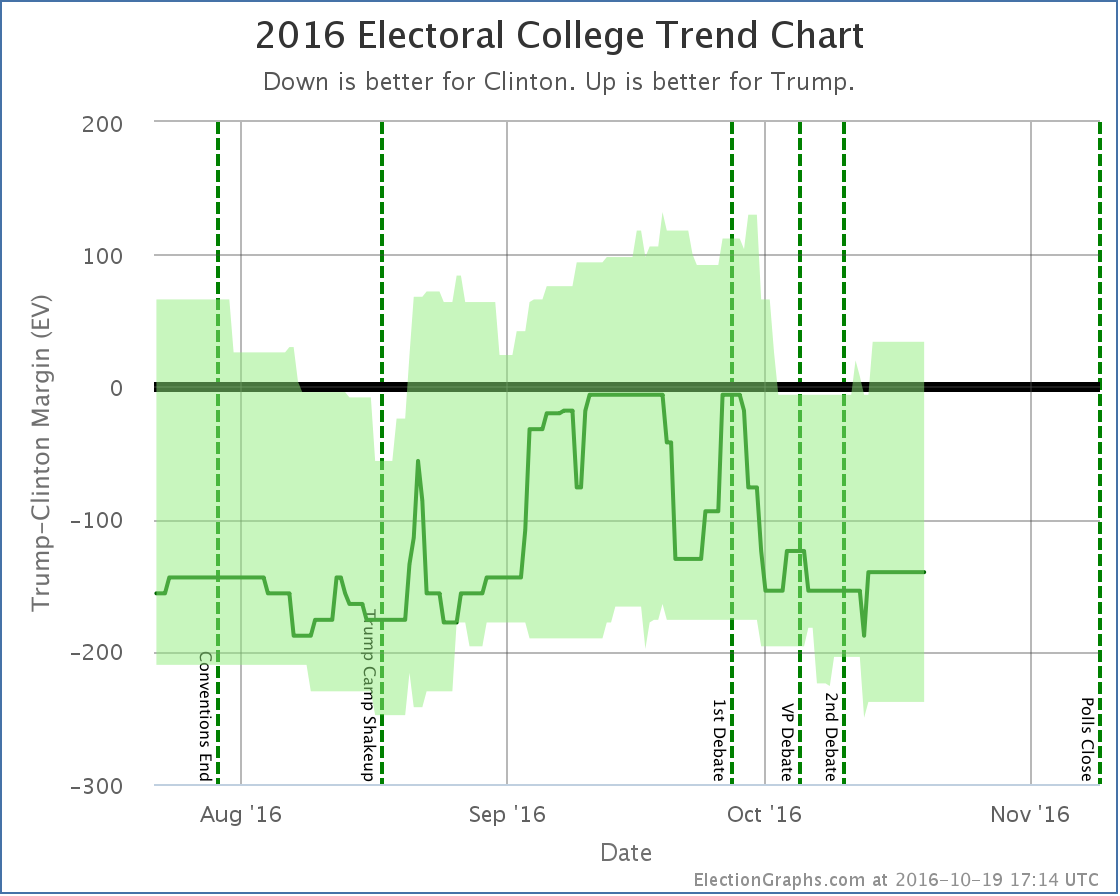
- The expected result changed from a 140 EV Clinton win to a 130 EV Clinton win
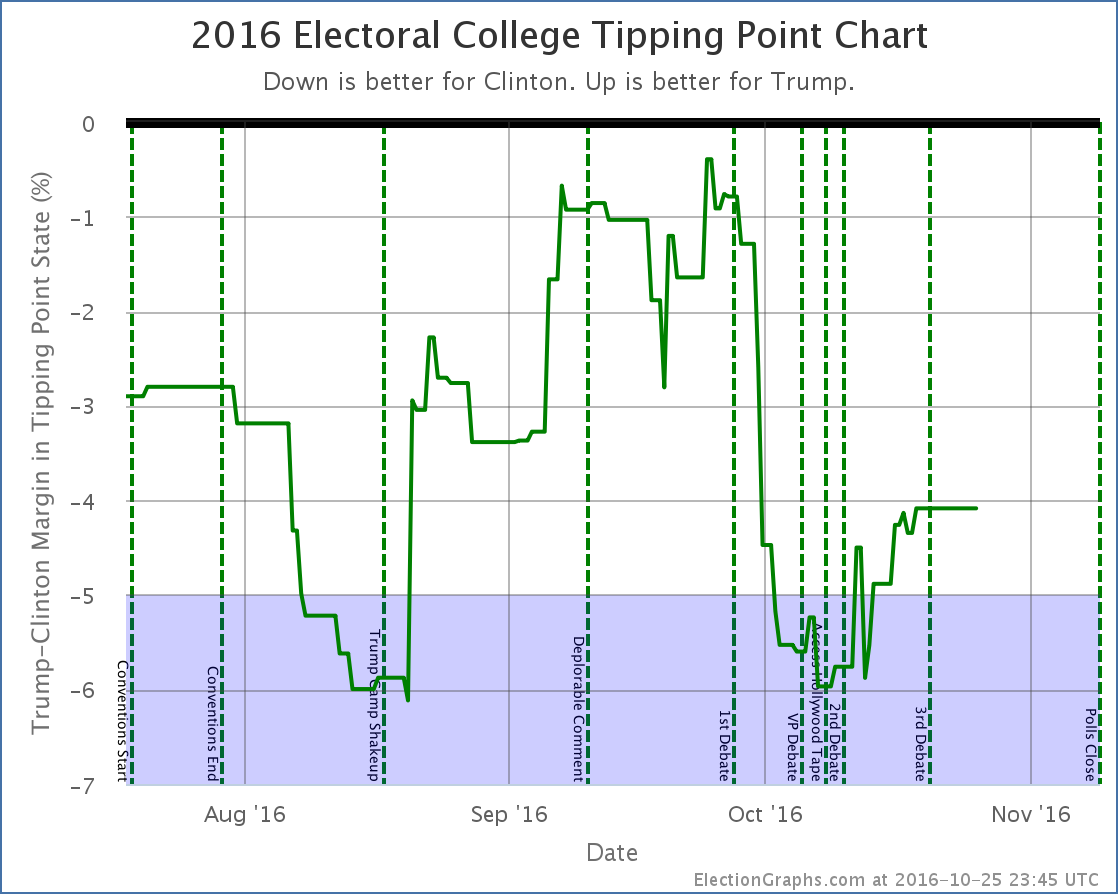
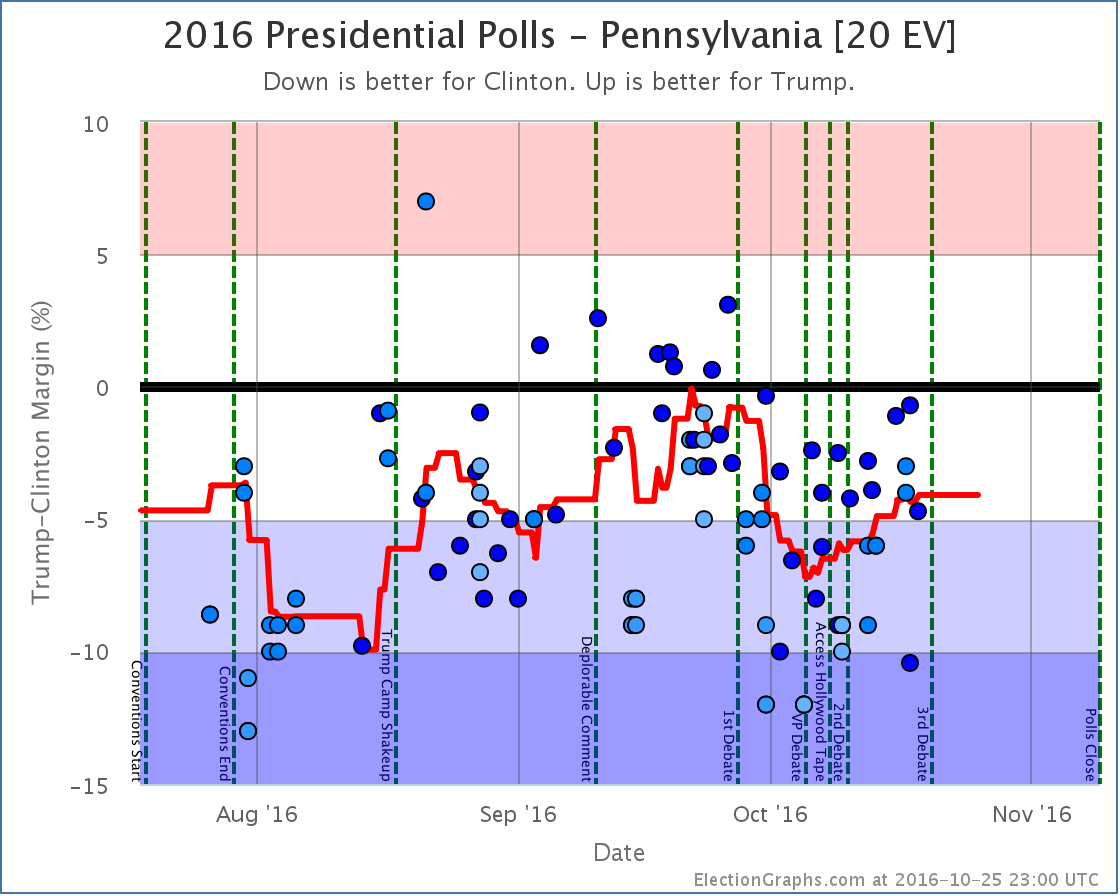
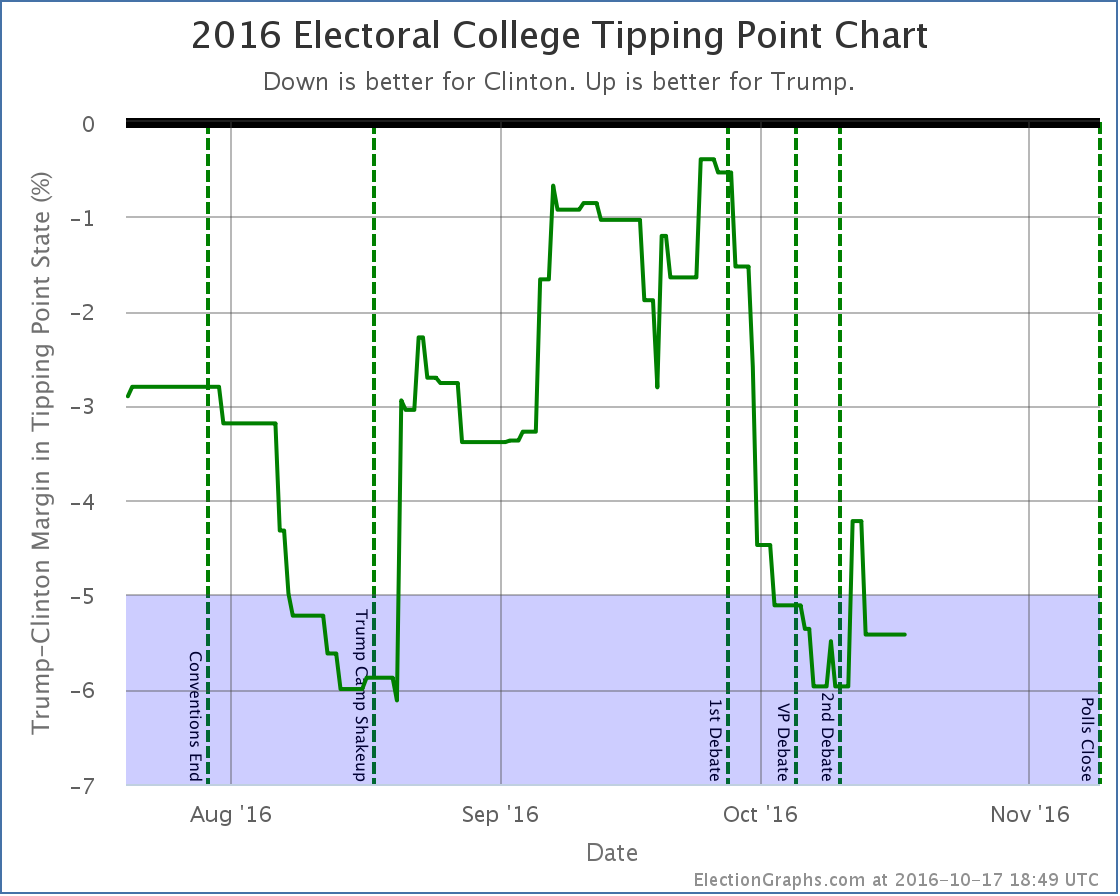
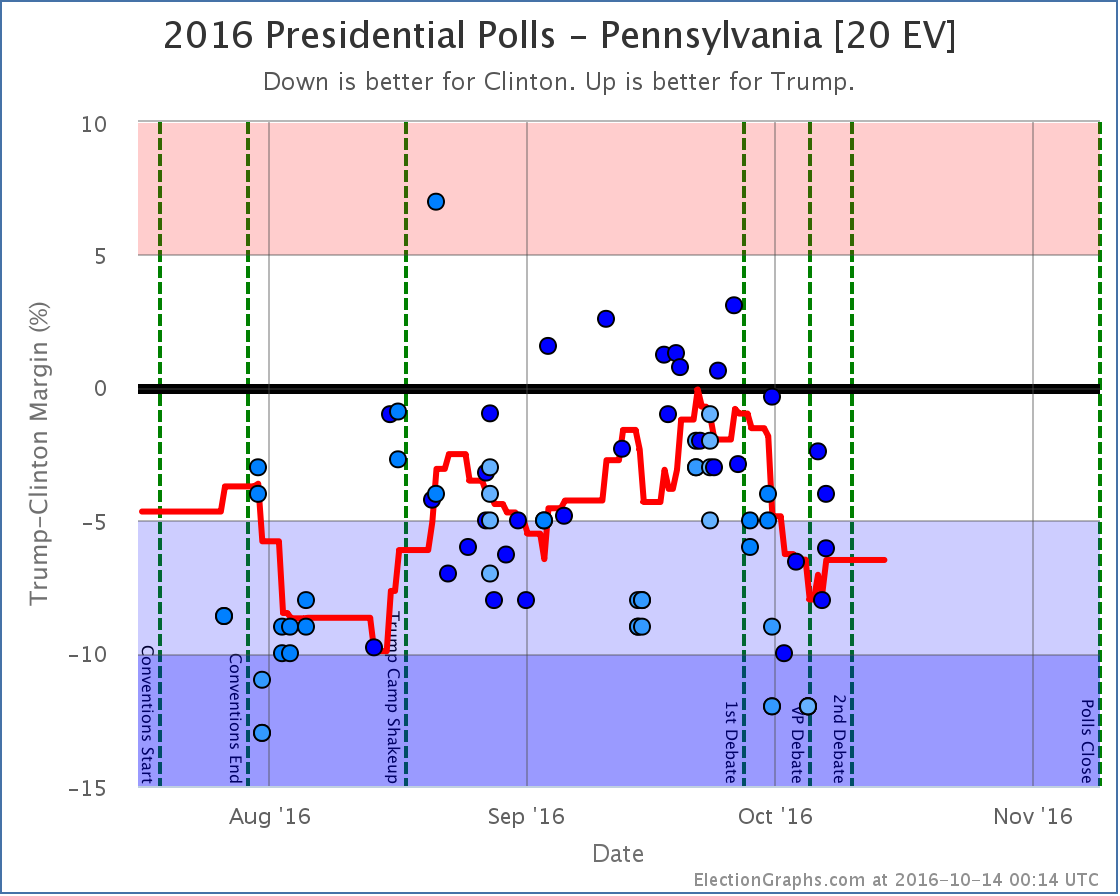
- The tipping point moved from Clinton by 4.9% in PA to Clinton by 4.1% in PA
- Clinton’s best case declined from a 238 EV win to only a 234 EV win
No change
- Trump’s best case remained a 34 EV win
Charts
Discussion
With all the data we have now, looking back to the release of “the tape” on October 7th the overall movement has been mixed. Both candidates have improved their “best cases” as states that were not close have gotten closer… on both sides. So this doesn’t show a move toward one candidate or another, but rather some red states getting less red while simultaneously some blue states got less blue.
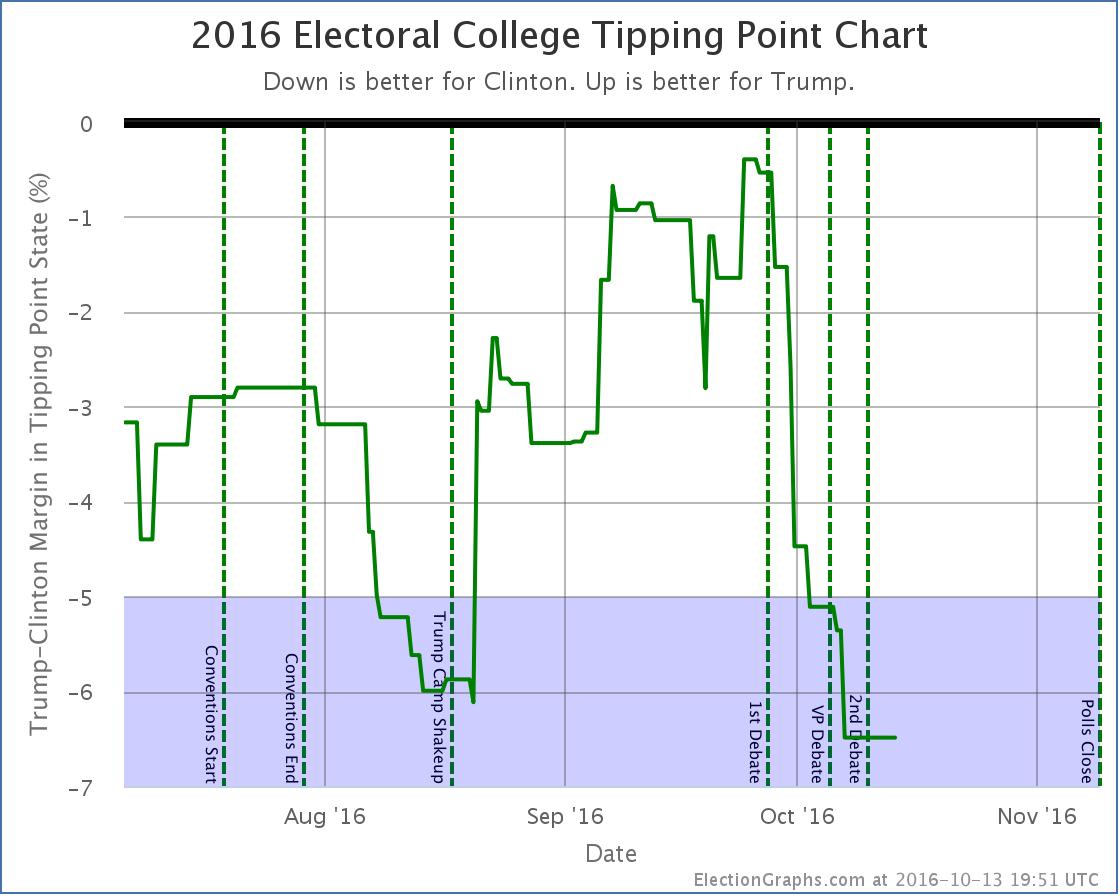
Some of the really close states moved across the center line… in both directions… resulting in a net movement of the expected electoral college margin toward Trump by 24 electoral votes… but the most indicative sign of movement toward Trump is actually the tipping point.
Since the release of the tape the tipping point has moved from Clinton leading by 6.0% (in Virginia) to Clinton leading by only 4.1% (in Pennsylvania). So… with some of the worst news cycles for a politician in decades, with day after day after day of negative revelations… Trump improved his position by nearly 2%.
How to interpret this? My best guess… Most people were pretty well set on their Trump vs Clinton choice prior to the reveal of the tapes and the subsequent sexual assault allegations. In the wake of the first debate the part of the public that was persuadable had already swung us from near Trump’s ceiling to near Trump’s floor. With the string of additional bad news, very few die hard Trump supporters moved away from him, while some number of those persuadables viewed this as the press piling on Trump and went back to him thinking this was unfair.
But to be honest, the above is trying to make up a story to fit the numbers. Is it right? I don’t know.
In the end though, the reality is that in the face of a hurricane of bad coverage, Trump has actually improved his position.
Despite the improvement, Trump is still losing by a significant margin, but Trump’s best case does still includes a win.
If he keeps all the states he leads, then flips Arizona, North Carolina, Florida and Pennsylvania, he could still pull out a narrow win. Arizona is close enough it could flip back easily enough. North Carolina and Florida have both been back and forth over the past couple months, so seeing them go red again would not be shocking.
Pennsylvania is the hard pull. While he made it close in September, Trump has never led in Pennsylvania. And Trump needs Pennsylvania to win. Right now, this is Clinton’s firewall.
Clinton would clearly like to be leading in Pennsylvania by more than 4.1%… but even at that margin, it is a tall wall for Trump to climb.
There are 13.7 days left until the first polls close. With less than two weeks left to go now, it is almost certainly too late for Trump to flip all the states he would need to flip in order to win. But if he manages to continue the trend of the last couple of weeks, it is enough time for him to make it close enough that Democrats will start to panic.
State Details
The following are the detailed state charts for states that influenced the status changes since the last update.
Weak Clinton to Weak Trump
Weak Trump to Weak Clinton
Influencing the tipping point
Now possible Clinton pickups
No longer possible pickups for Clinton
A note about McMullin
Election Graphs is designed around showing the Republican – Democrat margin, and there is not enough time before the election to revamp the site to properly account for 3rd parties that are strong enough to have a shot at winning electoral votes.
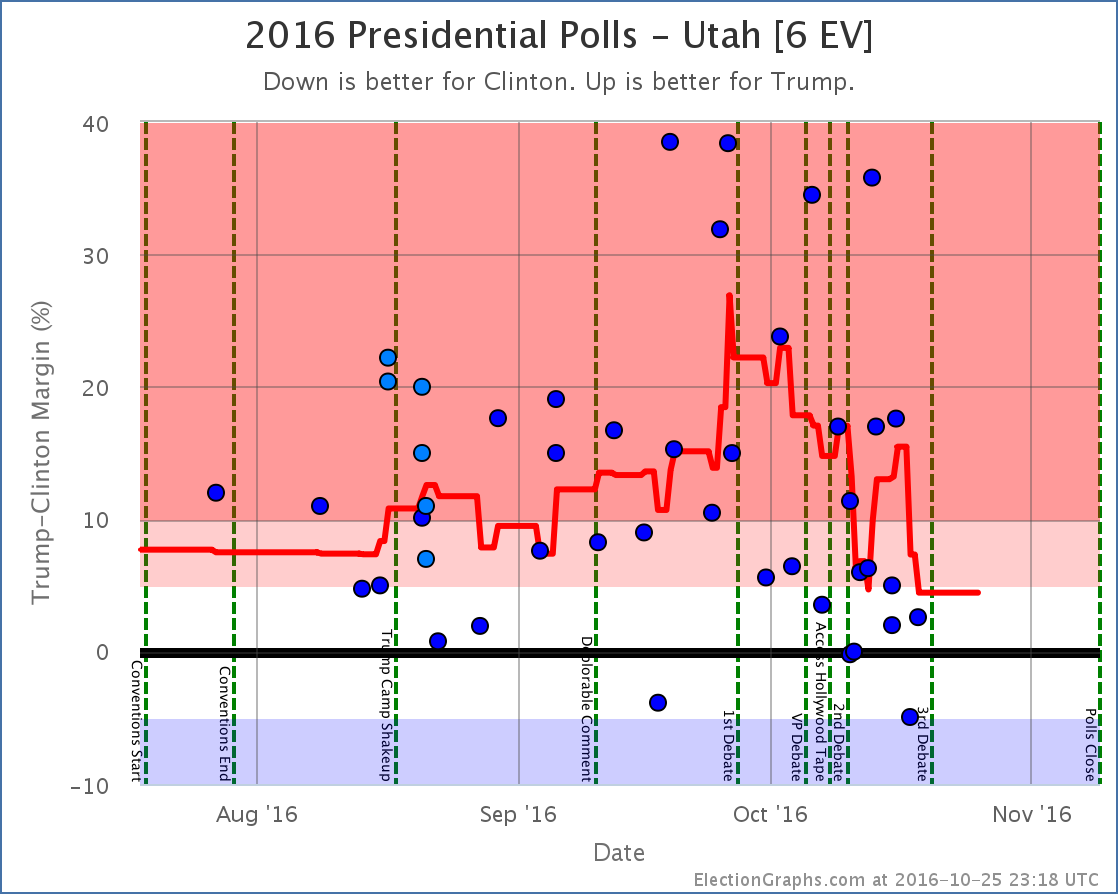
Right now the Real Clear Politics average in Utah has McMullin 5.5% behind the lead. The 538 average in Utah has him 8.5% behind the lead. If/when McMullin is within 5% according to either of these averages, I will add notes to both the Utah and National pages about the possibility of McMullin winning Utah’s 6 electoral votes.
For more information…
This post is an update based on the data on ElectionGraphs.com. Election Graphs tracks a state poll based estimate of the Electoral College. All of the charts and graphs seen in this post are from that site. Additional graphs, charts and raw data can be found there. Follow @ElectionGraphs on Twitter or like Election Graphs on Facebook to see announcements of updates or to join the conversation. For those interested in individual general election poll updates, follow @ElecCollPolls on Twitter for all the polls as they are added. If you find the information in these posts interesting or useful, please consider visiting the tip jar.
States with new poll data added since the last update: All 50 states and DC.
Notable changes in: Ohio, Arizona, Indiana, Kansas, Pennsylvania, and the tipping point
National Summary
Despite the widespread view that the time between the Vice Presidential debate and the present has essentially been non-stop bad news for Trump that could only cause his number to fall, and the fact that the national popular vote numbers do show this kind of trend, the electoral college view has just plain not shown that. In fact, looking at the various electoral college numbers we track here, things have mostly been moving in Trump’s direction since the 2nd debate. In the latest update, we have these changes:
Good for Trump:
- Expected case moves from a 154 EV win for Clinton to a 140 EV win for Clinton
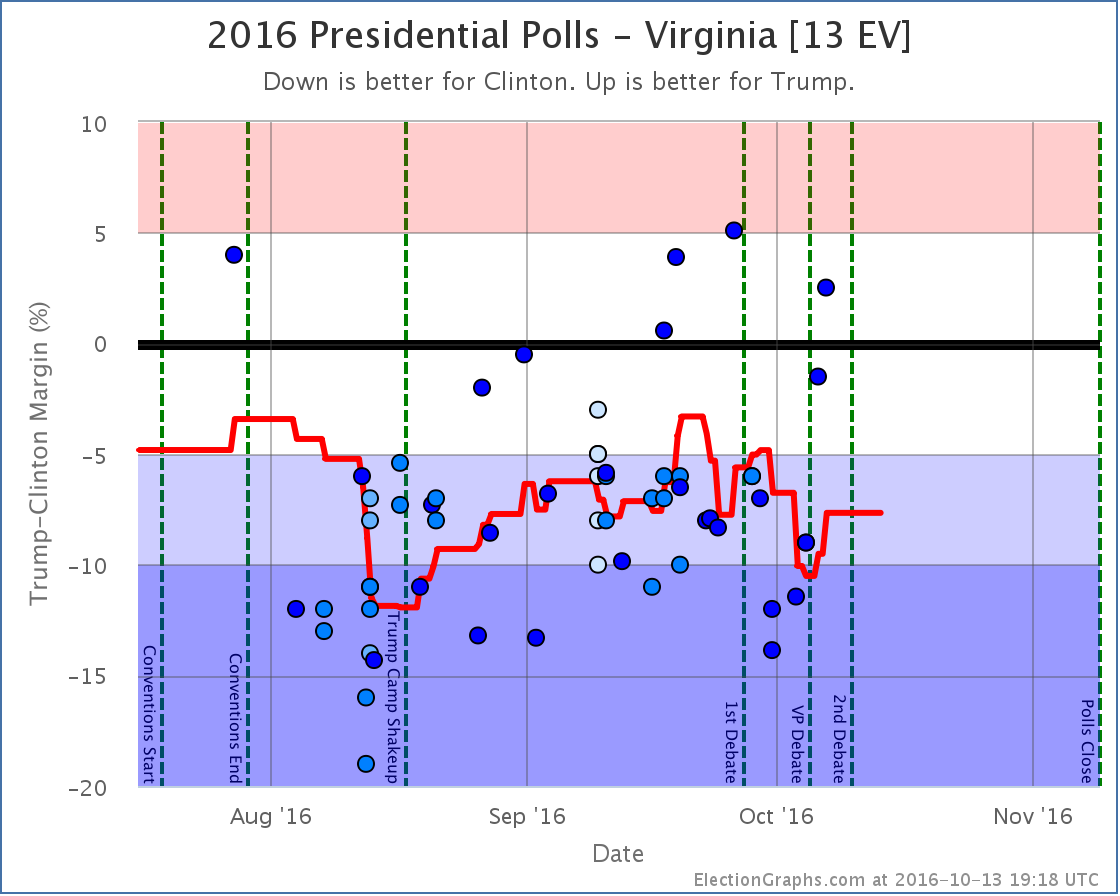
- Tipping point moves from Clinton by 5.4% in VA to Clinton by 4.9% in PA
- Trump best case improves from a 6 EV loss to a 34 EV win
Good for Clinton:
- Clinton best case improves from a 204 EV win to a 238 EV win
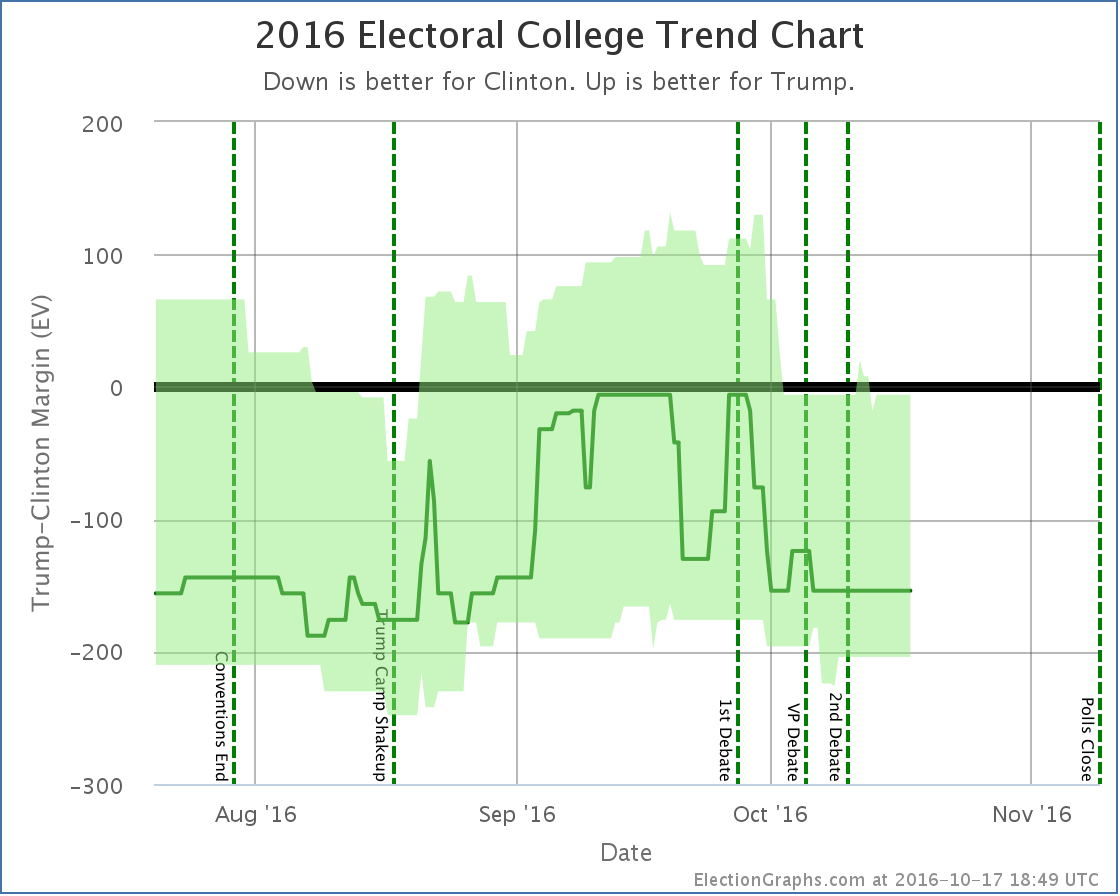
While Clinton’s best case does improve a bit (although this may be due to outliers, see state details below), for the most part the movement here is toward Trump. It is not a huge movement, but it also doesn’t look like Trump continuing to crash.
Here are the charts:
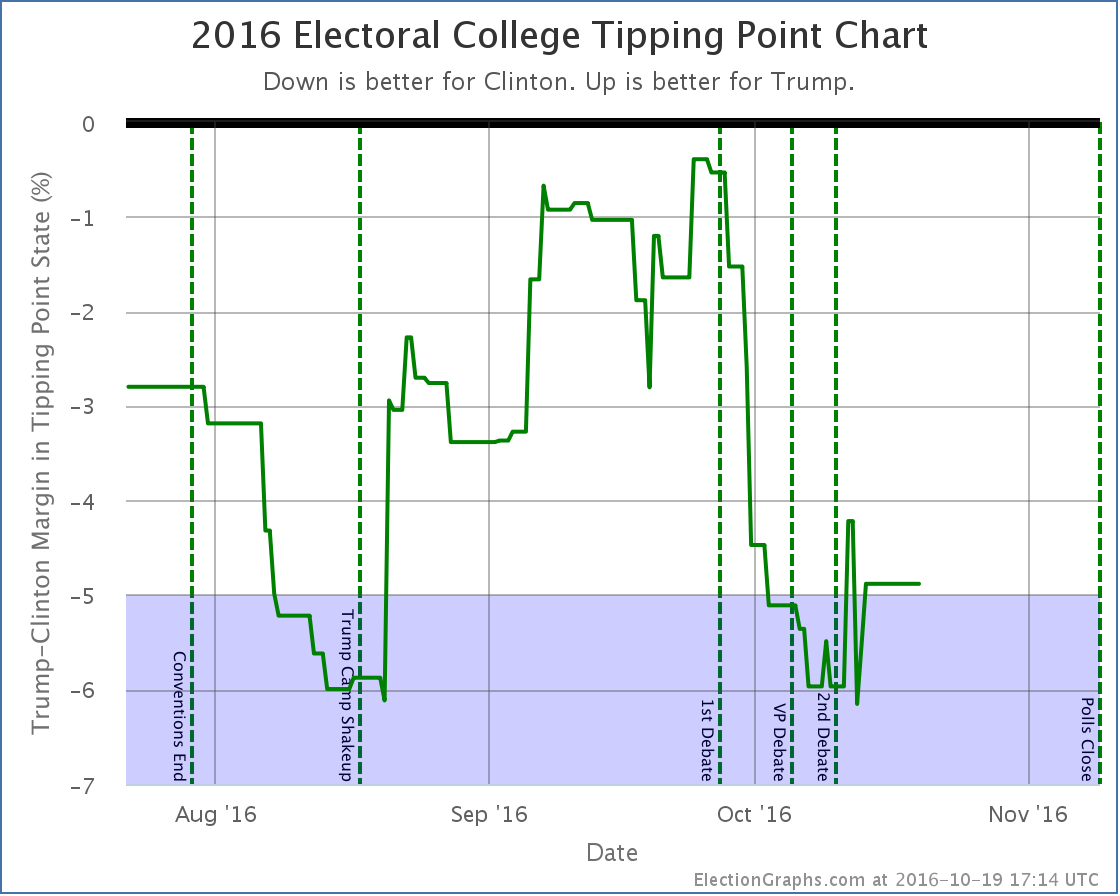
While we do have Indiana and Kansas moving into the “Weak Trump” category, and thus expanding Clinton’s best case, the net changes for the expected case and tipping point are both in Trump’s direction, and Trump improves his best case as well, with Clinton’s lead in Pennsylvania down from where it was at the VP debate.
Looking at both charts, while Trump may have improved a bit from his lows, what this really looks like is that we have reached a plateau and things have basically been flat since the VP debate, minus some jiggles around the edges by states that are right near my category boundaries.
There are still events that aren’t factored in here, including some of the later sexual assault allegations, and of course the third debate. So things may start moving again in the next few updates. But for now… basically flat.
The “best case”, if Trump wins all his states, plus all the states where he is within 5%, now once again registers a narrow Trump win. But that would still require either a fairly large systematic polling error, or a last minute Trump surge. The “bubble” shows the extreme range of “conceivable possibilities”, but the edges of the bubble are still very unlikely. We’re far more likely to get results closer to the “expected” line.
Looking at the expected result, we are once again we are in the zone where Trump does better than McCain, but worse than Romney. That is a solid Clinton win, but not any sort of unprecedented loss for Trump. Just a normal sort of electoral loss. At least in terms of the electoral college.
We’ll see if anything causes that to change.
19.3 days left until we start getting real vote counts instead of polls…
State Details
Weak Clinton to Weak Trump
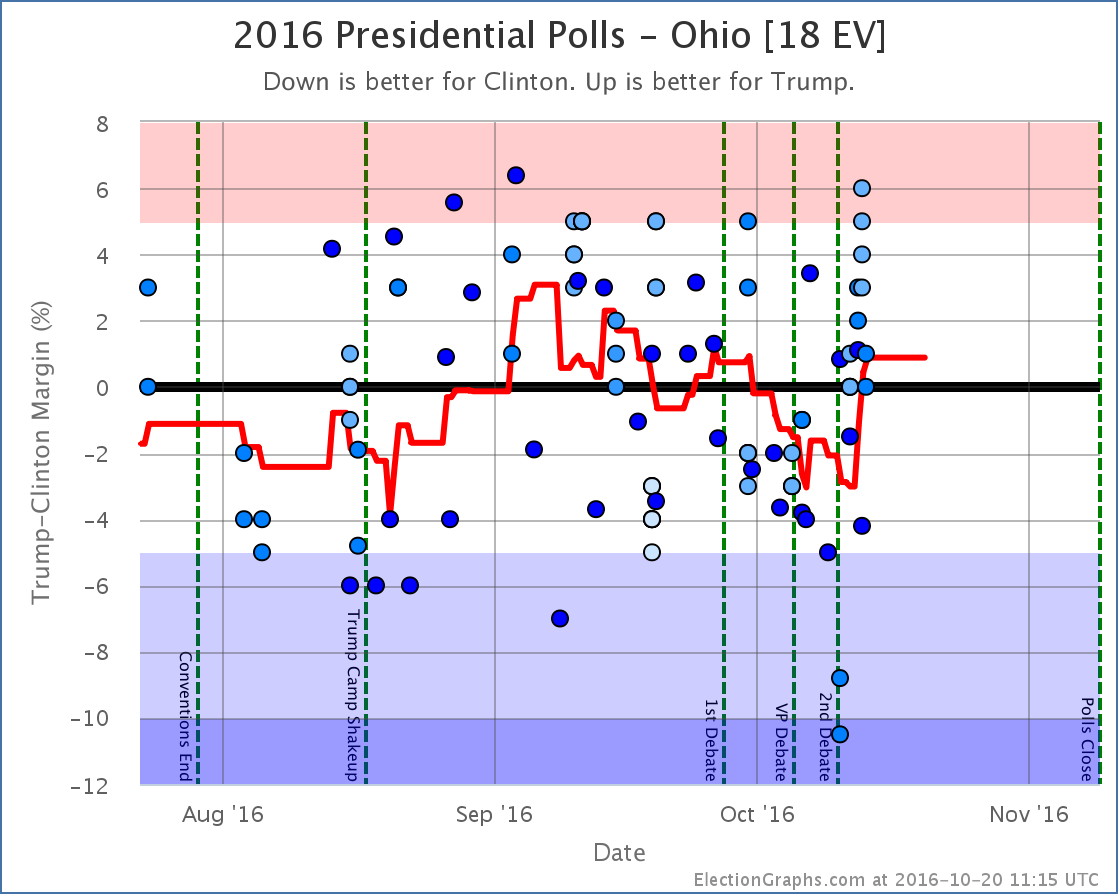
Trump now leads Ohio by 0.9%, but Ohio has been bouncing up and down right around the center line for months. It had been trending toward Clinton until a recent batch of polls that were better for Trump. Really could go either way.
Weak Trump to Weak Clinton
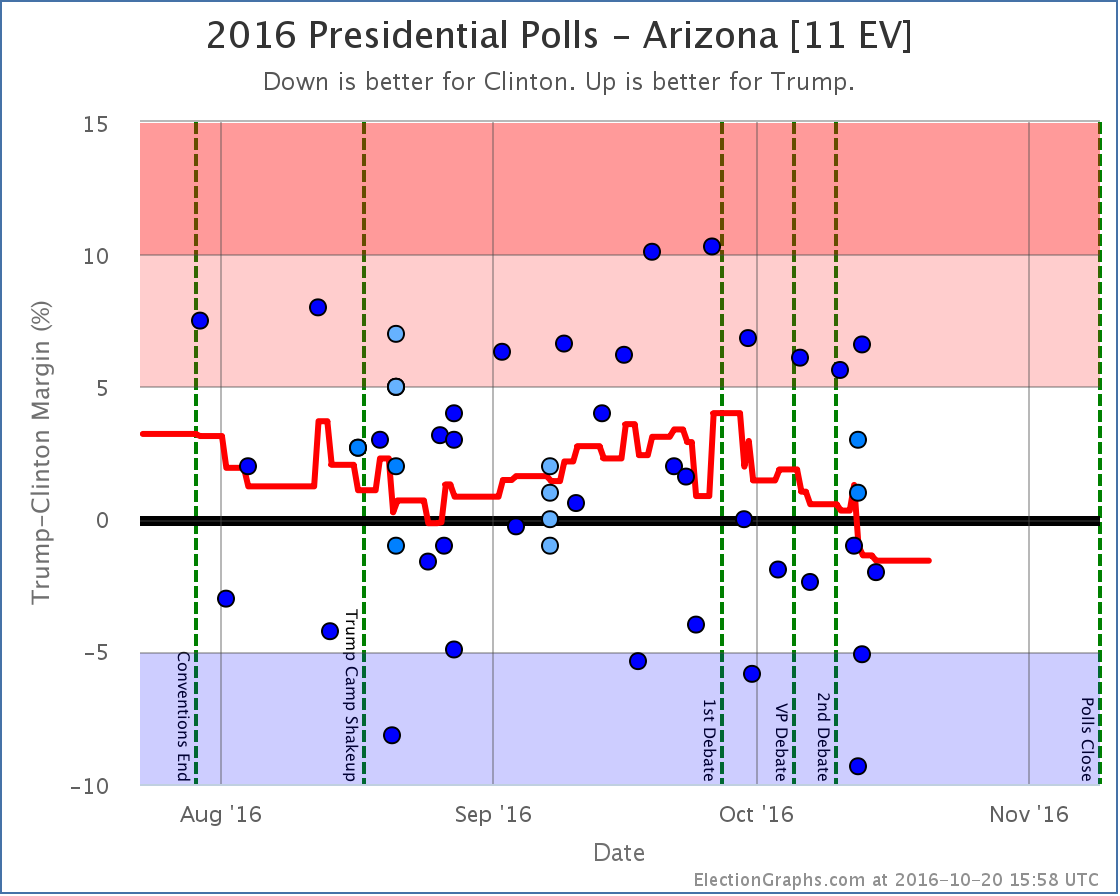
Clinton is now at +1.6% in Arizona. The state has been trending in her direction since the 1st debate. It is still close though, and this could be reversed. There is a reason we call the “weak” states weak.
Into reach for Trump
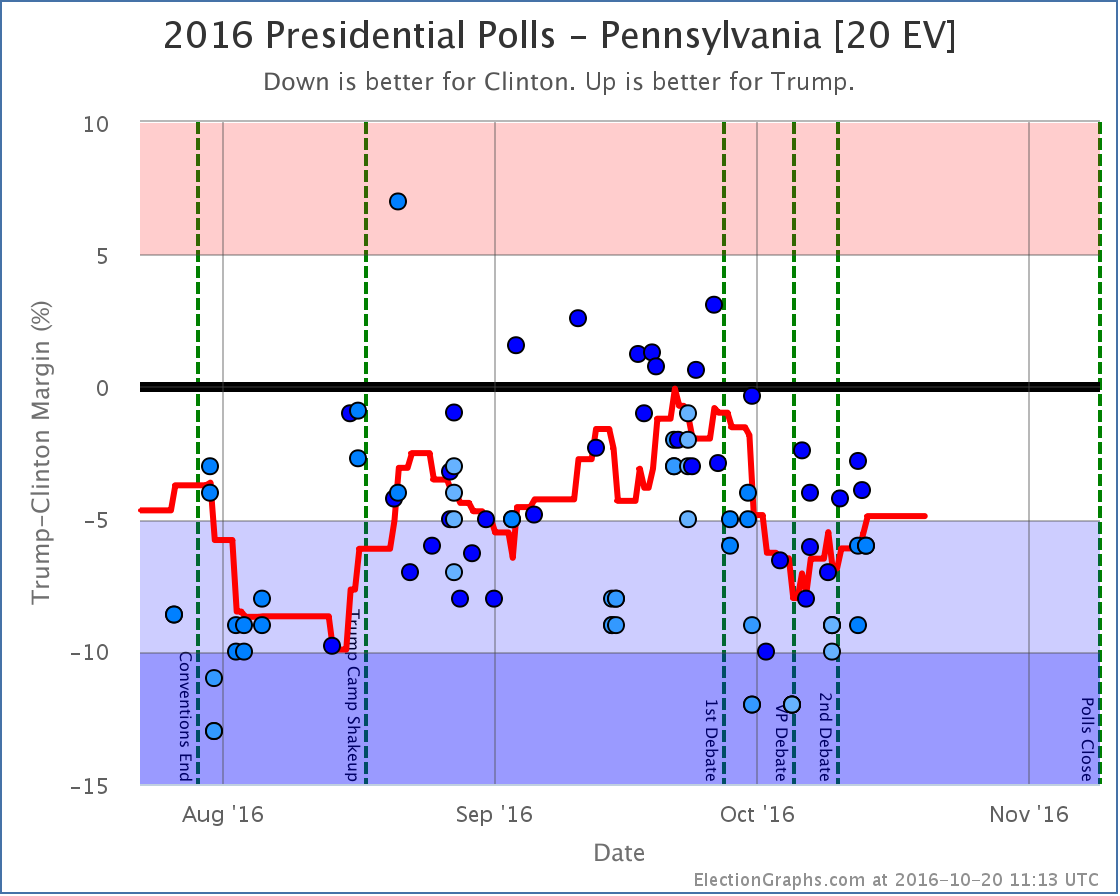
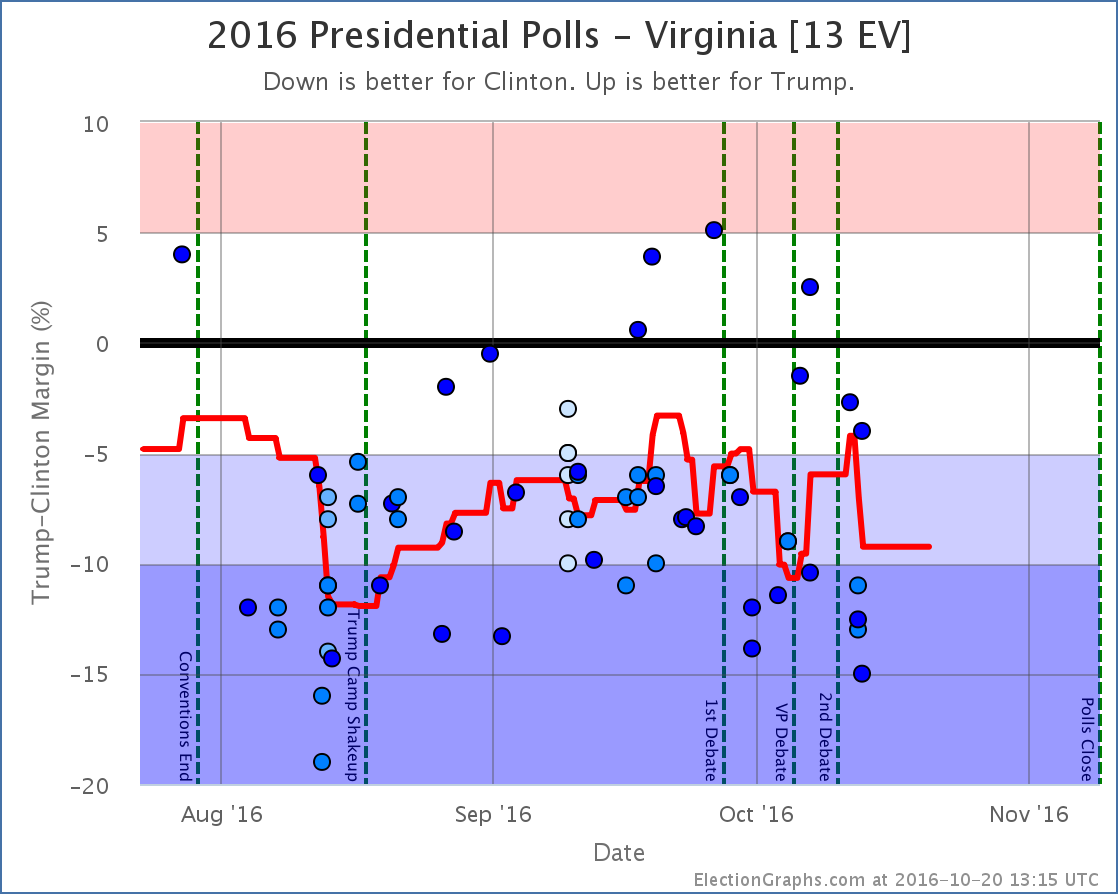
Clinton’s lead in Pennsylvania grew considerably after the 1st debate, but has been shrinking again since the VP debate. It now stands at only 4.9%, which means we once again consider it within reach for Trump. If Trump managed to stretch out and win Pennsylvania, his overall shot of winning the White House is significantly greater. But he has never led in the Pennsylvania poll average. So that will still take a significant move from where we are now…
Into reach for Clinton
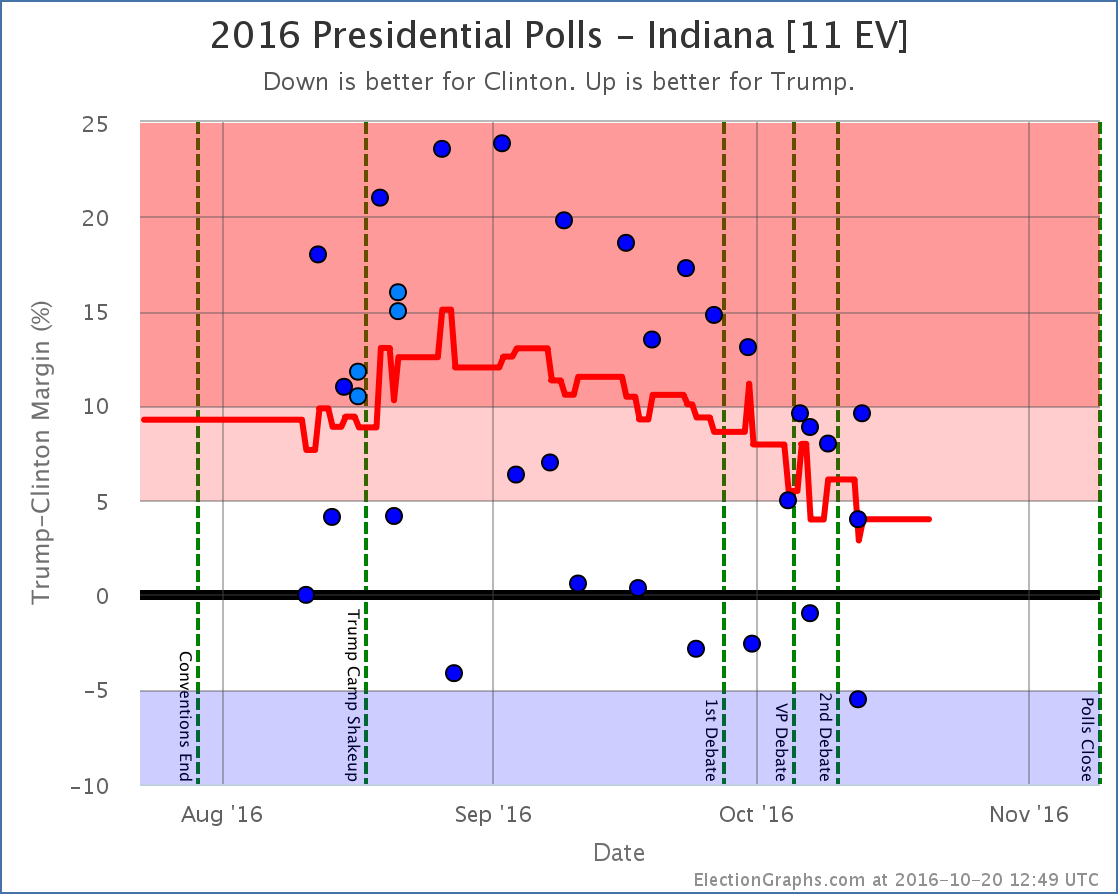
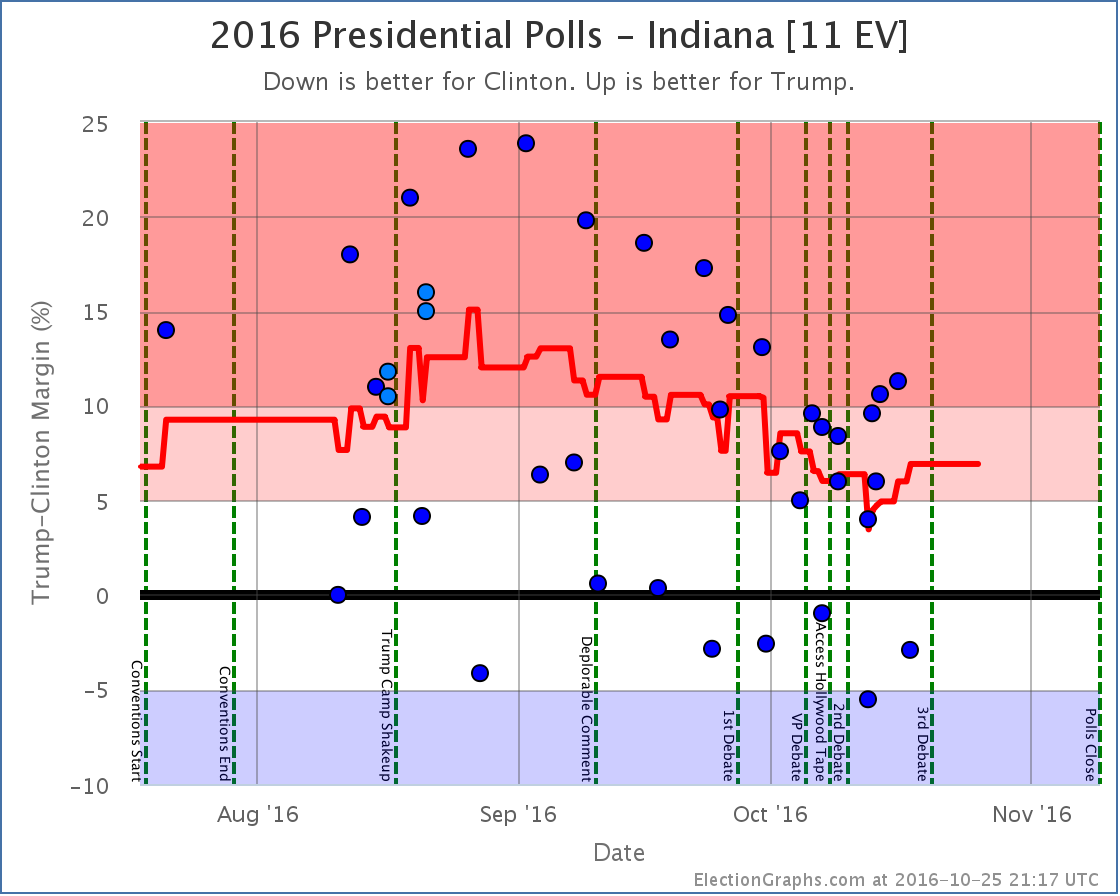
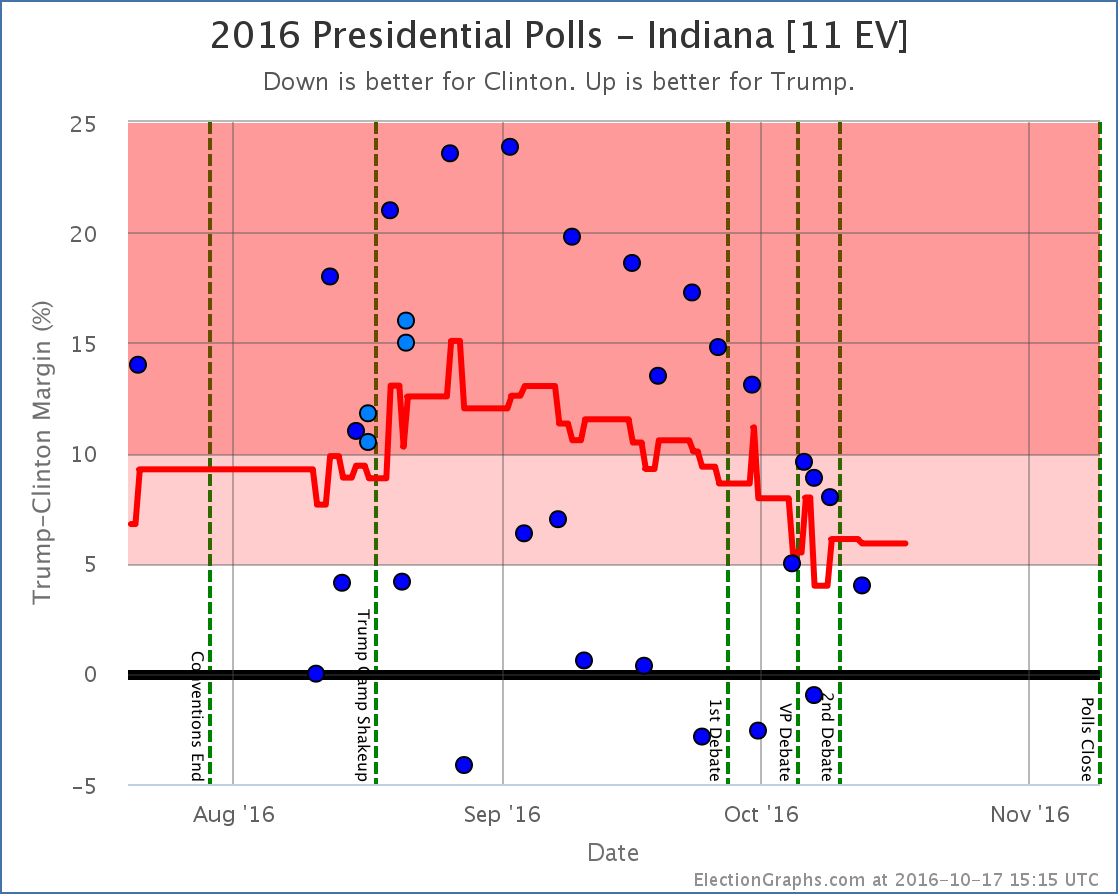
The Election Graphs average now has Trump’s lead in Indiana down to only 4.0%. This puts it in the “Weak Trump” category. I’m not sure I really believe this though. This is pulled downward by two Google polls showing Clinton actually leading in Indiana, which are outliers compared to the rest of the Indiana results. Without Google, the average would be Trump leading by 8.0%. Indiana is closer than it was a few months ago. It HAS been trending slowly away from Trump. But take Indiana as a swing state with a dose of salt until non-Google polls show it there too.
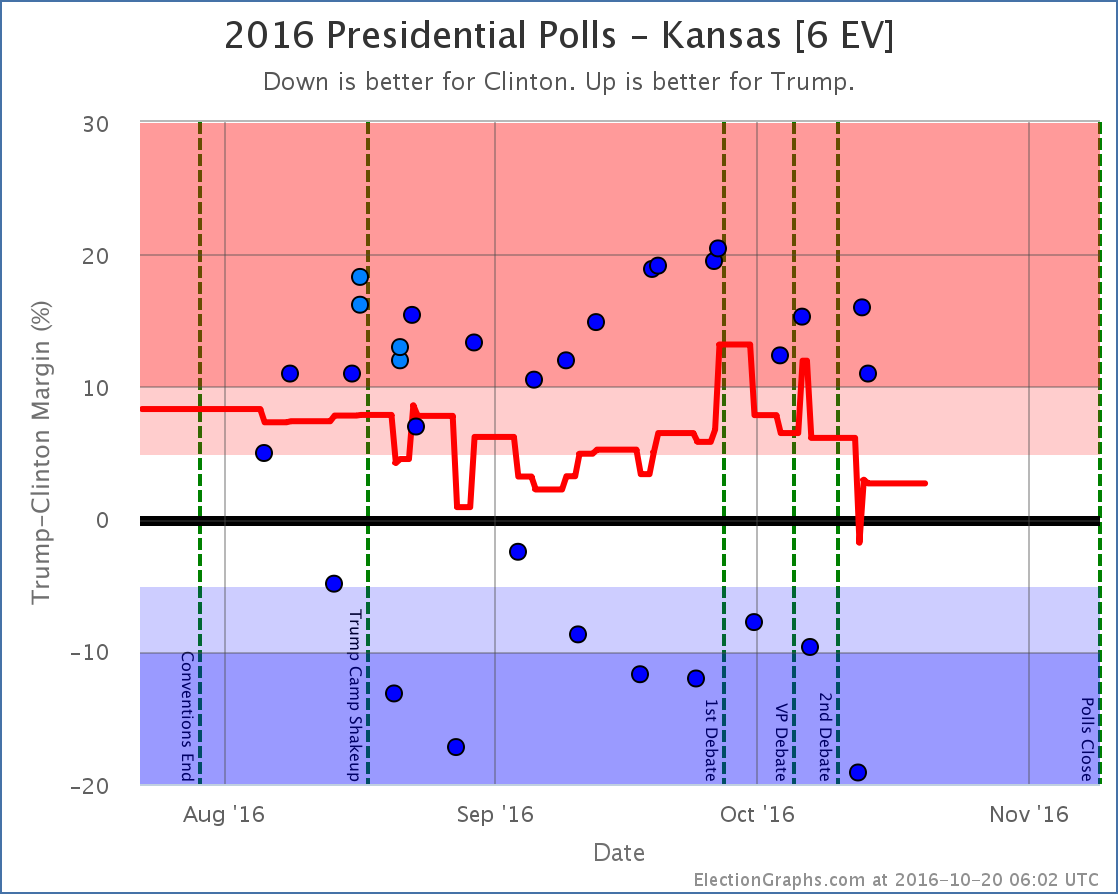
Use the rest of your salt for Kansas, and for the same reason. Google. Without the Google polls, the average in Kansas would not be Trump by 2.7%, it would be Trump by 15.0%. Kansas is lightly polled, so Google has an outsized influence. And the Google results are WAY off from what any other pollster has seen.
Also impacted the tipping point
A note about McMullin
In the last week or two McMullin has spiked in Utah. Some individual polls now even show him leading in Utah. All of the current Election Graphs metrics and charts operate under the assumption that no third party has a realistic shot at winning electoral votes. I have had the outline of a contingency plan on how to modify the site to accommodate 3rd parties that might win electoral votes for months, but activating it would take quite a lot of time and effort. If a 3rd candidate had gotten to that position a month or two ago, the site would definitely have been revamped to adjust for that possibility. As it is, there realistically is no longer time to do that before election day.
Right now the Real Clear Politics average in Utah has McMullin 6.4% behind the lead. The 538 average in Utah has him 11.1% behind the lead. If/when McMullin is within 5% according to either of these averages, I will add notes to both the Utah and National pages talking about the possibility of McMullin winning Utah’s 6 electoral votes, but I probably won’t try to revamp the site to change absolutely everything to account for the possibility. I’ll try to have something ready for 2020 just in case though. :-)
For more information…
This post is an update based on the data on ElectionGraphs.com. Election Graphs tracks a state poll based estimate of the Electoral College. All of the charts and graphs seen in this post are from that site. Additional graphs, charts and raw data can be found there. Follow @ElectionGraphs on Twitter or like Election Graphs on Facebook to see announcements of updates or to join the conversation. For those interested in individual general election poll updates, follow @ElecCollPolls on Twitter for all the polls as they are added. If you find the information in these posts interesting or useful, please consider visiting the tip jar.
States with new poll data added since the last update: Everywhere except Alaska, DC, Hawaii, Rhode Island, Vermont, Wyoming, and the Nebraska congressional districts.
Notable changes in: Indiana and the tipping point
National Summary
We now have plenty of polls that are after the Access Hollywood tape and after the 2nd debate, and even a few from after the various sexual assault allegations leveled against Donald Trump. The averages go back further, often covering 2-3 weeks, even for the close states. But we are getting to the point where we should be seeing impact from those events.
After the first debate, we did see a big drop. It continued through to release of the tape and the second debate. We are still getting polls covering the period immediately after that, so things may yet change… but so far there has not been a further drop since those events.
In fact, we have seen an improvement for Trump since the last update:
- The tipping point moved from Clinton by 6.5% in PA to Clinton by 5.4% in VA.
- Clinton’s best case declined from a 226 EV win to only a 204 EV win.
The expected case and Trump’s best case remained the same.
Here are the charts:
Both charts show a bit of improvement for Trump based on the last few days of polls.
Now, it might be wise to be cautious here. We are still going to get more polls covering this period. So these lines will move about some more. But it is also very possible that Trump hit his floor, and we’re now bouncing back a bit from that.
The public is very polarized. There is a percentage of Americans who will vote Democrat no matter what, and another percentage who will vote Republican no matter what. We may have seen both extremes of the how far things can change by those in the middle sloshing back and forth. If so, the extremes of this race go from a nearly tied race at Trump’s ceiling, to about a 188 electoral vote win for Clinton at her ceiling. Those are “expected case” numbers. In terms of the tipping point that translates into a Clinton lead of between approximately 0.5% and 6%.
Given recent news cycles and where things stand now, it currently seems as if a break through Trump’s floor is more likely than through his ceiling. As has been pointed out, a comeback from this far behind with this little time left would be unprecedented. But while it is possible that events may cause us to break out of that range, it seems very likely that when the votes come in on November 8th, we’ll find ourselves somewhere between those bounds.
But we shall see soon enough… 22.1 days left to go!
State Details
Moving out of Clinton’s reach
The general trend in Indiana has been a steadily weakening lead for Trump. But with the latest polls, the average pops up to a 5.9% Trump lead, so for now, Indiana is no longer in the “could go either way” category.
State that changed the tipping point
A note about McMullin
In the last week or two McMullin has spiked in Utah. Some individual polls show him within striking range of winning Utah. All of the current Election Graphs metrics and charts operate under the assumption that no third party has a realistic shot at winning electoral votes. I have had the outline of a contingency plan on how to modify the site to accommodate 3rd parties that might win electoral votes, but activating it would take quite a lot of work. If a 3rd candidate had gotten to that position a month or two ago, the site would definitely have been revamped to adjust for that possibility. As it is, there simply may not be time to do that before election day.
Right now the Real Clear Politics average in Utah, which includes McMullin, stands at Trump 31.8%, Clinton 25.5%, McMullin 22.8%, Johnson 8.8%, Stein 1.0%. (The Election Graphs Utah average currently stands at Trump 39.0%, Clinton 26.8%, but doesn’t yet include at least one poll that came out as this update was being finalized.) If and when the RCP average shows McMullin within 5% of the lead in the state, I will at the very least put notes at appropriate places on the site noting he has the possibility of winning 6 electoral votes. I will consider more substantial changes only if time allows.
For more information…
This post is an update based on the data on ElectionGraphs.com. Election Graphs tracks both a poll based estimate of the Electoral College and a numbers based look at the Delegate Races. All of the charts and graphs seen in this post are from that site. Additional graphs, charts and raw data can be found there. Follow @ElectionGraphs on Twitter or like Election Graphs on Facebook to see announcements of updates or to join the conversation. For those interested in individual general election poll updates, follow @ElecCollPolls on Twitter for all the polls as they are added. If you find the information in these posts interesting or useful, please consider visiting the tip jar.
Edit 22:51 UTC to add McMullin note.
States with new poll data added since the last update: All 50 states, DC, and the Maine congressional districts
Notable changes in: Arizona, Indiana, Maine (CD2), and the tipping point
National Summary
At this point we have many polls that are fully or partially after the “Trump Tape” release on the 7th, but this batch of polls still included many where most of the time in the field was before that. And of course the state averages here are based on at least the last five polls in each state, so reach even further back in time. The close states tend to be based on polls with middates going back 1-3 weeks.
All that is to say that the changes we are seeing now are starting to include the fallout from that event, but haven’t yet fully factored it in.
With that out of the way, the changes for this round:
- The expected result moves from Clinton by 176 EV to Clinton by 154 EV
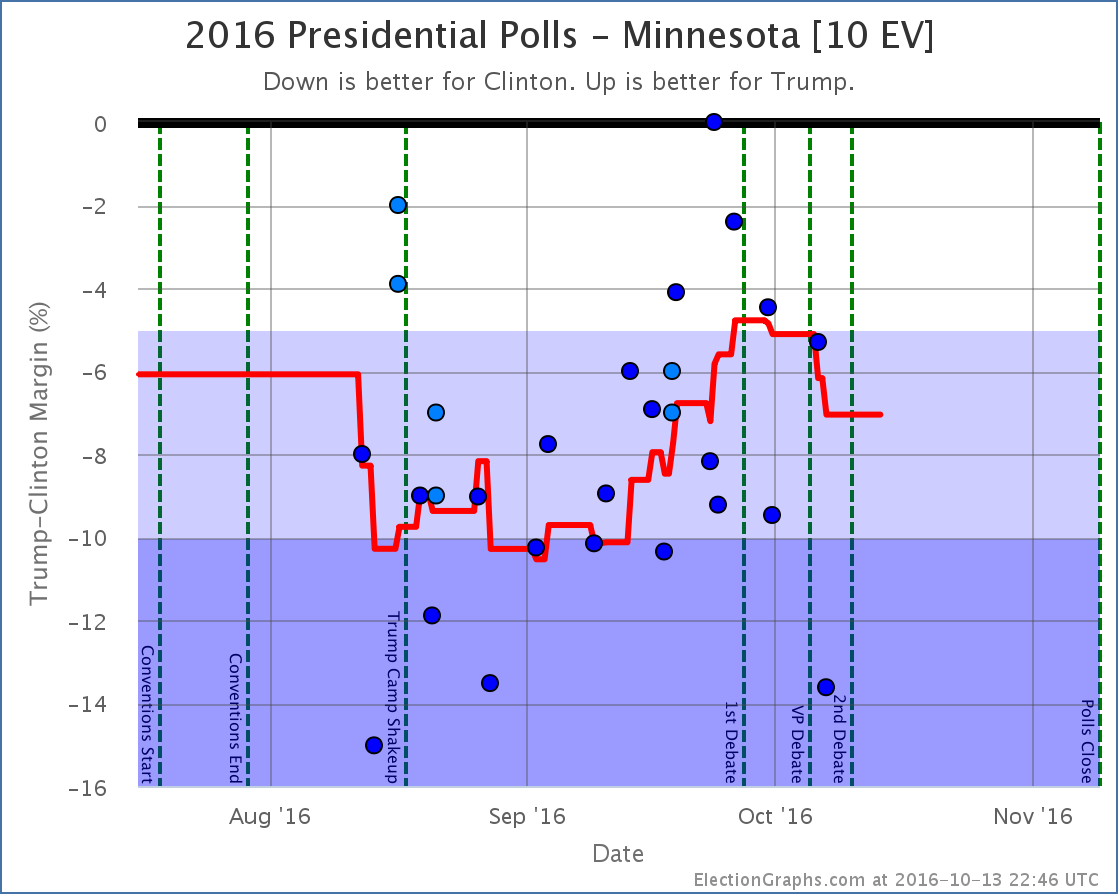
- The tipping point moves from Clinton by 5.9% in MN to Clinton by 6.5% in PA
- Clinton’s best case improves from winning by 202 EV to winning by 226 EV
So wait, the expected result moved toward Trump! Why is the title of this post about Trump’s drop continuing?
Well, basically because the improvement in the expected case is a result of Arizona moving from just barely Clinton, to just barely Trump. Either way it is really too close to call. It may flip back again with the next update. Or maybe it won’t.
But meanwhile, polling changes in Minnesota, Virginia, and Pennsylvania moved the tipping point further toward Clinton, meaning that overall Trump has to move polls even further in order to actually flip the results of the election.
And Clinton expanded her best case a bit as well.
Here are the charts:
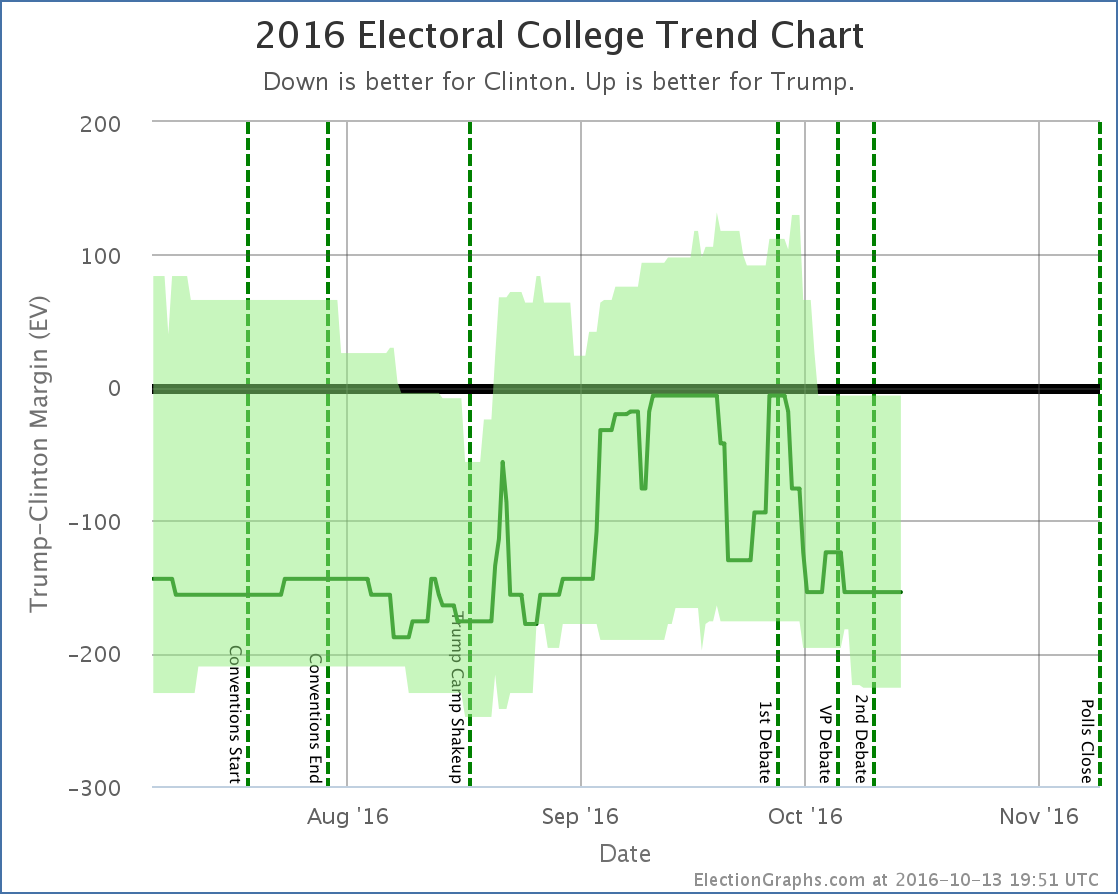
The trend in both charts is clear. After peaking right before the 1st debate Trump has been falling. This is more dramatic in the tipping point chart, but it is clear no matter which way you look at the race.
There is no time left for a Trump comeback from behind win from these levels. It would take something massive that would completely reverse everything we know about this race so far. It would be an unprecedented reversal. Impossible? No. Incredibly unlikely? Yes.
A few weeks ago Trump had managed to make this race close. But it was short-lived. Starting with the debate he has been dropping steadily. We don’t yet have signs that we have hit bottom either. There have been new negative stories about Trump almost every day. Further drops would not be surprising.
We’re no longer really talking about who will win this election. Clinton will win this election. The only question is by how much.
25.8 days left until we have the first actual election results.
State Details
Weak Clinton to Weak Trump
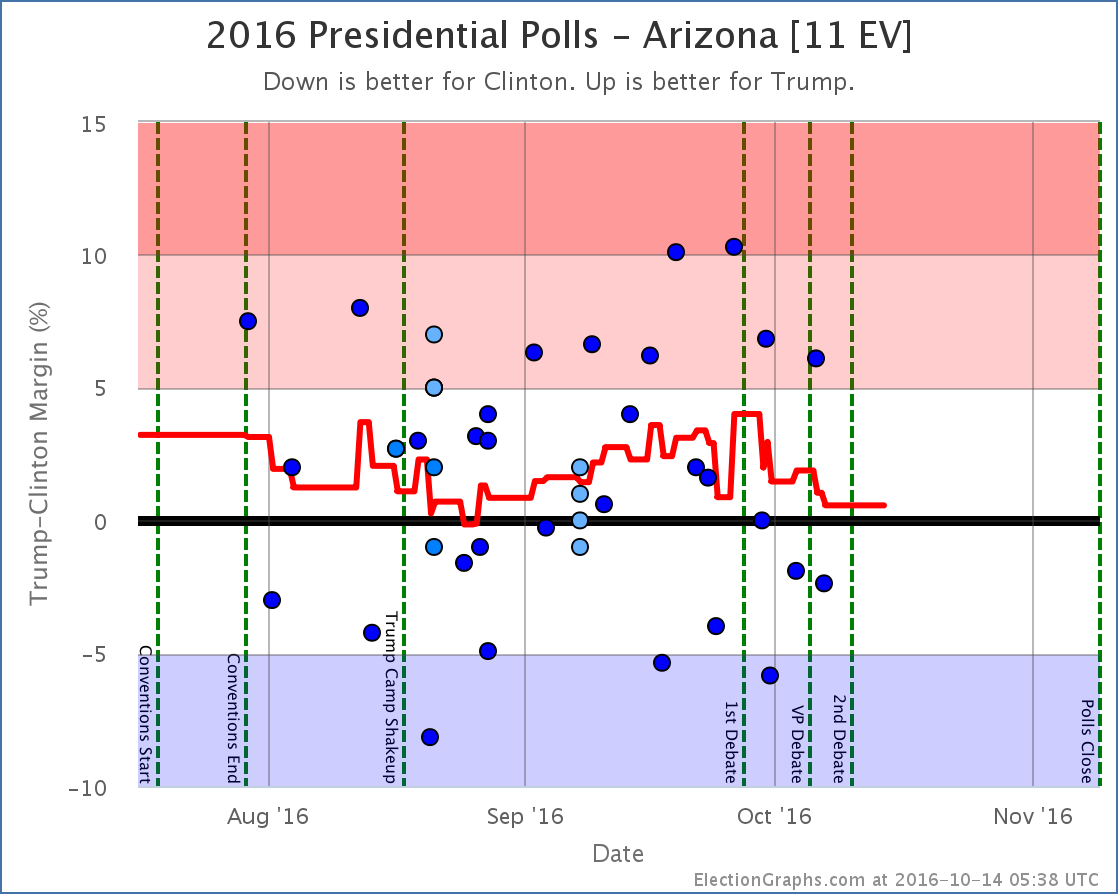
The latest polls not only move Arizona from Weak Clinton to Weak Trump, but since older polls were added, they actually moved the past curve Trumpward, such that we no longer have a recent period with Clinton in the lead at all. The trend has still been away from Trump toward Clinton since the 1st debate, but Clinton hasn’t pulled Arizona over to her side quite yet.
Moving into Clinton’s reach
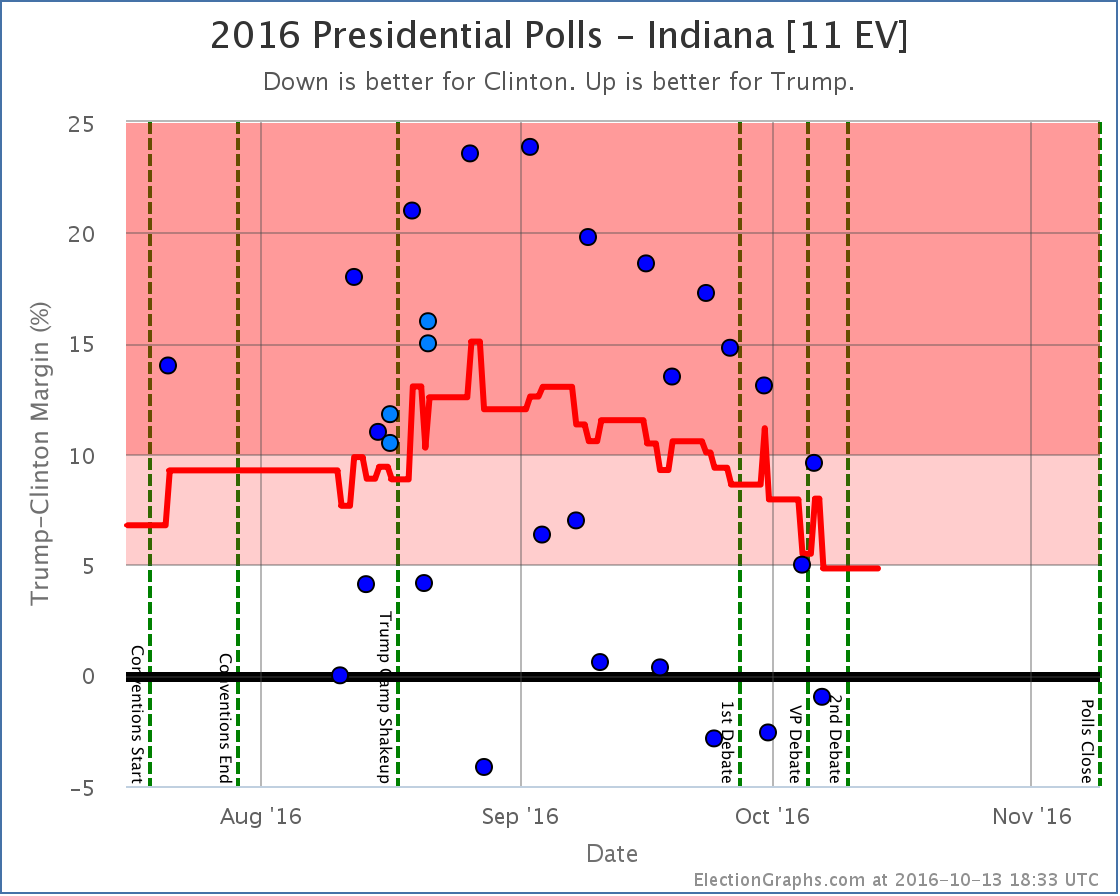
Trump’s lead in Indiana has been diminishing since late August. With the latest updates Trump is up 4.8%. Trump still leads, but it is now close enough that a Clinton win does not seem impossible. Still a stretch to be sure, but no longer unimaginable.
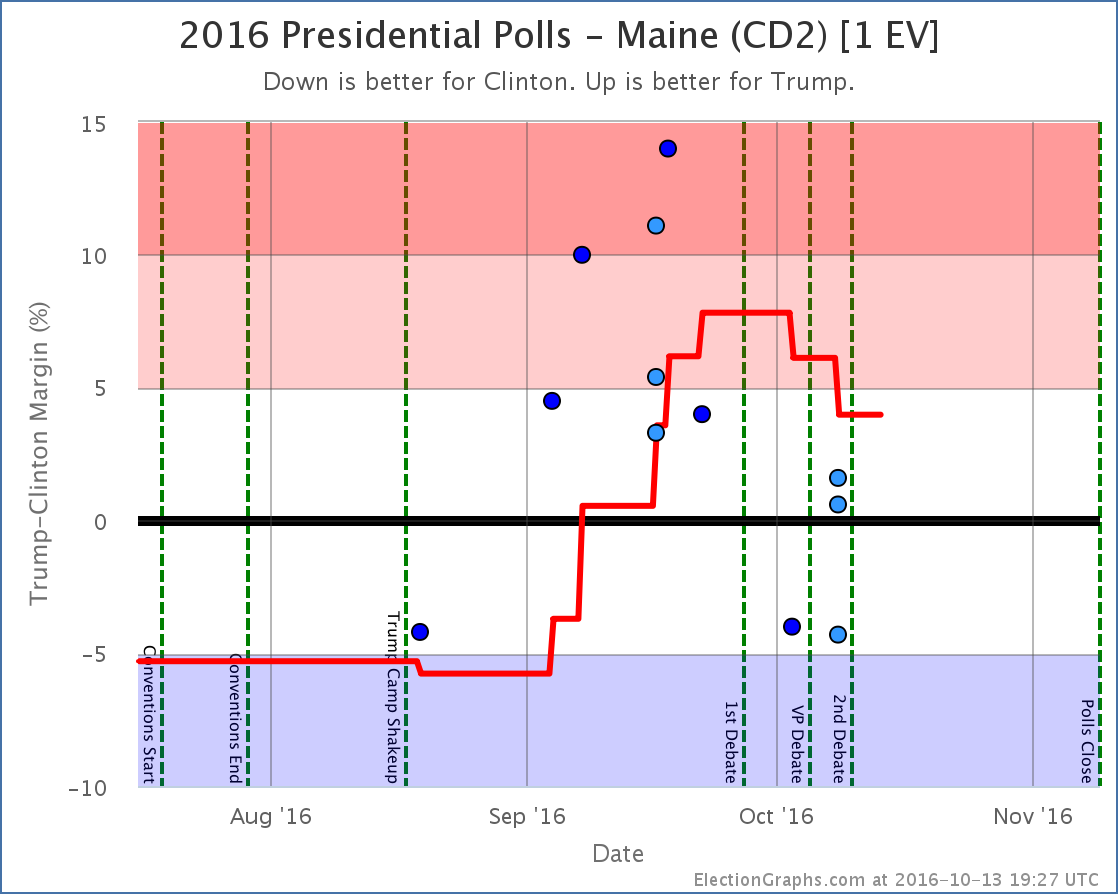
Maine’s 2nd congressional district had looked like it would definitely split from the state this cycle giving Trump a somewhat unusual pickup. With the post-debate polls, Trump still leads, but his lead is slipping, and so it now seems that this single electoral vote is now up for grabs. Clinton could steal it back.
States that moved the tipping point
For more information…
This post is an update based on the data on ElectionGraphs.com. Election Graphs tracks both a poll based estimate of the Electoral College and a numbers based look at the Delegate Races. All of the charts and graphs seen in this post are from that site. Additional graphs, charts and raw data can be found there. Follow @ElectionGraphs on Twitter or like Election Graphs on Facebook to see announcements of updates or to join the conversation. For those interested in individual general election poll updates, follow @ElecCollPolls on Twitter for all the polls as they are added. If you find the information in these posts interesting or useful, please consider visiting the tip jar.
On this week’s Curmudgeon’s Corner Ivan and Sam spend most of the show on Election 2016 again. On the Democratic side they talk about how after a short moment when it looked like he was embracing the inevitable, Sanders is once again fighting on against the odds. On the Republican side they discuss Trump’s victory, how we got to this point, how the Republican establishment will react, and what it all means for the general election. In addition to all that, there is also talk of the White House Correspondent’s Dinner, a county Democratic convention, Ivan’s travel… oh, and Sam’s 6 year old son Alex has some questions for the listeners.
Click below to listen or subscribe… then let us know your own thoughts!

Recorded 2016-05-04
Length this week – 1:42:04
 1-Click Subscribe in iTunes 1-Click Subscribe in iTunes
 View Podcast in iTunes View Podcast in iTunes
 View Raw Podcast Feed View Raw Podcast Feed
 Download MP3 File Download MP3 File
 Follow the podcast on Facebook Follow the podcast on Facebook
Show Details:
- (0:00:10-0:12:20) But First
- Ivan’s Flights
- Alex’s Questions
- Agenda
- Delegate Confusion
- (0:13:00-0:27:15) Election 2016: Democrats
- Indiana Results
- Sanders still fighting!
- Annoying the superdelegates
- Ways Clinton is Winning
- Contested Convention?
- Over Over Over
- (0:28:35-1:03:29) Election 2016: Republicans
- Indiana Results
- Trump Ascendant
- Cruz Drops Out
- No Rules Changes
- Last Trump/Cruz attacks
- Trump is the Nominee
- How did it happen?
- How will elected Republicans respond?
- Predicting November
- Trump Win Scenarios
- How big a Clinton win?
- (1:04:32-1:18:55) White House Correspondents Dinner
- Obama’s Routine
- Boehner and House Divisions
- Differences in Trump/Clinton surrogates
- Potential Trump VPs
- Wilmore’s Routine
- (1:20:10-1:41:44) Snohomish County Democratic Convention
- Reaction to Senator Murray and Rep Larson
- Platform Nonsense
- Reaction to Rep DelBene
- Resolutions
- Motion to Reject
- How not to convince a superdelegate
- iTunes Reviews
Trump won all 57 delegates in Indiana.
This was the last stand of the anti-Trumps. Cruz announced he was dropping out shortly after the state was called for Trump. Kasich is still in it, but hasn’t shown any delegate gathering ability that would indicate he could make a difference.
Even with a loss in Indiana, Trump would almost certainly have won in the end. That has been clear for a couple weeks now. But he didn’t lose Indiana, he shut everyone else out completely.
Trump hasn’t wrapped things up quite yet, he still has to collect a few more delegates. But something unexpected and dramatic would have to happen to stop him from getting there.
The Republican race is now in the same state as the Democratic race has been for awhile. The outcome is known, and we’re just watching the winner mop up the last few delegates they need.
So time to look at the graphs:
My best estimates of the delegate totals (including preferences of officially uncommitted delegates) is now:
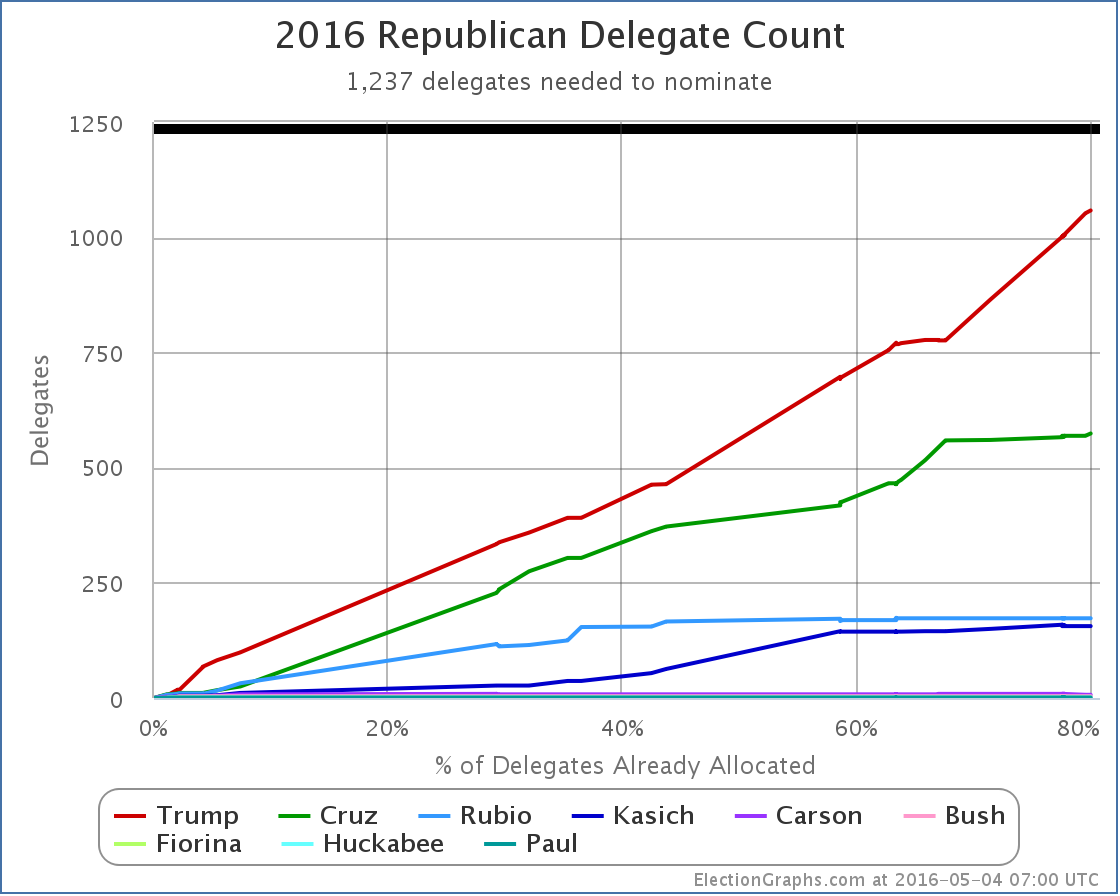
Trump 1058, Cruz 574, Rubio 173, Kasich 156, Carson 7, Bush 4, Fiorina 1, Huckabee 1, Paul 1.
(In addition to the 57 delegates from Indiana for Trump, this includes adjustments since last week that total: Cruz +6, Kasich -2, Carson -2, Trump -3.)
This means Trump now needs 179 of the remaining 497 delegates to wrap this up.
Which brings us to the % needed chart:
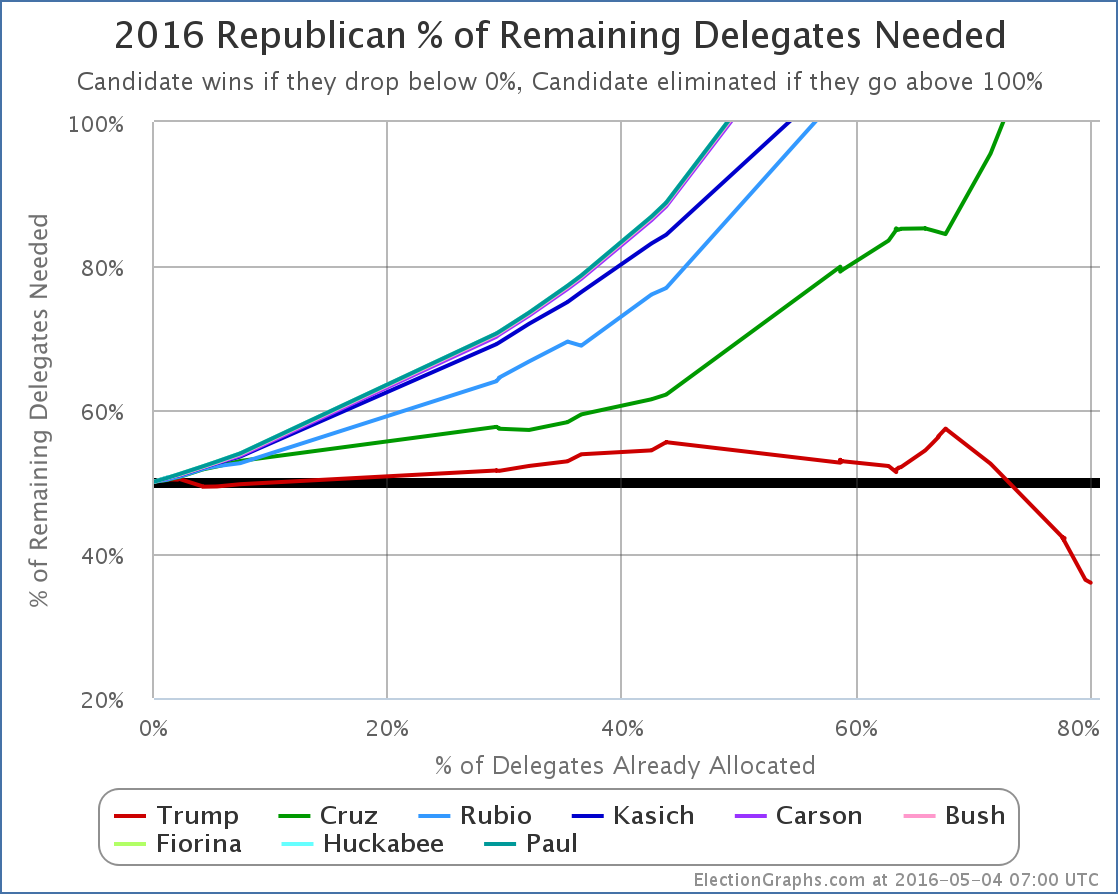
Trump now needs 36.02% of the remaining delegates to get to the magic number of 1237.
The remaining contests are essentially now just Trump vs Kasich. Unless you believe Kasich is suddenly going to start winning delegates in every remaining state by 64% to 36% margins despite getting less than 8% of the delegates so far, Trump will do what he needs to do. He will probably do much better than he needs to do.
So he will win, and he will win outright. No contested convention, just an outright win.
If there had been enough “Shadow anti-Trump” delegates… those that were pledged to Trump, but really supported someone else, then there may have been the ability to change the rules to unbind the delegates, opening up a back door for someone else to win even if Trump had the nominal majority. The fact that Cruz dropped out after Indiana indicates that those numbers just were not there…
And so we’re essentially done.
ElectionGraphs.com will continue to document this process, but now it is just a matter of watching Trump gather up the remaining delegates needed. There is no question any more how this will play out.
Unless a metaphorical meteor (or a literal one I guess) hits Clinton or Trump, we have our nominees. The general election is lined up. We are going to be watching Clinton vs Trump.
Update 2016-05-11 06:32 UTC – Adjustments from American Samoa’s uncommitted delegates, and Louisiana’s uncommitted delegates as well as Louisiana’s now free Rubio delegates. Net result: Trump +14, Cruz -3, Rubio -5.
Note: This post is an update based on the data on ElectionGraphs.com. Election Graphs tracks both a poll based estimate of the Electoral College and a numbers based look at the Delegate Races. All of the charts and graphs seen in this post are from that site. Additional graphs, charts and raw data can be found there. All charts above are clickable to go to the current version of the detail page the chart is from, which may contain more up to date information than the snapshots on this page, which were current as of the time of this post. Follow @ElectionGraphs on Twitter or like Election Graphs on Facebook to see announcements of updates or to join the conversation. For those interested in individual general election poll updates, follow @ElecCollPolls on Twitter for all the polls as they are added.
Sanders won Indiana’s pledged delegates 44 to 39.
So he got 53.01% of the delegates. He needed 80.92% to be on a pace to catch up with Clinton.
But it is actually worse. That 80.92% was as of the results from the Northeast last week. Since then between superdelegate announcements and a revision to the Ohio results, there was a net change of Clinton +11, Sanders -1. If you add that in, you get Clinton +50, Sanders +43 since last week. So actually Sanders only got 46.24% of the recent delegates.
Which means, of course, that Clinton just continued her march to the nomination and improved her position despite Sanders’ win.
Here come the graphs:
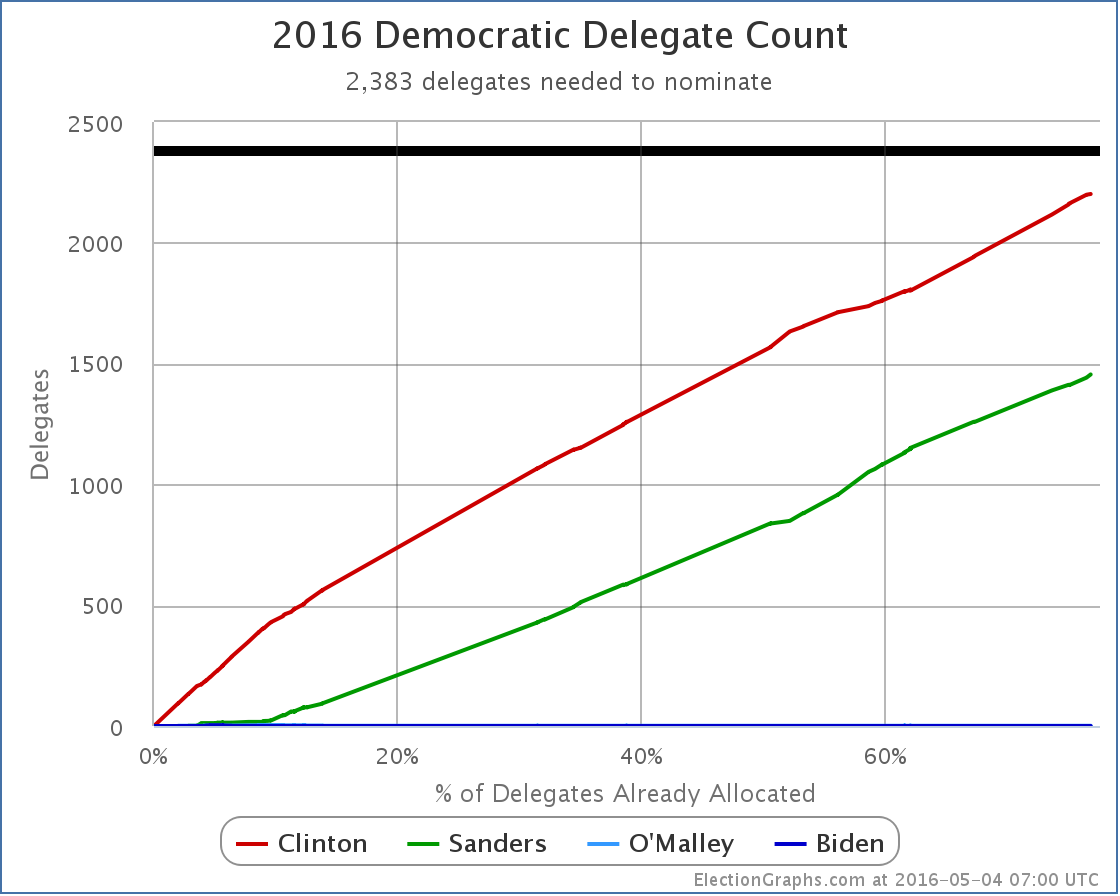
The totals are now Clinton 2202, Sanders 1455, O’Malley 1. Clinton only needs 181 of the 1107 remaining delegates to wrap this up.
Which brings us to…
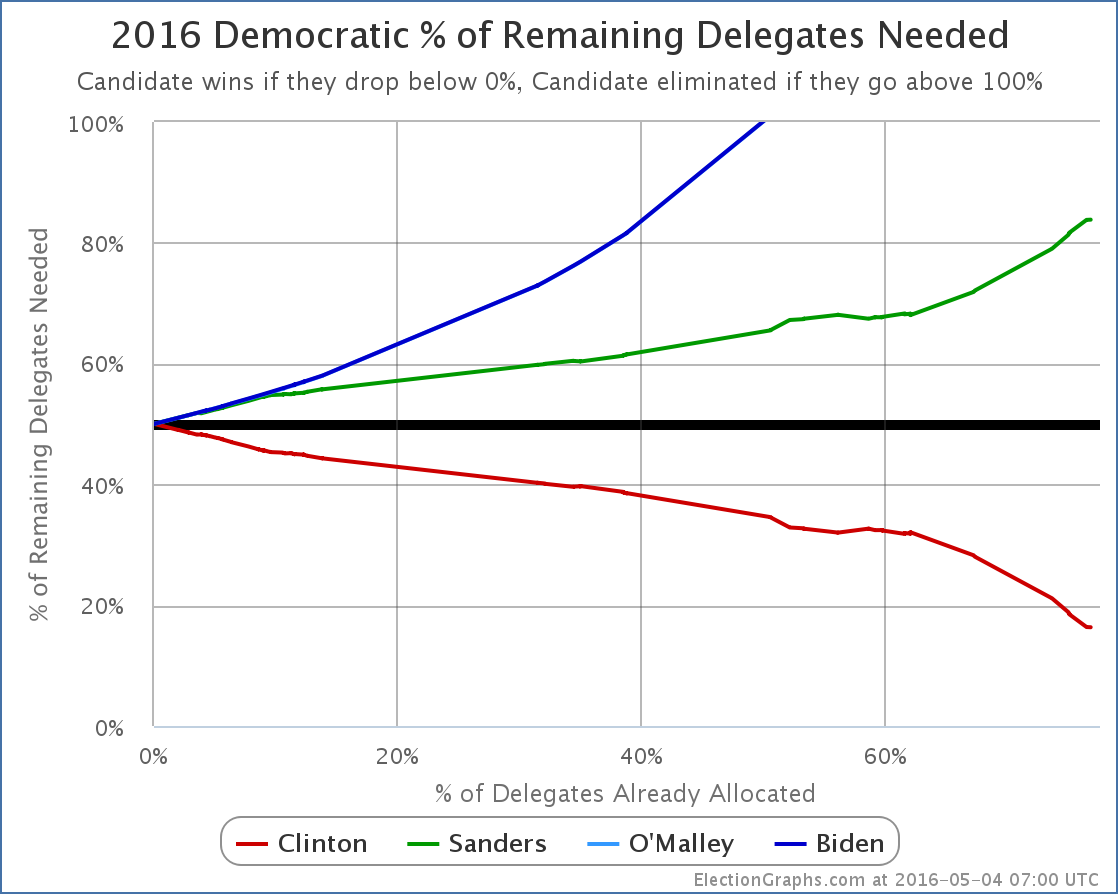
Clinton now only needs 16.35% of the remaining delegates to win. Sanders needs 83.83%.
Massive superdelegate defections could alter this, but there have never been any signs of such movement, and there are none now.
For a long time now the result has been clear absent a catastrophic change. As we have fewer and fewer delegates left, the curves above will move more quickly toward the final result, and it will be more and more difficult to get a result that would even slow it down.
ElectionGraphs.com will continue to document this process, but there is little to no drama left, it is just a matter of watching Clinton gather up the remaining delegates needed.
Update 2016-05-08 01:57 – Superdelegate update, net change Clinton +3. Update from Mississippi, net change Clinton -1, Sanders +1.
Note: This post is an update based on the data on ElectionGraphs.com. Election Graphs tracks both a poll based estimate of the Electoral College and a numbers based look at the Delegate Races. All of the charts and graphs seen in this post are from that site. Additional graphs, charts and raw data can be found there. All charts above are clickable to go to the current version of the detail page the chart is from, which may contain more up to date information than the snapshots on this page, which were current as of the time of this post. Follow @ElectionGraphs on Twitter or like Election Graphs on Facebook to see announcements of updates or to join the conversation. For those interested in individual general election poll updates, follow @ElecCollPolls on Twitter for all the polls as they are added.
This week on the Curmudgeon’s Corner podcast Sam and Ivan spend most of the show on Election 2016. On the Republican side they discuss how recent results and the polls of upcoming states seem to be closing the door on the possibility of a contested convention and pointing to a straight up Trump nomination, as well as discussing Cruz/Fiorina, and what might make Trump worse than Cruz. On the Democratic side the discussion is on how Sanders seems to be finally admitting defeat, and on the veepstakes! Finally, they wrap it up with a lightning round covering all sorts of other issues they haven’t gotten around to lately.
Click below to listen or subscribe… then let us know your own thoughts!
Recorded 2016-04-28
Length this week – 1:40:24
1-Click Subscribe in iTunes
View Podcast in iTunes
View Raw Podcast Feed
Download MP3 File
Follow the podcast on Facebook
Show Details:
- (0:00:10-0:05:41) But First
- Agenda
- Noisy Ivan
- The Beep is Back
- (0:06:25-0:59:59) Election 2016: Republicans
- PA/MD/CT/RI/DE Results
- PA Uncommitted Delegates
- Where Trump is in the Delegate Race now
- Indiana Polls
- California Polls
- Projections for the rest of the race
- Bye Bye Contested Convention Scenarios
- Cruz/Kasich Deal
- Cruz/Fiorina 2016!
- Presidential Trump
- Trump Foreign Policy?
- Trump vs Cruz, who is worse?
- (1:01:07-1:10:29) Election 2016: Democrats
- Bernie admitting he is done?
- Veepstakes
- Median Voter vs Base
- (1:11:08-1:40:04) Lightning Round
- Bathroom Laws
- Germany/Turkey free speech issue
- Matthew Keys Case
- The Chalkening
- Tubman $20
- Movie: The Gentle Leader Way
- Brexit
- Prince
- Brazil
- Apple Earnings
- Saudi No Oil Plan
- Car vs Helicopter
In the latest Curmudgeon’s Corner Sam and IvГЎn talk about:
* [0:00:10-0:07:40] Slow Computer / Intro
* [0:08:44-0:36:01] Indiana Religious Freedom Law (and related)
* [0:36:39-0:54:36] New Daily Show Host / Political Correctness
* [0:55:36-1:06:36] Professional Networking
* [1:07:45-1:29:15] Lightning Round

Recorded 2015-04-02
Length this week – 1:29:35
1-Click Subscribe in iTunes
Download MP3 File
View Podcast in iTunes
View Raw XML Feed
Edit 2015-04-10 10:23 UTC to correct the date the show was recorded.

 \ \
|
Romney |
Obama |
| Romney Best Case |
310 |
228 |
| Current Status |
206 |
332 |
| Obama Best Case |
190 |
348 |
The summary is the same. This won’t start changing until some of the close states start getting called.
|
|