This is the website of Abulsme Noibatno Itramne (also known as Sam Minter).
Posts here are rare these days. For current stuff, follow me on Mastodon
|
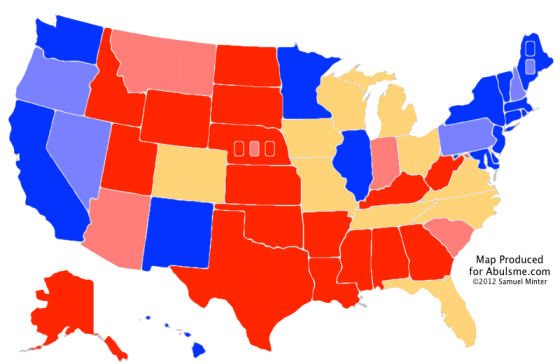
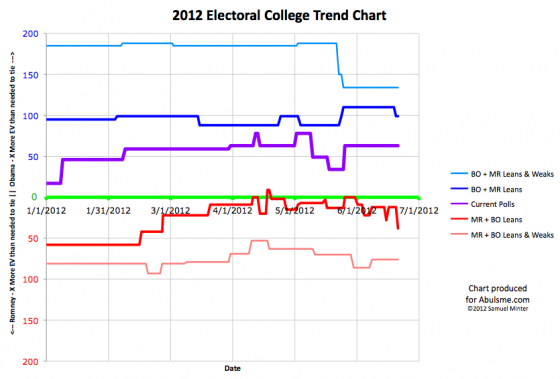
Chart and map from the Abulsme.com 2012 Electoral College Prediction page. Both assume Obama vs Romney with no strong third party candidate. Both show polling as it currently exists. Things will change before election day. On the map red is Romney, blue is Obama, gold states are too close to call. Lines on the chart represent how many more electoral votes a candidate would have than is needed to tie under several different scenarios. Up is good for Obama, Down is good for Romney.
Two states moving today, both toward Romney:
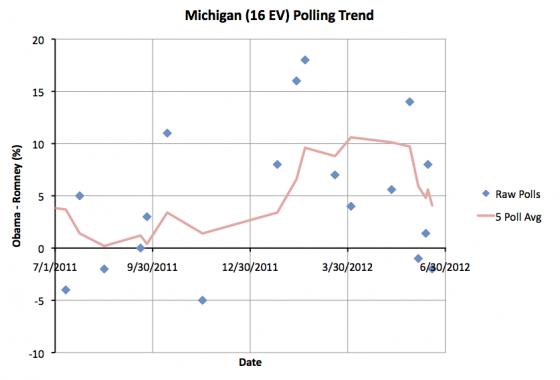
First up, Michigan, with 16 electoral votes. In the last week Obama’s lead in the five poll average in Michigan dropped below 5%, then popped back above 5%, and now it once again drops below 5%. At the moment it sits at a 4.1% lead. The trend toward Romney over the last few polls seems clear though, and this puts Michigan once again into my swing state category.
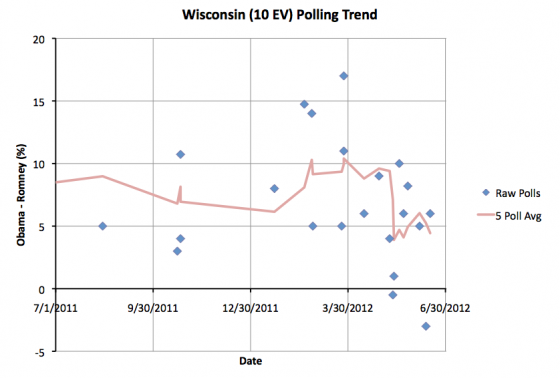
Now Wisconsin, with 10 electoral votes. Wisconsin is looking pretty similar to Michigan. It is also a state where Obama’s lead was briefly over 10% in the spring, but where Obama’s lead has been deteriorating since then. The five poll average had dipped below 5% in mid-May, popped back above 5% on June 8th… and now is falling back below that level again with the latest poll. Obama’s lead in Wisconsin now sits at 4.4%. So Wisconsin becomes a swing state again too.
With both of these states now “too close to call” as far as my model is concerned, Romney’s “best case” improves significantly:
|
Romney |
Obama |
| Romney Best Case |
307 |
231 |
| Current Status |
206 |
332 |
| Obama Best Case |
170 |
368 |
Just yesterday, I was talking about how the current state of the race was about the same as it was two months ago and if Romney wanted to change this, he should get started. So is this the start of that?
Well, maybe. But last time I said it looked like Romney was breaking out, the very next day a new poll moved things back in the other direction. So I’m going to refrain from drawing any conclusions like that yet, even though Romney’s best case is better than it has been since February, he has many more paths to victory than he did in April and May, and not even Florida is a “must win” state any more.
No question that this does look very good for Romney. If the next few polls keep Michigan and Wisconsin close, and if more polls in the “Lean” and “Weak” categories show movement toward Romney, then we’ll know that this isn’t just fluctuations in the polls, but is real motion in Romney’s direction. I just don’t want to jump the gun again.
Obama still has a significant advantage and would be a heavy favorite to win if the election was held today. But stay tuned! If there is broad based movement toward Romney, and a few more critical states move in his direction, things will start looking a lot more competitive and a lot more interesting in a hurry!
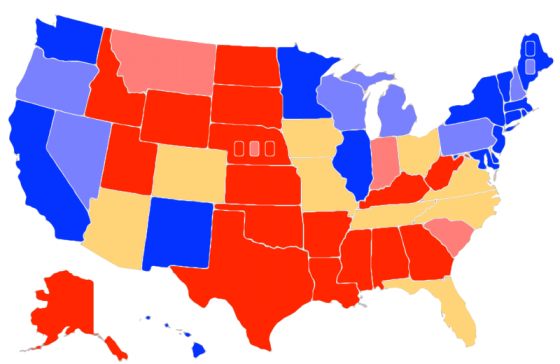
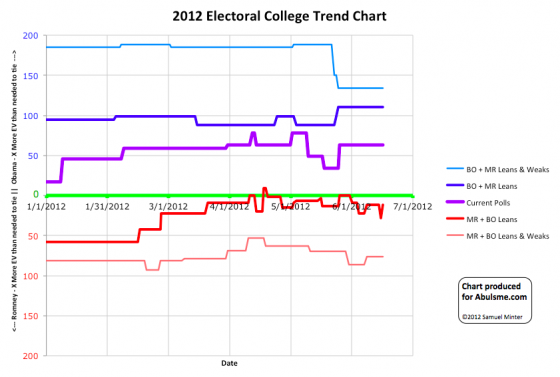
Chart and map from the Abulsme.com 2012 Electoral College Prediction page. Both assume Obama vs Romney with no strong third party candidate. Both show polling as it currently exists. Things will change before election day. On the map red is Romney, blue is Obama, gold states are too close to call. Lines on the chart represent how many more electoral votes a candidate would have than is needed to tie under several different scenarios. Up is good for Obama, Down is good for Romney.
So, um, the change from yesterday, I guess, well, never mind:
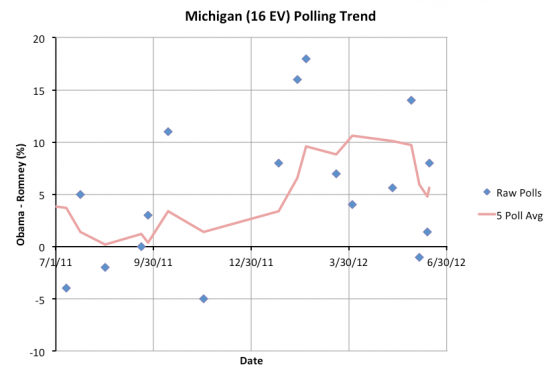
So, yesterday a new poll pulled Obama’s lead in the five poll average in Michigan under 5%. Today another new poll pulls that lead back up over 5% again. Easy come, easy go I guess. This takes Michigan once again out of the set of states we consider going both ways in our models.
|
Romney |
Obama |
| Romney Best Case |
281 |
257 |
| Current Status |
206 |
332 |
| Obama Best Case |
159 |
379 |
So, we can, for the moment anyway, just take everything I said yesterday about momentum in Romney’s direction, and say “OK, maybe not so much after all”. Romney’s best case is now back in the range it has been ever since the end of February, with relatively narrow paths to victory. Maybe we’ll see a more permanent move in that direction soon… but not yet.
Meanwhile, one final correction due to the data from a spreadsheet provided by Darryl at HorsesAss. With more precise information from a poll back in February, one of Wisconsin’s transitions, from Weak Obama to Strong Obama, moves from March 30th to March 31st. The rest of Wisconsin’s history stays the same (it has moved around several times), as does the current situation as a “Weak Obama” state where Obama leads by between 5% and 10%. This only affects the older part of the historical chart. That chart is adjusted starting with today’s update.
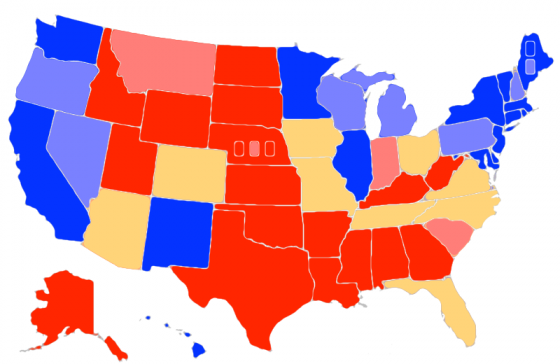
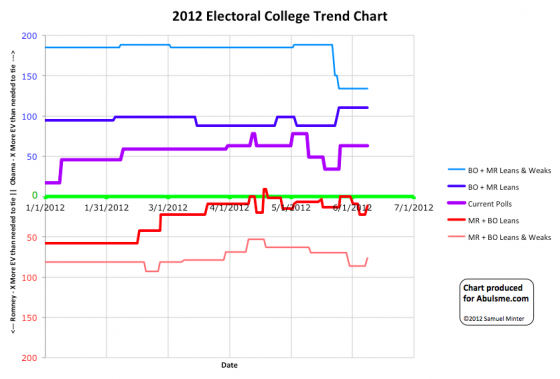
Chart and map from the Abulsme.com 2012 Electoral College Prediction page. Both assume Obama vs Romney with no strong third party candidate. Both show polling as it currently exists. Things will change before election day. On the map red is Romney, blue is Obama, gold states are too close to call. Lines on the chart represent how many more electoral votes a candidate would have than is needed to tie under several different scenarios. Up is good for Obama, Down is good for Romney.
Two states change status today, and they are both moves in Obama’s direction:
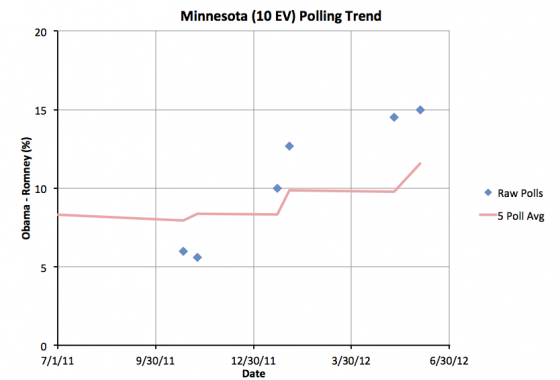
First up, Minnesota (10 ev) moves to “Strong Obama” as Obama’s lead in the state in the five poll average tops 10%. Minnesota has been pretty sparsely polled. Obama has always been significantly ahead in Minnesota, but some polls from last year had it close enough that maybe Obama would need to do a little defense in Minnesota. With the new polls, it is looking like Minnesota is safe enough that Obama can essentially ignore it. At least for now.
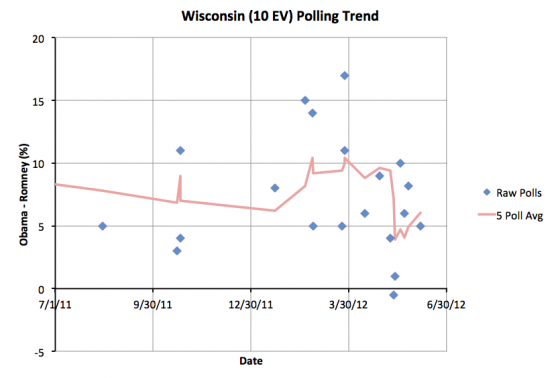
Second and more importantly, Obama’s lead in Wisconsin once again moves over 5%. From May 17th until today Obama’s lead had dropped below 5%, leading me to classify Wisconsin as only “Lean Obama” and therefore as a swing state. This weakening appears to have been short lived. Wisconsin is now back in the “Weak Obama” status, meaning that Obama has a significant lead, but not a big enough lead to feel safe about the state and ignore it.
Of these two changes, only Wisconsin effects the range of scenarios, reducing Romney’s margin in his best case, since that state is no longer on the table for him.
|
Romney |
Obama |
| Romney Best Case |
281 |
257 |
| Current Status |
206 |
332 |
| Obama Best Case |
159 |
379 |
This now gives Romney a 12 electoral vote margin above the 269 he needs to tie. This makes Florida (29), Ohio (18), North Carolina (15) and Virginia (13) all into “must win” states for Romney. He can afford to lose any one of Arizona (11), Tennessee (11), Missouri (10), Colorado (9) or Iowa (6), but not two.
Finally, as I continue to go through the old data provided by Darryl at HorsesAss I find another old poll that requires a correction to my time series chart. This time it is an old Tennessee poll from October 2011. Frankly, it looks very much like an outlier compared to other Tennessee polls, showing Romney ahead by 18%, where his strongest showing in any other poll was a 7% lead, but it is a poll I would have included had I known about it, so there it is. The result of including this poll is to change the date when Tennessee moved from “Weak Romney” where it started the year to “Lean Romney” where it is now from March 2nd to May 24th. This is an almost three month move because Tennessee has been very sparsely polled. This only changes the historical status, not where Tennessee is today, which is a 4.2% Romney lead in the five poll average, making Tennessee a “swing state” in our model, but just barely.
The historical graphs have been corrected as of today’s post.
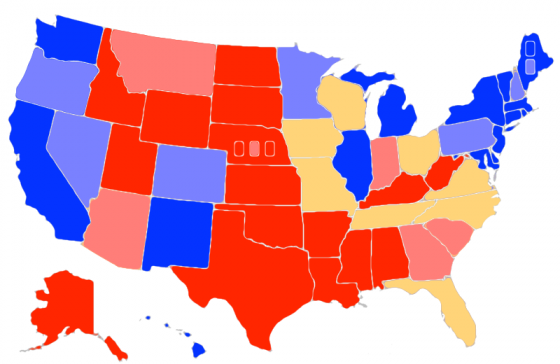
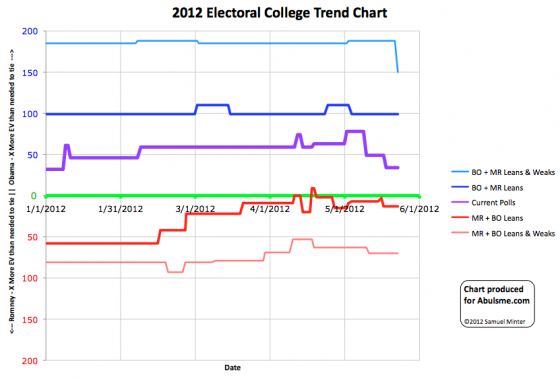
Chart and map from the Abulsme.com 2012 Electoral College Prediction page. Both assume Obama vs Romney with no strong third party candidate. Both show polling as it currently exists. Things will change before election day. On the map red is Romney, blue is Obama, gold states are too close to call. Lines on the chart represent how many more electoral votes a candidate would have than is needed to tie under several different scenarios. Up is good for Obama, Down is good for Romney.
One state changes status today, and once again it is a move in Romney’s direction.
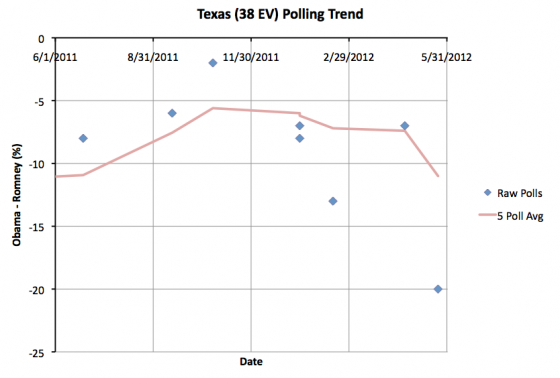
Texas, which was never a swing state by any means, but which for awhile looked like it might be a state where Romney would at least need to watch his back and play a little defense just to be sure it didn’t surprise anyone by starting to get competitive, is now moving back into the “Strong Romney” camp as Romney’s lead in the five poll average jumps to 11%. This is a surprise to precisely no one. :-)
Since Texas was never a swing state, this does not change the summary.
|
Romney |
Obama |
| Romney Best Case |
282 |
256 |
| Current Status |
235 |
303 |
| Obama Best Case |
170 |
368 |
The general trend in Romney’s direction which I mentioned last time continues. But to make a big positive difference in his situation, Romney needs to be pulling current “Weak Obama” states into the swing state category. Strengthening his lead in states he is already nicely ahead in may feel good, but it doesn’t have an impact on the election.
Unfortunately, I also have a correction to make regarding some older Wisconsin data. Thanks to a tip from Darryl at HorsesAss I found that I had mistakenly included a Washington State poll from February in the Wisconsin data (as well as in the Washington State data). The end result of this is that prior to today on the chart showing the history of the race so far, Wisconsin had been classified as a “Strong Obama” state from March 2nd to April 19th. With the erroneous poll backed out, Wisconsin should only have been “Strong Obama” from March 30th to April 19th. Starting with the chart in today’s post, the light red line indicating the number of excess electoral votes Romney would have if he won all swing states plus all of Obama’s weak states has been corrected to reflect this. Notes have also been placed in the March 2nd and March 30th updates to point out this correction.
In either case, since May 17th I have classified Wisconsin as a “Lean Obama” swing state.
Sorry for the error. It happens every once in awhile. :-)
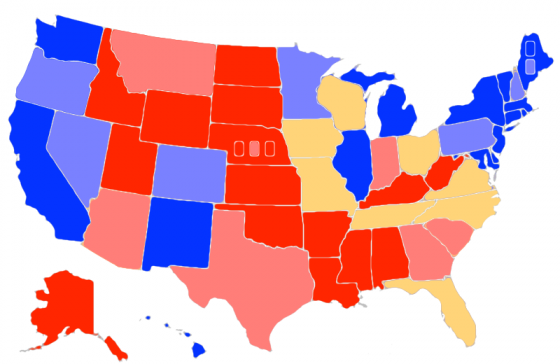
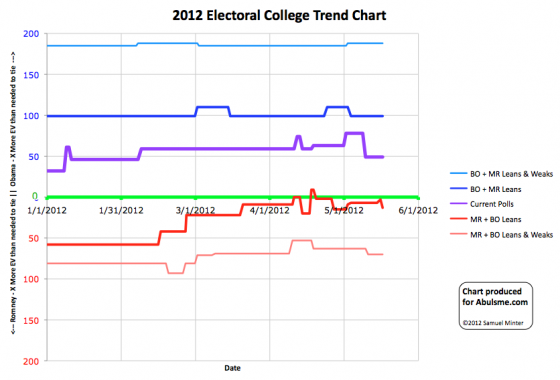
Chart and map from the Abulsme.com 2012 Electoral College Prediction page. Both assume Obama vs Romney with no strong third party candidate. Both show polling as it currently exists. Things will change before election day. On the map red is Romney, blue is Obama, gold states are too close to call. Lines on the chart represent how many more electoral votes a candidate would have than is needed to tie under several different scenarios. Up is good for Obama, Down is good for Romney.
One state changes status today, and it is a move in Romney’s direction:
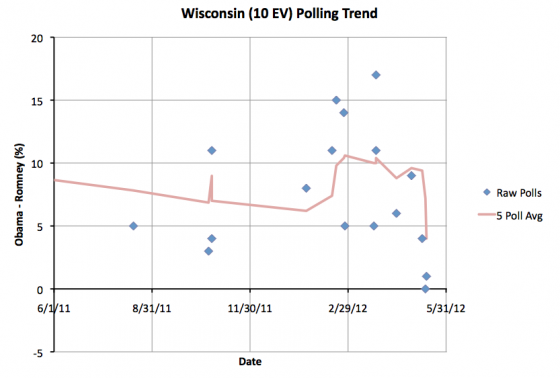
It seems like it was just yesterday when I was saying that if Romney pulled Wisconsin back toward being competitive it would open up more paths for victory to him. And boom, today Obama’s lead in the five poll average in Wisconsin drops from 7.2% down to 4.0%.
Looking at the history here, this is a veritable collapse for Obama in Wisconsin. Up through mid-April I’d classified Wisconsin as “Strong Obama” because his leads there were over 10%. There was even one poll showing him up by 17%! On April 19th the lead dropped to below 10% and I reclassified Wisconsin as “Weak Obama”. But the trend in May has been decidedly and dramatically toward Romney. The two most recent polls show a tie and a 1% Obama lead. There haven’t yet been any Wisconsin polls showing Romney actually ahead, but the margin is now clearly small enough that Wisconsin could easily go either way.
So we add Wisconsin into Romney’s best case scenario:
|
Romney |
Obama |
| Romney Best Case |
282 |
256 |
| Current Status |
220 |
318 |
| Obama Best Case |
170 |
368 |
This makes Romney’s path to victory much more flexible. Florida (29), Ohio (18) and North Carolina (15) are still “must win”. If any one of those went to Obama, Romney would be done. If he lost Virginia (13) we’d have a 269-269 tie, which would probably result in a messy Romney victory in the House of Representatives. But with the new set of swing states, he could afford to lose any one of Tennessee (11), Missouri (10), Wisconsin (10), or Iowa (6) and still win.
This move in Wisconsin is by far the most dramatic move we’ve seen toward Romney yet in the state polls. As more polls come in for other states, the question will be if this move in Wisconsin is the first sign of more general moves toward Romney in many states, or if there is something Wisconsin specific going on here… perhaps spillover from the Walker recall battle or some such.
A state moving all the way from “Strong” support of a candidate to being a swing state in less than a month though is a pretty dramatic move. If Romney can produce that kind of motion in a few more states, this analysis will very quickly start showing a much more competitive race!
Edit 2012 May 20 06:38 UTC – Fixed Map, SC was incorrectly colored as a swing state, it is now correctly colored as “Weak Romney”.
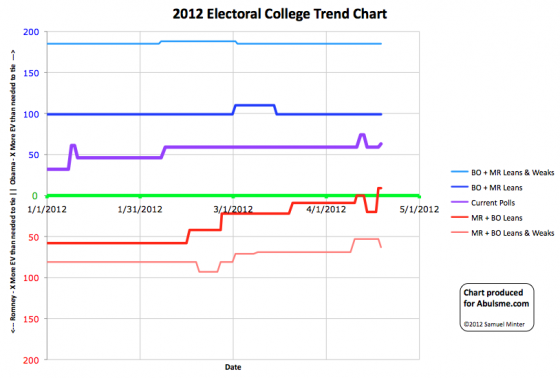
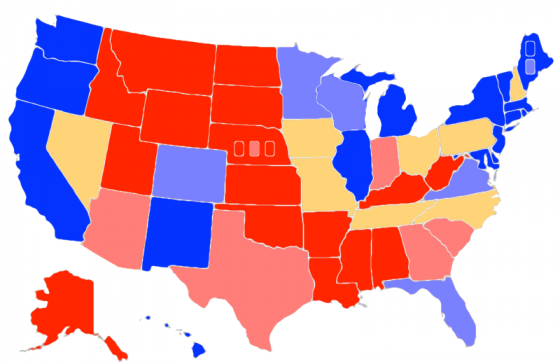
Chart and map from the Abulsme.com 2012 Electoral College Prediction page. Both assume Obama vs Romney with no strong third party candidate. Both show polling as it currently exists. Things will change before election day. Lines on the chart represent how many more electoral votes a candidate would have than is needed to tie under several different scenarios. Up is good for Obama, Down is good for Romney. On the map Red is Romney, Blue is Obama, Gold States are too close to call.
Two changes in our poll classifications today based on new additions to our five poll averages.
First, Obama’s lead in Wisconsin (10 electoral votes) drops to less than 10% bringing Wisconsin into the “Weak Obama” category. Since this is still not a swing state, our “Romney Best Case” scenario still doesn’t include Romney winning Wisconsin. But this does mean that Wisconsin is potentially in play. With the right combination of campaigning and events, Obama’s lead in Wisconsin could drop below 5%, putting it into contention as a swing state. It is not there today… Obama’s lead in the five poll average is still 8.8%… but it is close enough now to be worth spending time and money in the state.
Second, New Hampshire (4 electoral votes) moves from being just barely Romney to being just barely Obama. (Obama’s lead in the five point average is 1.7%, which is negligible and can disappear in an instant.) New Hampshire remains too close to call and therefore one of our swing states. But this does change our “everybody wins the states they are ahead in” scenario.
|
Romney |
Obama |
| Romney Best Case |
260 |
278 |
| Current Status |
210 |
328 |
| Obama Best Case |
170 |
368 |
Romney’s best case with current polling results remains a loss. And the “current status” improves for Obama because of New Hampshire.
But Wisconsin does show there is some movement in Romney’s direction at the moment. Over the last eight days we’ve seen Obama’s lead in RCP’s National Poll average drop from 5,4% to 1.7%. That is a very significant drop. We’ll see over the next few weeks as more state polls come in whether this starts to translate into electoral college gains as well. The expectation is that as long as the national poll trend is sustained, the state numbers will move correspondingly as soon as we have enough state polls to show it.
Edit 2012 Apr 19 07:10 UTC – Added number of electoral votes for each state mentioned.
Edit 2012 May 30 15:47 UTC – It turns out New Hampshire’s move from Lean Romney to Lean Obama should actually have happened on Mar 31. Details of correction and revised historical chart posted on May 30.
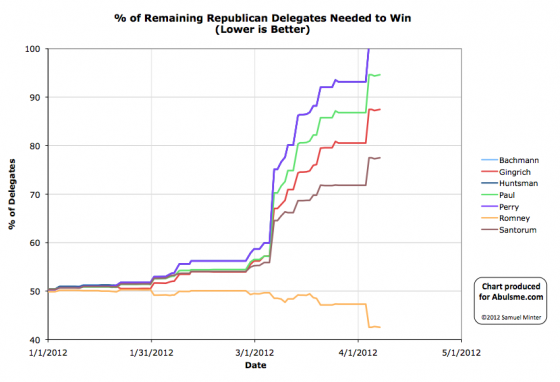
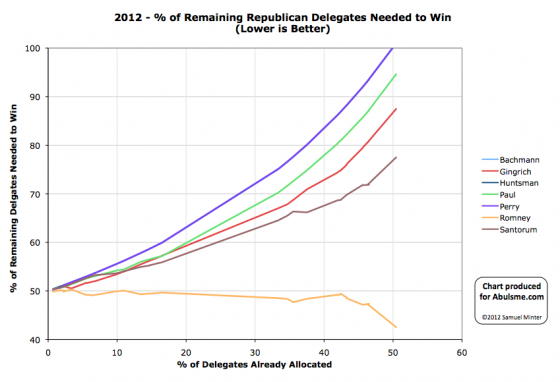
Charts from the Abulsme.com 2012 Republican Delegate Count Graphs page. When a candidate gets down to 0%, they have cinched the nomination. If they get up past 100%, they have been mathematically eliminated. The first chart is by date, the second is by “% of Delegates Already Allocated”. These numbers include estimates of the eventual results of multi-stage caucus processes which will be refined as the later stages occur.
So… remember yesterday when I removed three delegates from Romney’s column because Green Papers decided the three super delegates in Wisconsin were not bound by the primary results? Well, in today’s update they put them back. They are now officially “uncommitted” in their hard count, but are Romney in the soft count (which we use for these charts). The soft count indicates not just the official status, but other indicators of the ways the delegates are likely to vote.
In any case, this reverts things to how they were a couple days ago on our charts.
I’m sure Romney will breathe a lot easier with these three delegates back in his column. :-)
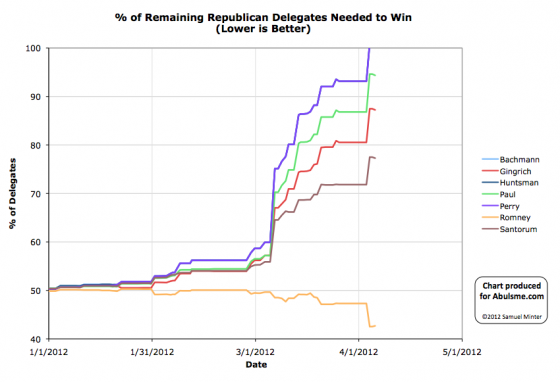
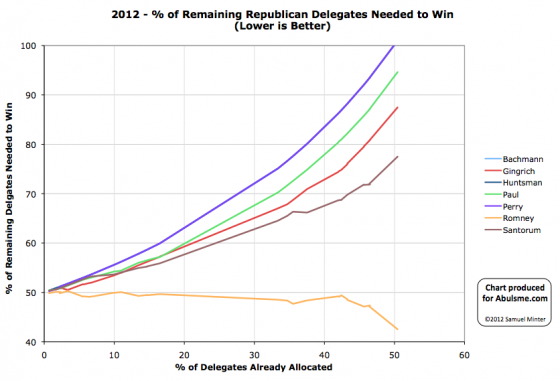
Charts from the Abulsme.com 2012 Republican Delegate Count Graphs page. When a candidate gets down to 0%, they have cinched the nomination. If they get up past 100%, they have been mathematically eliminated. The first chart is by date, the second is by “% of Delegates Already Allocated”. These numbers include estimates of the eventual results of multi-stage caucus processes which will be refined as the later stages occur.
So, Green Papers updated their Wisconsin numbers. They had been 33 Romney, 9 Santorum. They are now 30 Romney, 9 Santorum, 3 still available. Green Papers’ latest update commentary indicates that they had previously thought these superdelegates were bound by the primary results, but it turns out they are not. DCW still says however that those superdelegates are bound by the election results and don’t have independent free choice here, in which case they probably really should be in the Romney column. In fact DCW only made that change on the 4th. So I’m not really sure who is right here.
For purposes of our counts, we go with Green Papers though, so Romney loses the three delegates from his count. If information is found that these superdelegates are bound after all, Green Papers will update accordingly.
The changes to the “% of remaining delegates needed to win” number:
- Romney: 42.5% -> 42.7%
- Santorum: 77.5% -> 77.3%
- Gingrich: 87.5% -> 87.2%
- Paul: 94.6% -> 94.4%
So bad for Romney (since he loses 3 delegates for now) and good for everybody else since these delegates are theoretically now up for grabs again.
But really, this changes nothing.
Romney is the nominee.
Edit 2012 Apr 6 07:07 UTC to refer to both GP and DCW’s views on the 3 superdelegates being bound after I found GP’s comments on this.
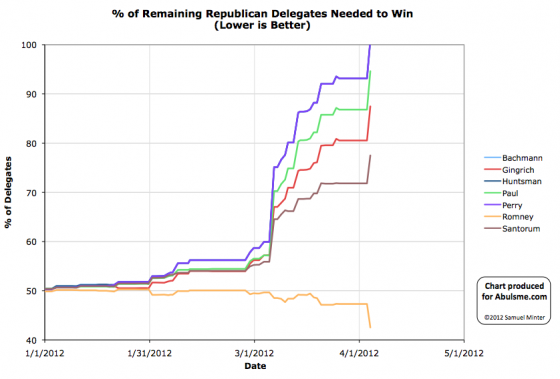
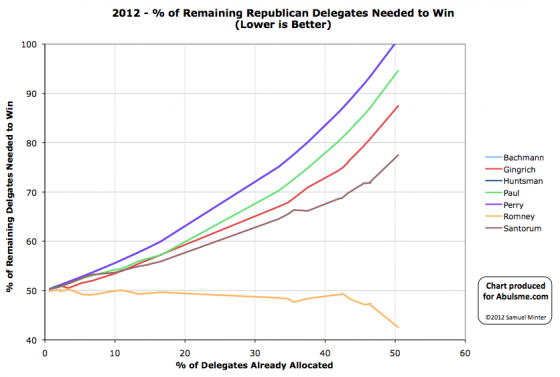
Charts from the Abulsme.com 2012 Republican Delegate Count Graphs page. When a candidate gets down to 0%, they have cinched the nomination. If they get up past 100%, they have been mathematically eliminated. The first chart is by date, the second is by “% of Delegates Already Allocated”. These numbers include estimates of the eventual results of multi-stage caucus processes which will be refined as the later stages occur.
So… this is it. Long ago any realistic possibility for any non-Romney to win the nomination disappeared. With today’s update the already long odds for the non-Romneys to keep Romney from getting to 1144 essentially drop to zero. This is over. Romney wins. Without any sort of brokered convention. For something else to happen now we’d need some event that was so earth shaking that Romney dropped out. This is extremely unlikely.
Details below.
We have updates from four contests. In alphabetical order:
- DC: DC is winner take all, Romney gets all 16 delegates.
- Maryland: Maryland is not actually winner take all, you get some delegates for winning the state, and then more delegates go to the winner of each congressional district. But Romney not only won the state, but every congressional district. So Romney gets all 37 delegates.
- North Dakota: North Dakota had the first round of its process in March. At that time the delegate estimate was Santorum 11, Paul 8 , Romney 7 , Gingrich 2. But the state Republican Convention happened last weekend, and Romney supporters owned the parliamentary process, taking the lion’s share of the delegates despite coming in third in March. That’s how it works in caucus states sometimes. It took a couple days for Green Papers to confirm a new estimate, but it now looks like Romney 20, Santorum 6, Paul 2. So the net today is Romney +13, Gingrich -2, Santorum -5, Paul -6.
- Wisconsin: Wisconsin also allocates some delegates based on both state and CD winners. Romney won the state. Romney won 5 CDs. Santorum won 3 CDs. So overall we have a delegate count of Romney 33, Santorum 9
Add those up and we have a net total for today of Romney +99, Santorum +4, Gingrich -2, Paul -6 Obviously Romney completely dominated the day.
In terms of “% of remaining delegates needed to win” we have this:
- Romney: 47.3% -> 42.5%
- Santorum: 71.8% -> 77.5%
- Gingrich: 80.5% -> 87.5%
- Paul: 86.8% -> 94.6%
The also-rans who left the race early on… Bachman, Huntsman and Perry… are mathematically eliminated after today. Paul, Gingrich and Santorum will inevitably join them soon.
The blocking Romney option? At this point the non-Romneys collectively would need to get 57.5% of the remaining delegates. So far they have managed 42.6% of the delegates. A change of this sort, while not mathematically impossible, would be unprecedented, especially since we are in the phase of the campaign where it is clear Romney is winning and the others are losing. People just stop voting for losers. As things go on, the % of delegates the non-Romneys get will probably actually decline. A major increase is just not going to happen.
It is over.
(We will of course continue to update these charts until Romney actually gets to 1144 however.)
|
|


