This is the website of Abulsme Noibatno Itramne (also known as Sam Minter).
Posts here are rare these days. For current stuff, follow me on Mastodon
|
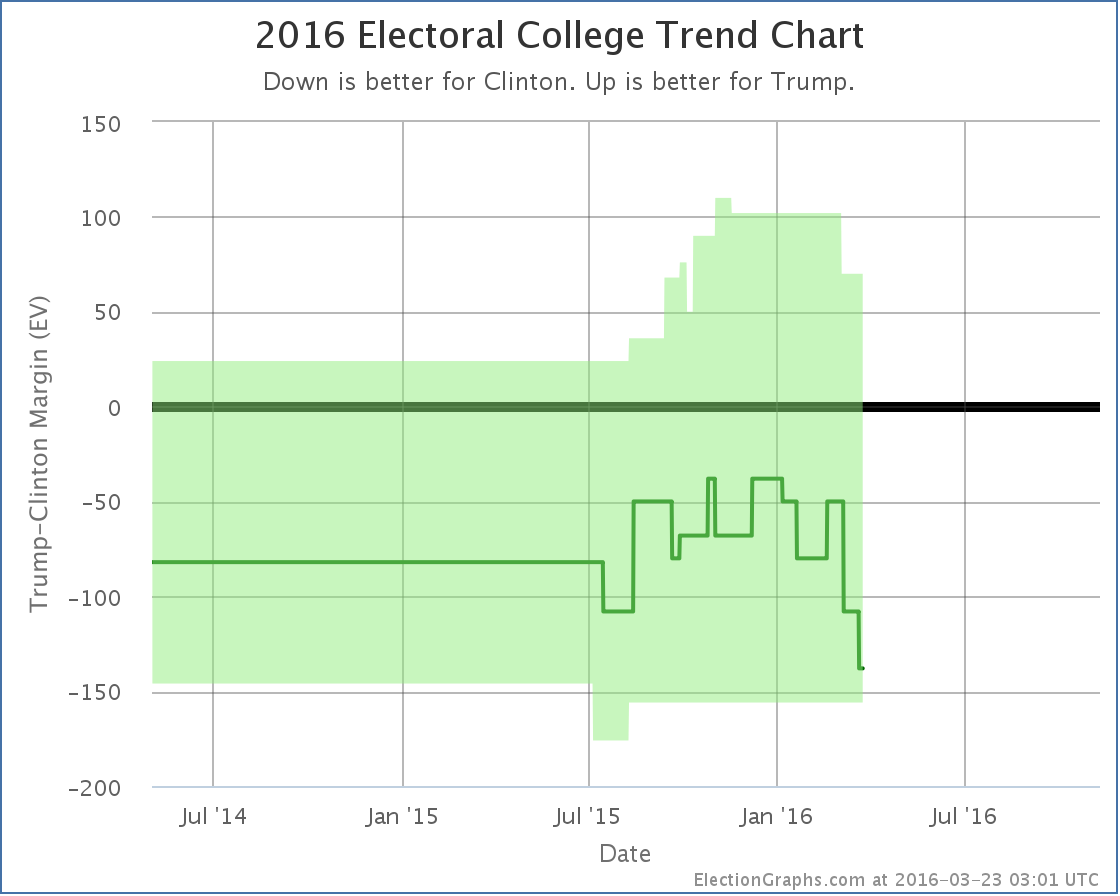
Now that the nominees are essentially certain, state level general election polling is ramping up quickly. It has only been a few days since the last update to my electoral college models, but there have already been polls in New Jersey, Virginia, North Carolina, California, Ohio, and Wisconsin. But of these, it was the new poll in North Carolina that made a difference.
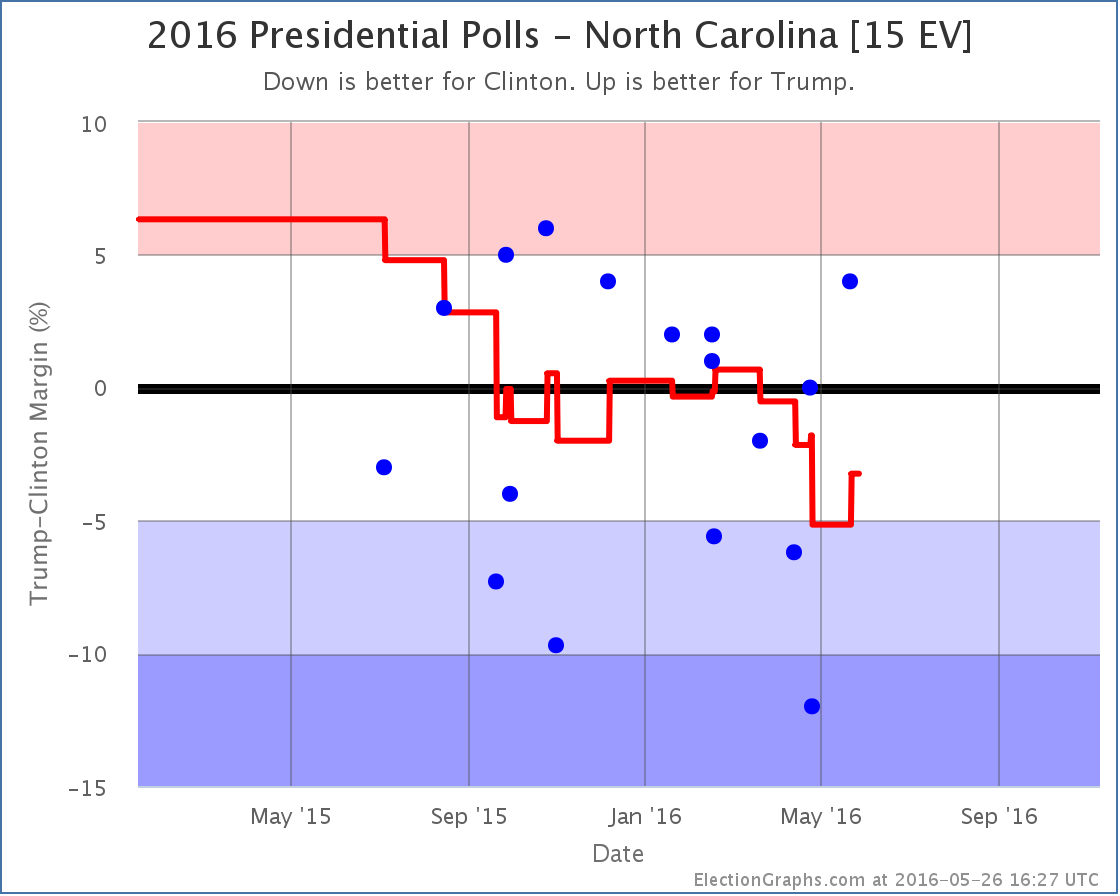
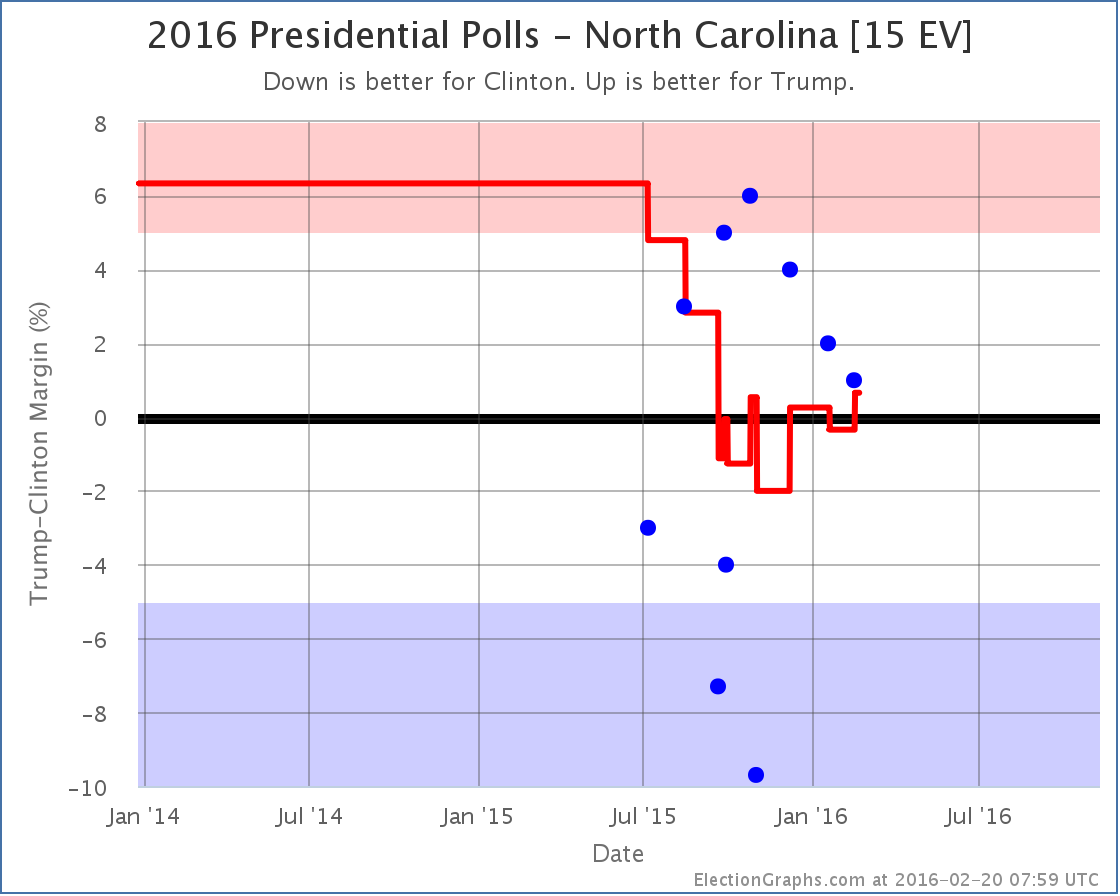
Trump gets his best individual poll result in North Carolina since last December, and the poll average moves from a Clinton lead of 5.2% to a Clinton lead of only 3.2%. With North Carolina once again within reach, Trump’s best case improves:
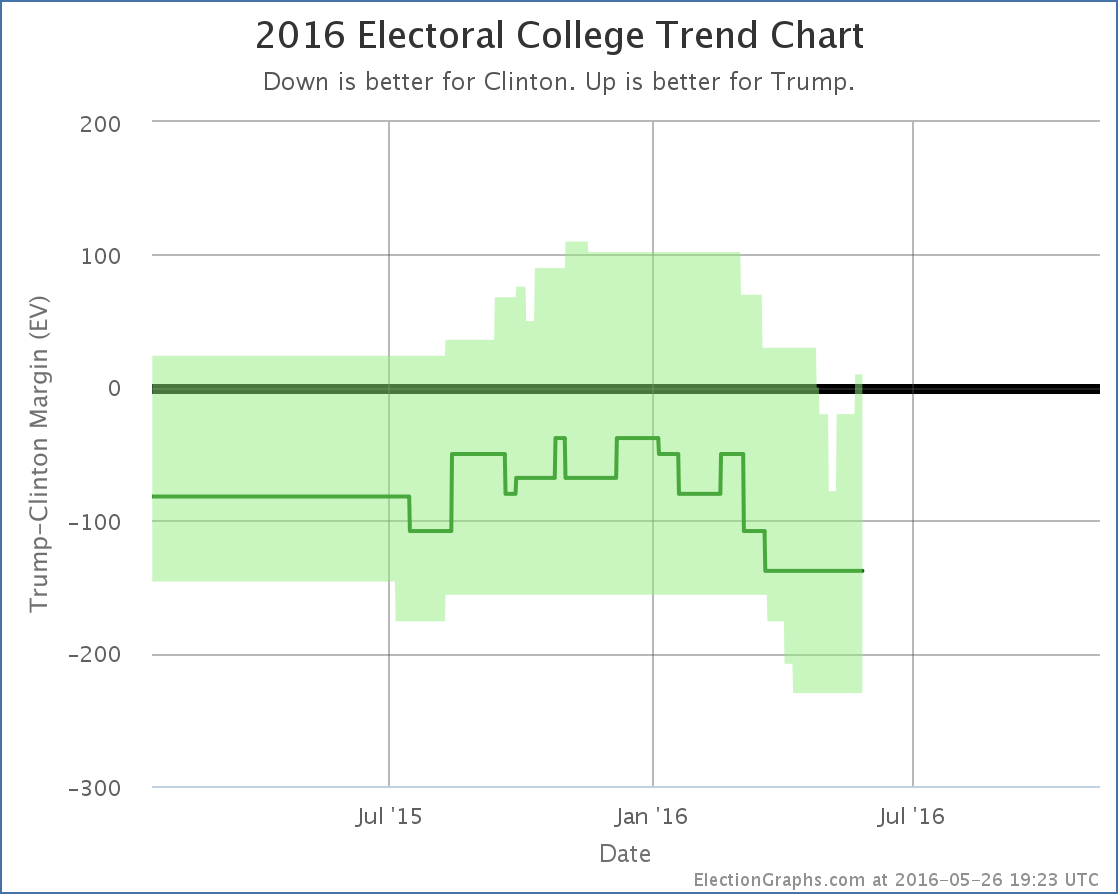
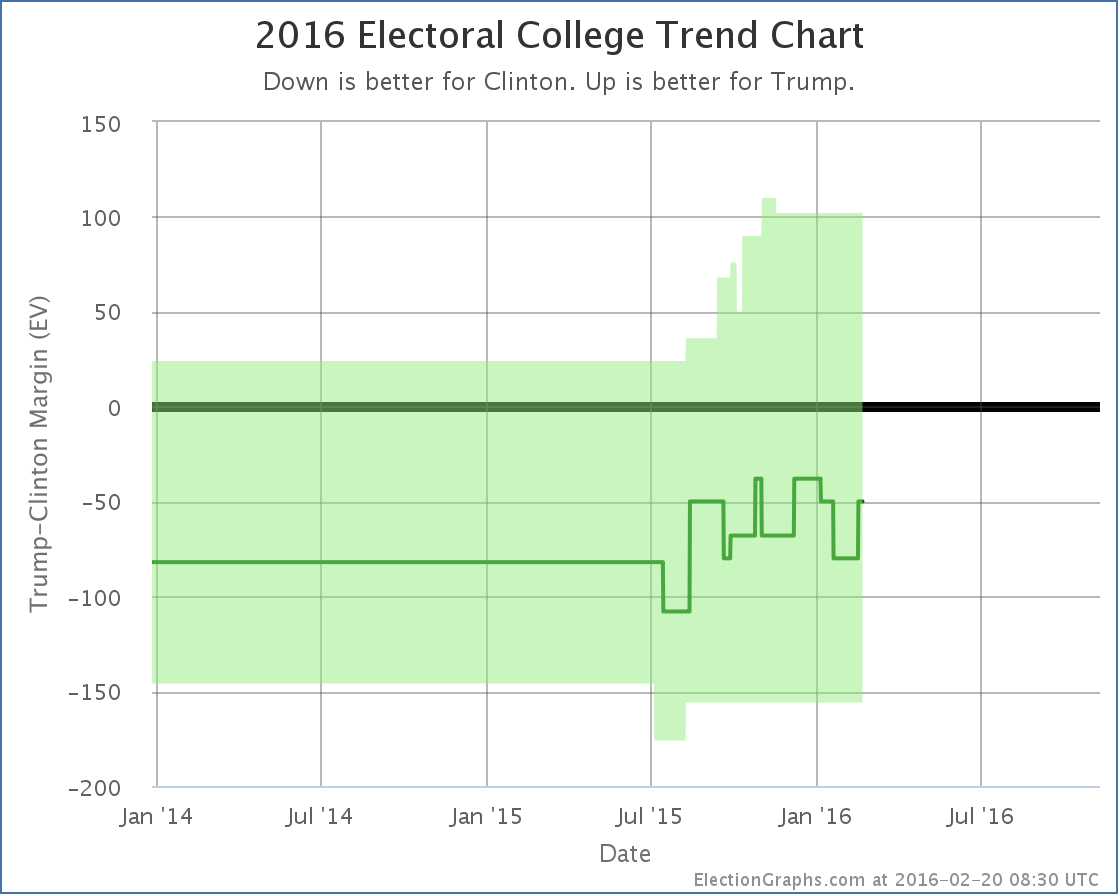
Now if Trump wins all the states he leads, plus all the states where Clinton’s lead is less than 5%, he squeaks out a 10 electoral vote win. Between this and Florida, this puts him back on the plus side for his “best case” after just under a month where even this rosy scenario was underwater for him.
Since North Carolina had been the tipping point, that metric also moves:
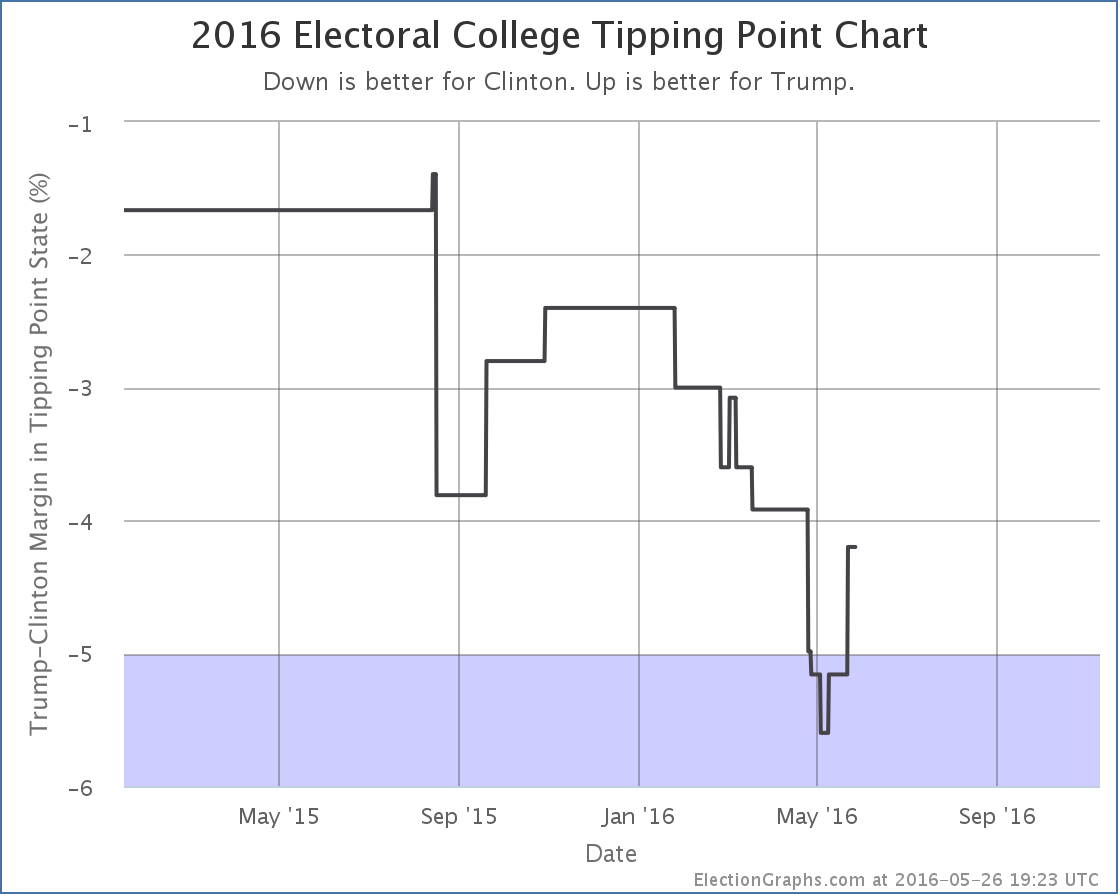
The tipping point state is now Florida, where Clinton leads by 4.2%.
From January to the beginning of May, there were 12 changes to the “bubble” and 8 changes to the tipping point. Only one of each category was in Trump’s direction. Overwhelmingly those months were a story of Trump’s position against Clinton deteriorating.
Since then we have two bubble changes and two tipping point changes, but all four have been moves in Trump’s direction. It is certainly looking like Trump hit bottom and is now bouncing back. The question is of course how far he bounces, and how long it lasts.
165.4 days until the polls start to close on election night.
Note: This post is an update based on the data on ElectionGraphs.com. Election Graphs tracks both a poll based estimate of the Electoral College and a numbers based look at the Delegate Races. All of the charts and graphs seen in this post are from that site. Additional graphs, charts and raw data can be found there. All charts above are clickable to go to the current version of the detail page the chart is from, which may contain more up to date information than the snapshots on this page, which were current as of the time of this post. Follow @ElectionGraphs on Twitter or like Election Graphs on Facebook to see announcements of updates or to join the conversation. For those interested in individual general election poll updates, follow @ElecCollPolls on Twitter for all the polls as they are added.
Edit 23:36 UTC to adjust sentence order in the first paragraph.
Since the last post here on the Electoral College back on April 19th there have been new polls in Maryland, Wisconsin, North Carolina (x3), Pennsylvania, New Hampshire, Indiana, and Arizona. Today the latest in Arizona and North Carolina make a difference to the ElectionGraphs.com estimates. There are two state category changes for Clinton vs Trump and one for Clinton vs Cruz. All three of these changes favor Clinton.
Clinton vs Trump
Maybe everything is going Trump’s way in the primary campaign right now, but things are heading in the opposite direction for the general election.
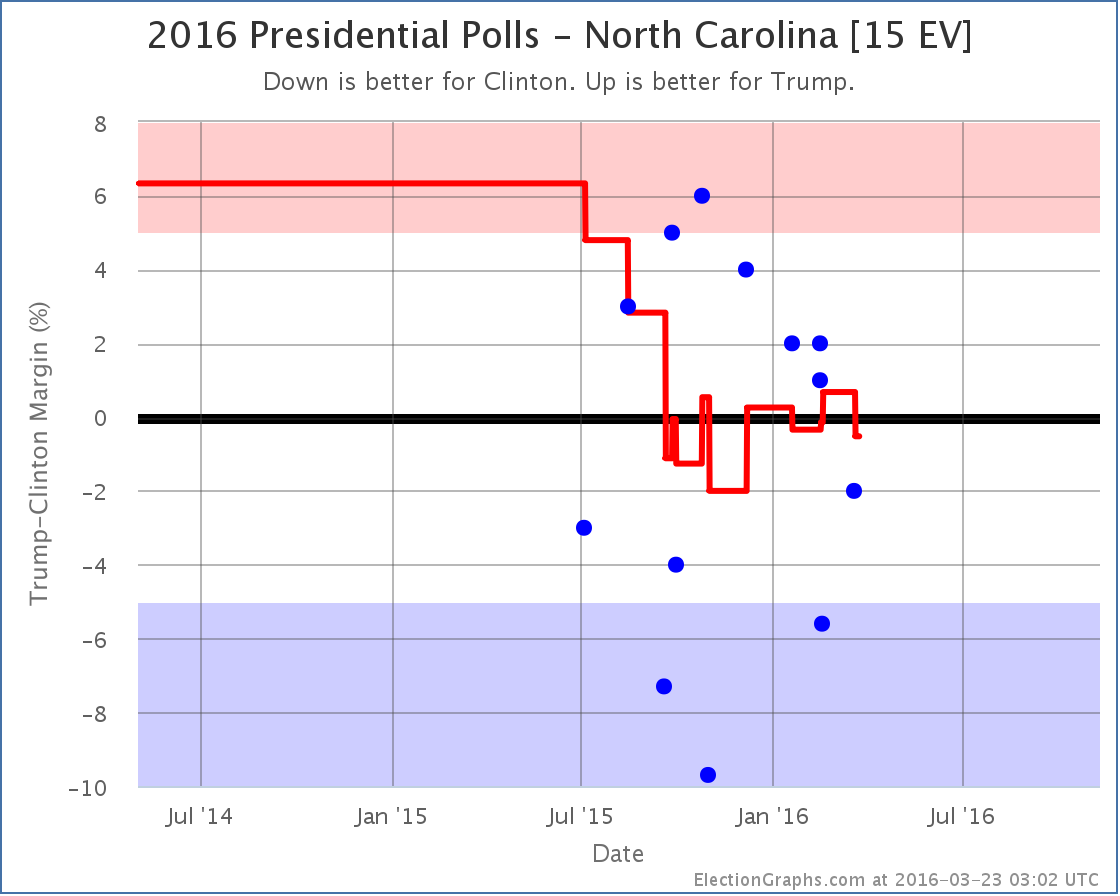
For quite a few months, the Clinton vs Trump poll average in North Carolina just bounced back and forth between Clinton and Trump. But as of now, the best Trump has done in the five most recent polls is a tie. The average has been trending downward since mid-March. The average is now a 5.2% Clinton lead. With that, North Carolina moves from “Weak Clinton” to “Strong Clinton”. This makes North Carolina blue enough that it isn’t considered a possible Trump pick up in the model any more.
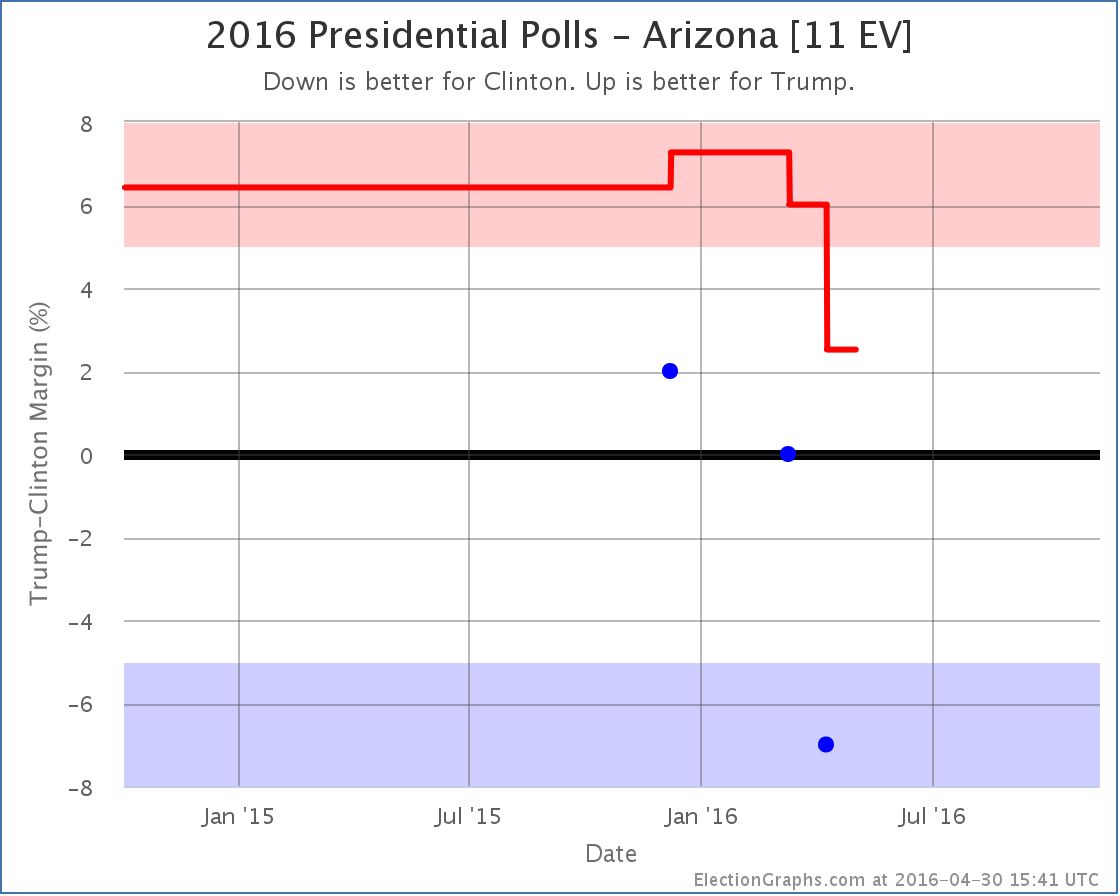
Arizona has been very lightly polled. There have only been three polls of Clinton vs Trump so far. So the average still includes the 2008 and 2012 election results. Each of the polls so far has been worse than the last for Trump though. The average now is only a 2.5% lead for Trump. With that, it is a “Weak Trump” state that is within reach for Clinton.
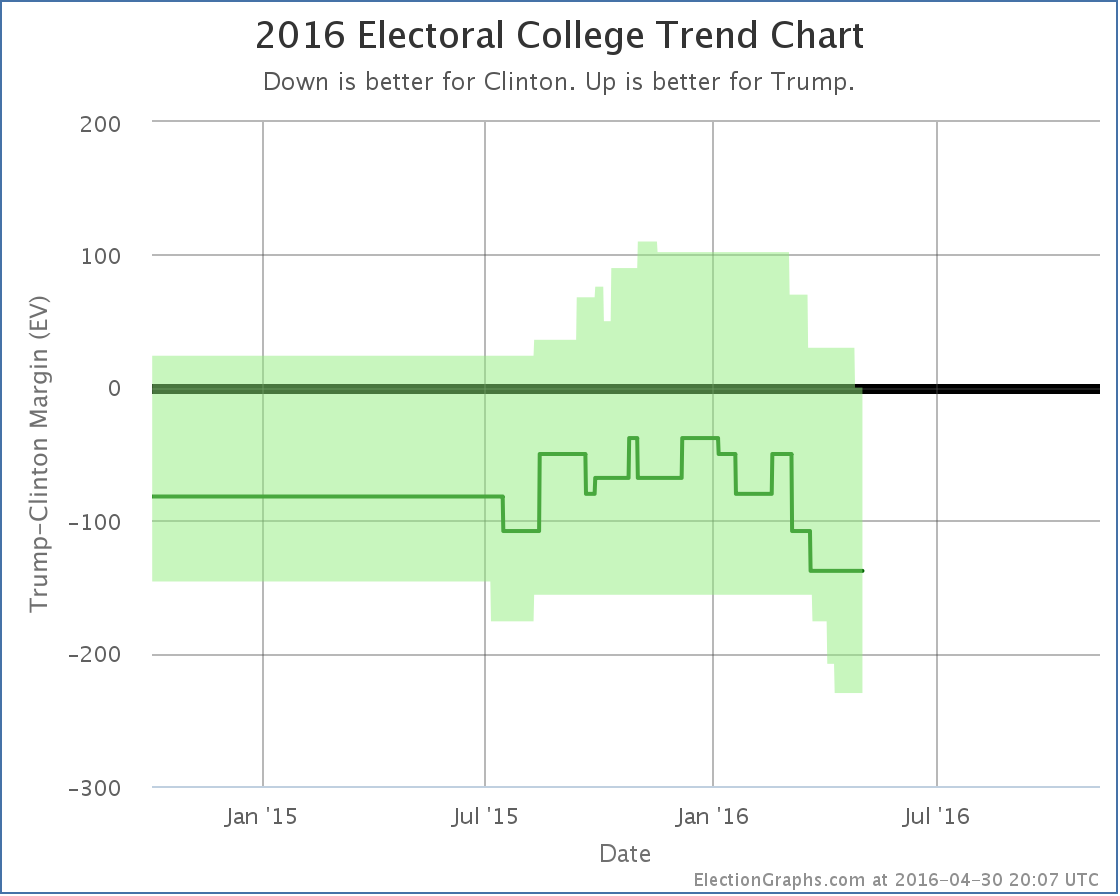
With these two changes, the overall trend in the expected range of possibilities looks like this:
With North Carolina’s movement, the tipping point moved in Clinton’s direction as well:
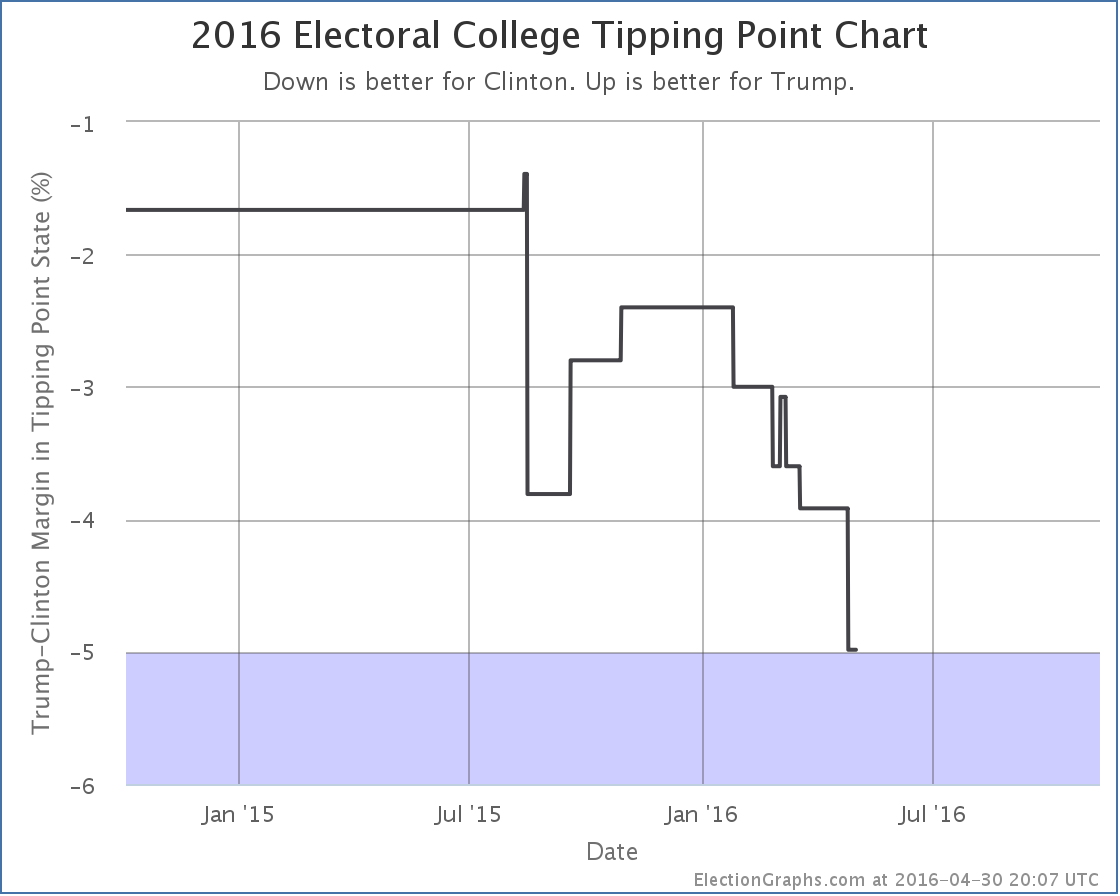
The downward trend that started around the New Year for Trump is continuing. The current summary now looks like this:
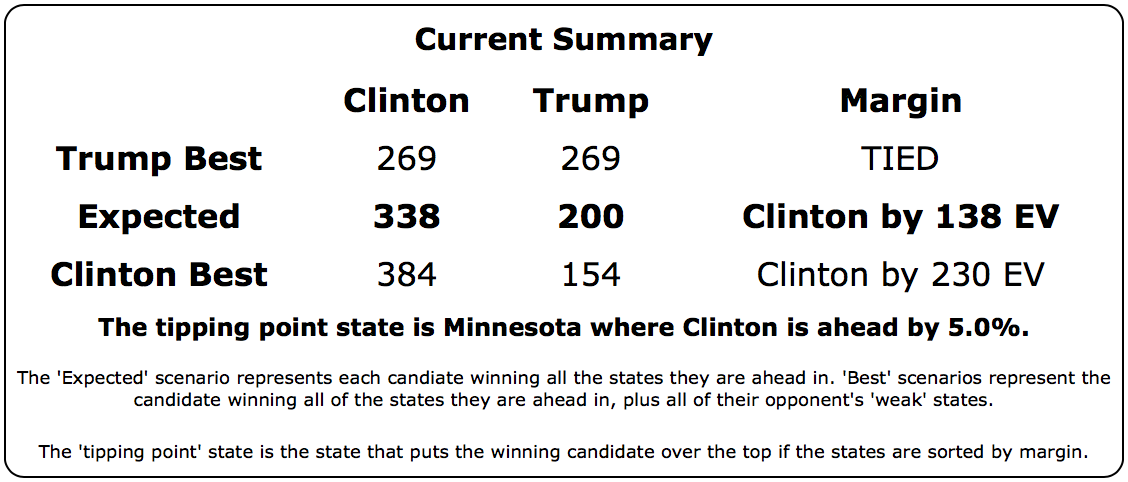
Yes, Clinton’s best case is better than it was with Arizona as a possible pickup.
But look at Trump’s current best case.
It is a 269 to 269 electoral college tie.
Can you even imagine a Clinton vs Trump race thrown into the House of Representatives? Wow.
Of course that won’t happen. But just like a contested convention, an electoral college tie is the kind of thing that gets political junkies excited. :-)
The bottom line on Clinton vs Trump is that after peaking around the New Year, Trump has been declining ever since. He is now at the point where if you give him not only all the states he is ahead in, but also the ones where Clinton is ahead by less than 5%, he only gets to a tie.
Things will undoubtedly change as both parties transition from primary mode to general election mode. The primary season has been very bad for Trump in terms of general election polling. The types of things he has been saying and doing that are winning him the Republican nomination are at the same time souring the general election voter against him.
The question is if he can turn that around once he is the official nominee. (Assuming nothing surprising happens to stop that of course.)
Clinton vs Cruz
Oh yeah, Cruz is still in this too.
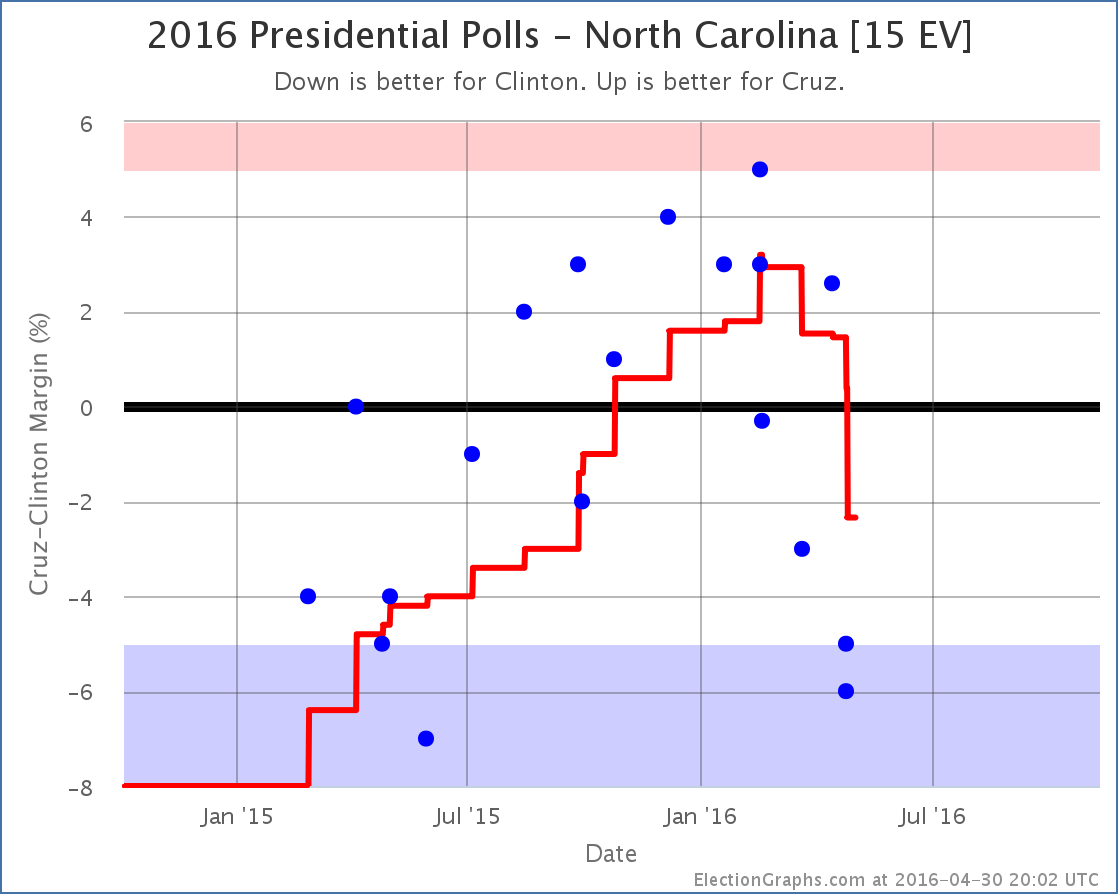
Cruz had been doing better and better in North Carolina. Until mid-March. Since then things have been moving against him. With this update, the lead in the state flips back to Clinton. This moves Cruz’s “expected case”:
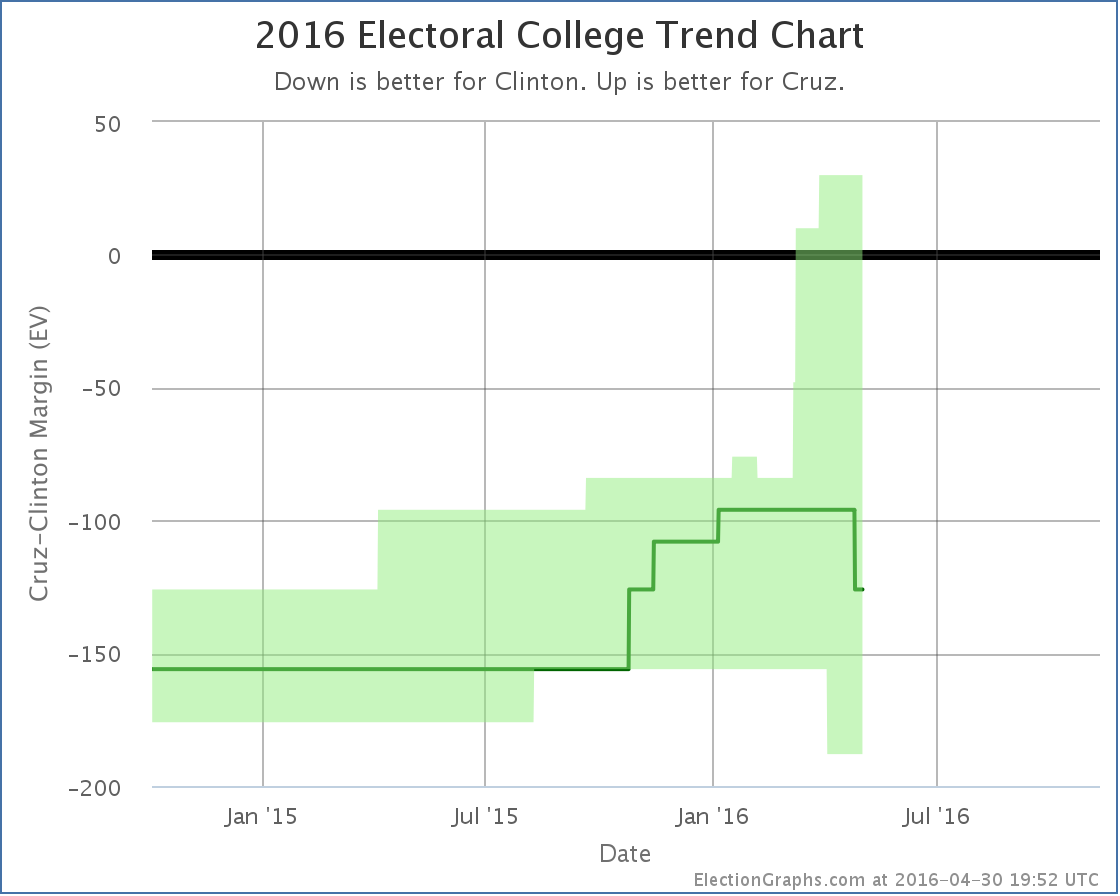
The new summary looks like this:
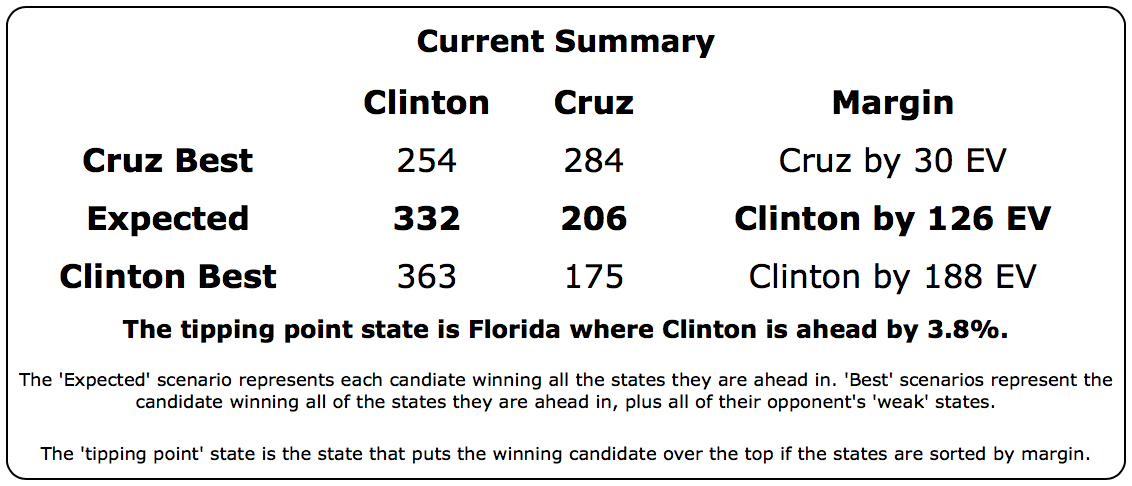
Notice that in all four of the key metrics, the expected case, the two best cases, and the tipping point, Cruz is doing better than Trump against Clinton.
Of course, Trump is on track to be the nominee and Cruz is not, absent some sort of coup at the convention via a rules change, a last minute Trump implosion, or something like that. Republican voters do not seem to be prioritizing “electability” this time around.
191.8 days until polls start closing on election day though. A lot will change between now and then. So we shall see…
Note: This post is an update based on the data on ElectionGraphs.com. Election Graphs tracks both a poll based estimate of the Electoral College and a numbers based look at the Delegate Races. All of the charts and graphs seen in this post are from that site. Additional graphs, charts and raw data can be found there. All charts above are clickable to go to the current version of the detail page the chart is from, which may contain more up to date information than the snapshots on this page, which were current as of the time of this post. Follow @ElectionGraphs on Twitter or like Election Graphs on Facebook to see announcements of updates or to join the conversation. For those interested in individual general election poll updates, follow @ElecCollPolls on Twitter for all the polls as they are added.
[Update 04:10 UTC to add the “Maybe everything is going Trump’s way…” sentence.]
[Update 04:52 UTC to add in some inexplicably missing words where a sentence stopped before it was complete.]
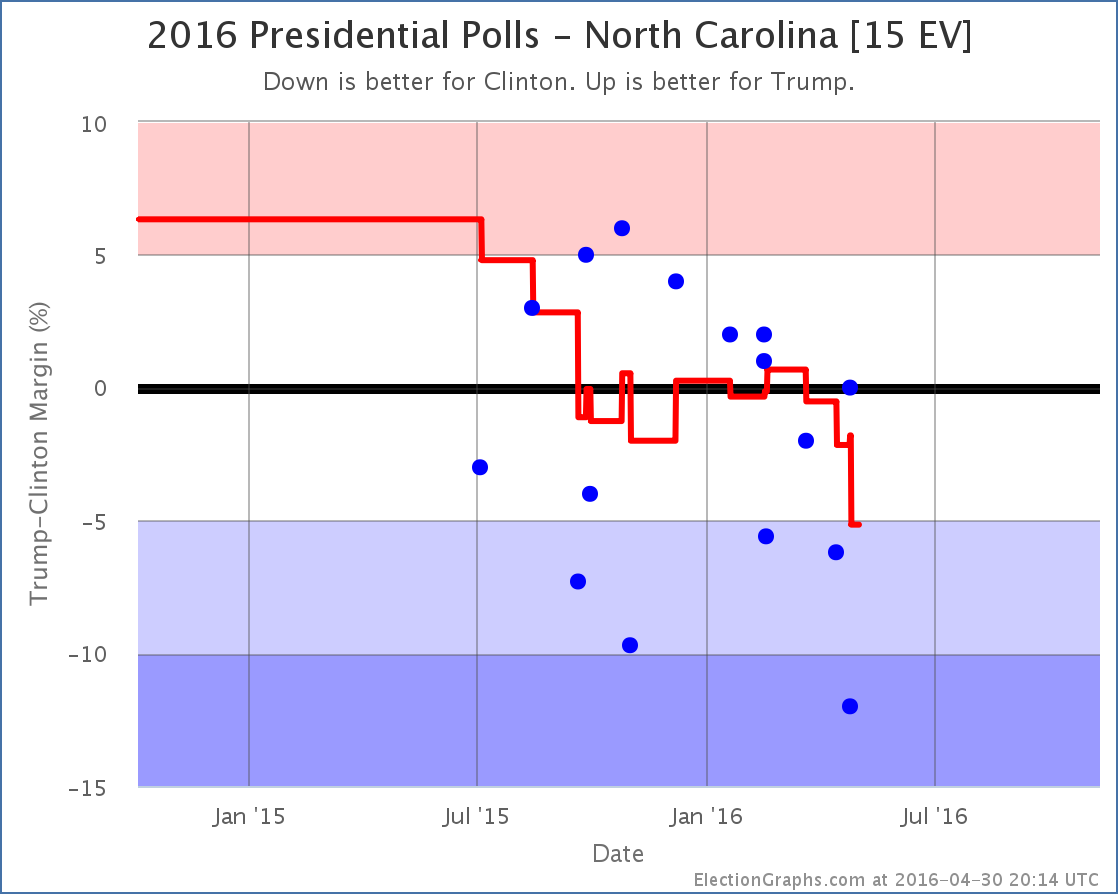
Since the last electoral college update there have been new polls in New York, Arizona, Utah and North Carolina. But the only notable change is in North Carolina:
With the latest polls, North Carolina moves from just barely Trump, to just barely Clinton. Either way, it is very close… and it has been bouncing back and forth since last fall. North Carolina is not necessarily showing any sort of trend here. Bottom line it is just a close state in this race.
But for the moment, this puts North Carolina back in Clinton’s column if everybody just wins all the states they are ahead in. So looking at the national picture:
The Clinton vs Trump “Expected Case” has been moving toward Clinton since January. With this update, Trump’s expected case is worse than it has been since Clinton vs Trump polling began.
Now, all the states in the “bubble” are by definition close. They could flip back. But this is starting to look like it might be a real trend and not just noise.
Right now, the expected case sits at Clinton 338, Trump 200… a 138 electoral vote margin for Clinton. For comparison, the Obama-Romney margin was 126 electoral votes.
There are eight states that are “close” right now. But seven of these eight are now leaning Clinton. And the one remaining state (Colorado) has only ONE actual Clinton vs Trump poll (from back in November), the average is still based mostly on how the state has gone in previous election years. It is certainly starting to look like most of the “traditional” battleground states are turning blue in this matchup. Again though, these states are close, and they might easily bounce back to Trump.
The range of reasonable possibilities is large here. Allowing all eight states to swing to one side or the other you get a range from Clinton winning by 156 to Trump winning by 70. Anything is still possible here.
But if Clinton vs Trump continues to look like the most likely combination, then we will probably also start getting more polling in the “Strong Trump” group of states. These have been very lightly polled and are still significantly based on previous election results, and the polls we do have tend to be older at this point. Given the trends in other states, perhaps some of these aren’t actually as “Strong Trump” as they initially seem. Or maybe they are. We shall see.
230.8 days until polls start to close. Things will be moving back and forth the whole time. Stay tuned.
Note: This post is an update based on the data on ElectionGraphs.com. Election Graphs tracks both a poll based estimate of the Electoral College and a numbers based look at the Delegate Races. All of the charts and graphs seen in this post are from that site. Additional graphs, charts and raw data can be found there. All charts above are clickable to go to the current version of the detail page the chart is from, which may contain more up to date information than the snapshots on this page, which were current as of the time of this post. Follow @ElectionGraphs on Twitter or like Election Graphs on Facebook to see announcements of updates or to join the conversation. For those interested in individual general election poll updates, follow @ElecCollPolls on Twitter for all the polls as they are added.
[Update 2016-03-23 18:18 to Fix Article title to Electoral College]
General Election state polls have been few and far between since we are in the heart of the primary battles, but we did get a new PPP North Carolina poll and when it gets factored into my poll averages, it resulted in a couple of category changes worth noting:
Clinton vs Trump
As you can see, North Carolina has been bouncing between “Weak Clinton” and “Weak Trump” ever since there was substantial polling here for Clinton vs Trump in the fall. With this latest update to the average, North Carolina flips back into Trump’s column.
The reality here is that regardless, North Carolina looks close, and could easily go either way, but it moves the center “expected” line in our chart showing the range of plausible electoral results:
Trump’s “Expected” case, where he wins every state where he leads the poll average, and loses those where he doesn’t, is to lose to Clinton by 50 electoral votes. Trump remains well within reach though. If he were to take the lead in only Iowa, Ohio, and Michigan he would take an electoral college lead. If he were to take all the close states, he would end up winning by 102 electoral votes.
Clinton vs Rubio
Rubio has been doing substantially better in North Carolina than Trump. Rather than bouncing around near the zero line, this has been hovering near the 5% line that I use to separate “Weak Rubio” from “Strong Rubio”. This update pushes the average to a lead just barely over 5%, so I remove North Carolina from the list of possible Clinton pick up states. This does not change the “expected” results, but diminishes Clinton’s “best case” scenario where she wins not only the states she currently leads, but also those where she is behind by less than 5%.
So Clinton’s best case goes from winning by 156 electoral votes, to only winning by 126 electoral votes. The “expected” result remains a 48 electoral vote win by Clinton given the states where she leads in the poll averages.
Once we get clear winners in the primary races, I expect we will stop seeing polling for any candidate combination other than those winners, and general election polling should speed up again. In the mean time, most of the action is going on in the delegate races. Before long though, attention will move back to the general election, and there will be plenty to watch on this side of things too.
262.3 days until the first general election polls start to close.
Note: This post is an update based on the data on ElectionGraphs.com. Election Graphs tracks both a poll based estimate of the Electoral College and a numbers based look at the Delegate Races. All of the charts and graphs seen in this post are from that site. Additional graphs, charts and raw data can be found there. All charts above are clickable to go to the current version of the detail page the chart is from, which may contain more up to date information than the snapshots on this page, which were current as of the time of this post. Follow @ElectionGraphs on Twitter or like Election Graphs on Facebook to see announcements of updates or to join the conversation. For those interested in individual general election poll updates, follow @ElecCollPolls on Twitter for all the polls as they are added.
My primary race delegate tracking for both parties will be out very soon… promise. In the mean time, rather than just looking at the delegate leaders on each side against each other, we continue to concentrate on the five best polled candidate combinations.
With a batch of new polls added in North Carolina, Florida, and New Hampshire, it starts to look like the long trend of Clinton getting weaker and weaker against a wide variety of Republican rivals may have ended. Maybe. For now. A little bit. Things will change before we are done. Polls like these aren’t predictive of the general election until after the conventions. Caveat caveat caveat.
Lets look at each category change by state:
Florida (29 EV)
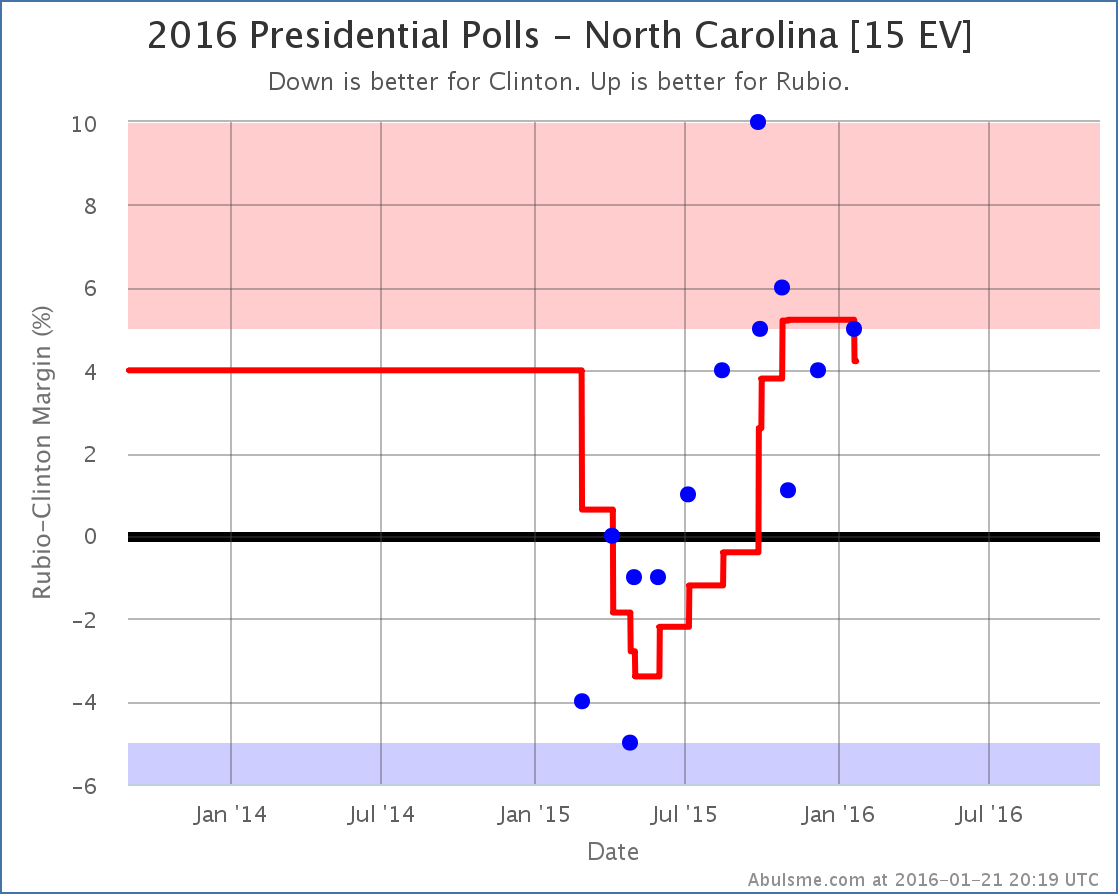
Of the best five polled candidate combinations, two Republicans have their positions deteriorate against Clinton in this update, Bush and Rubio:
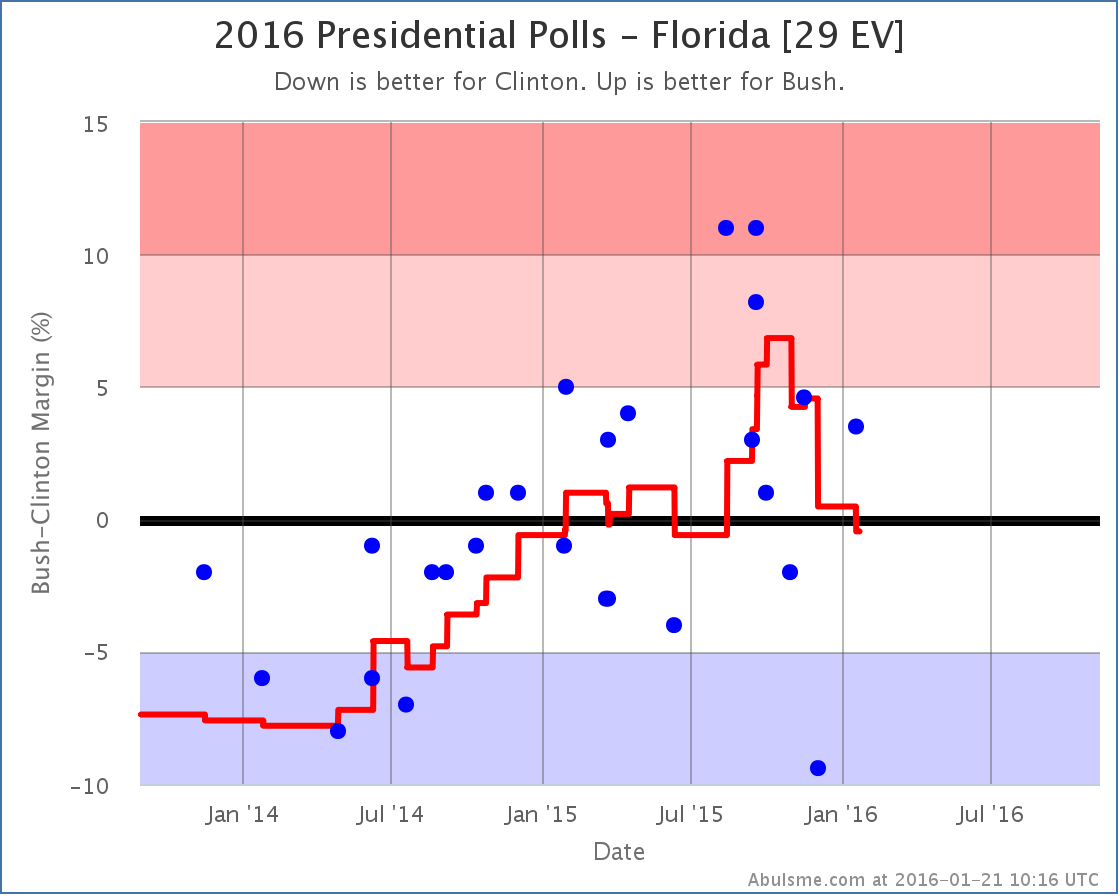
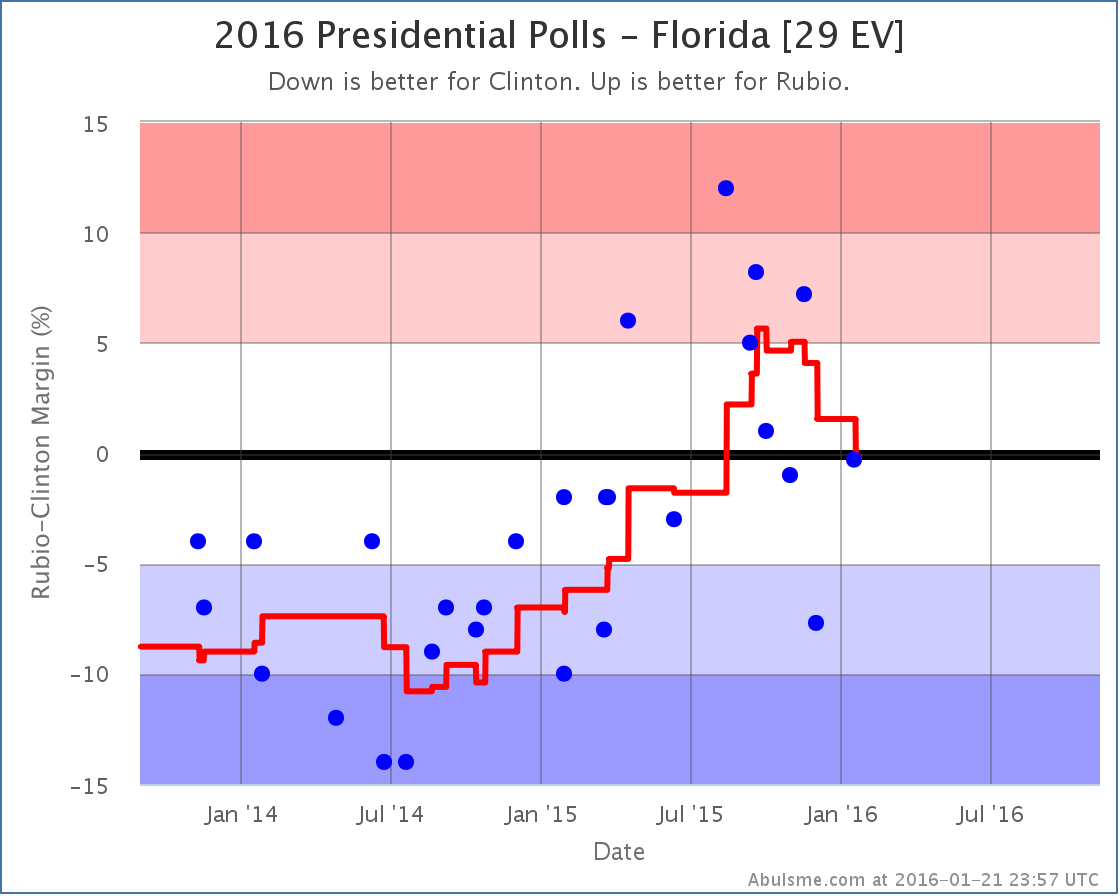
Both candidates seemed to peak in late September or early October, and since then have been weakening. With the latest set of poll updates, both states move from being weakly on the Republican side of the line, to being Weak Clinton. The “weak” here should be emphasized. Clinton’s lead over Bush in the average is only 0.5%, and over Rubio it is only 0.2%. This is about as close as you can get. Since for the analysis here any lead under 5% is considered as one that could easily disappear overnight, at these even smaller margins, this is essentially a tie. But for the last few months, the movement has been in Clinton’s direction.
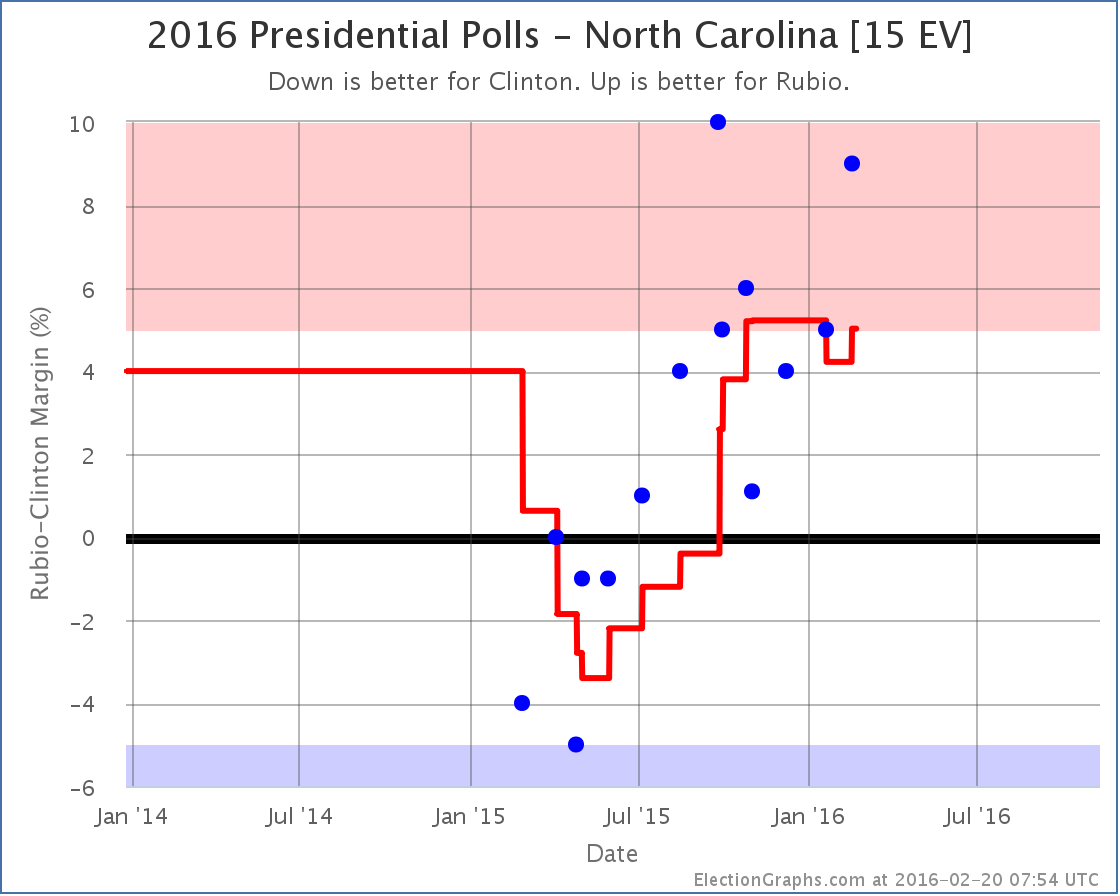
North Carolina (15 EV)
In North Carolina, once again Bush and Rubio lose ground to Clinton. Although technically with the current update Clinton vs Trump dropped to the 6th best polled candidate combination, I know the Trumpets will want to hear about how he is doing, so I’ll mention that Trump also weakens in North Carolina. Yes, yes, I know that any such indications are just propaganda from the vast establishment conspiracy of which I am a part. But anyway… looking at the charts:
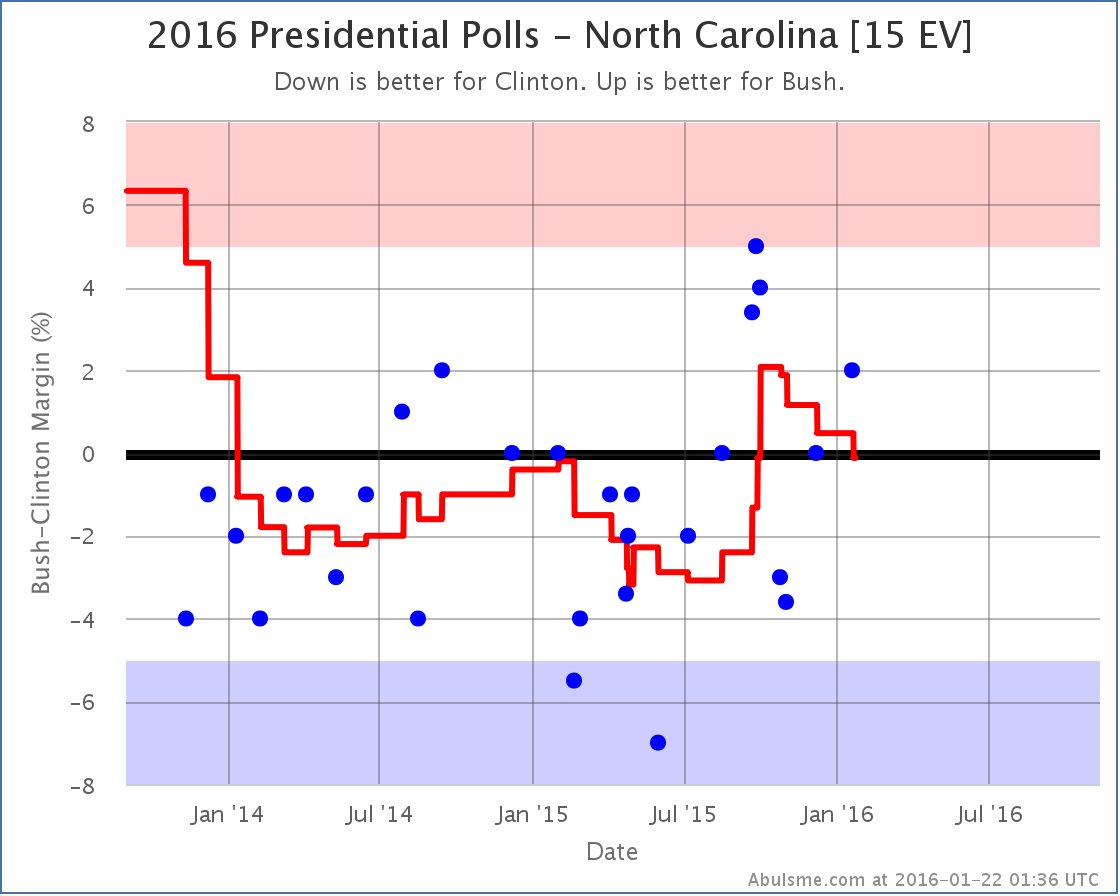
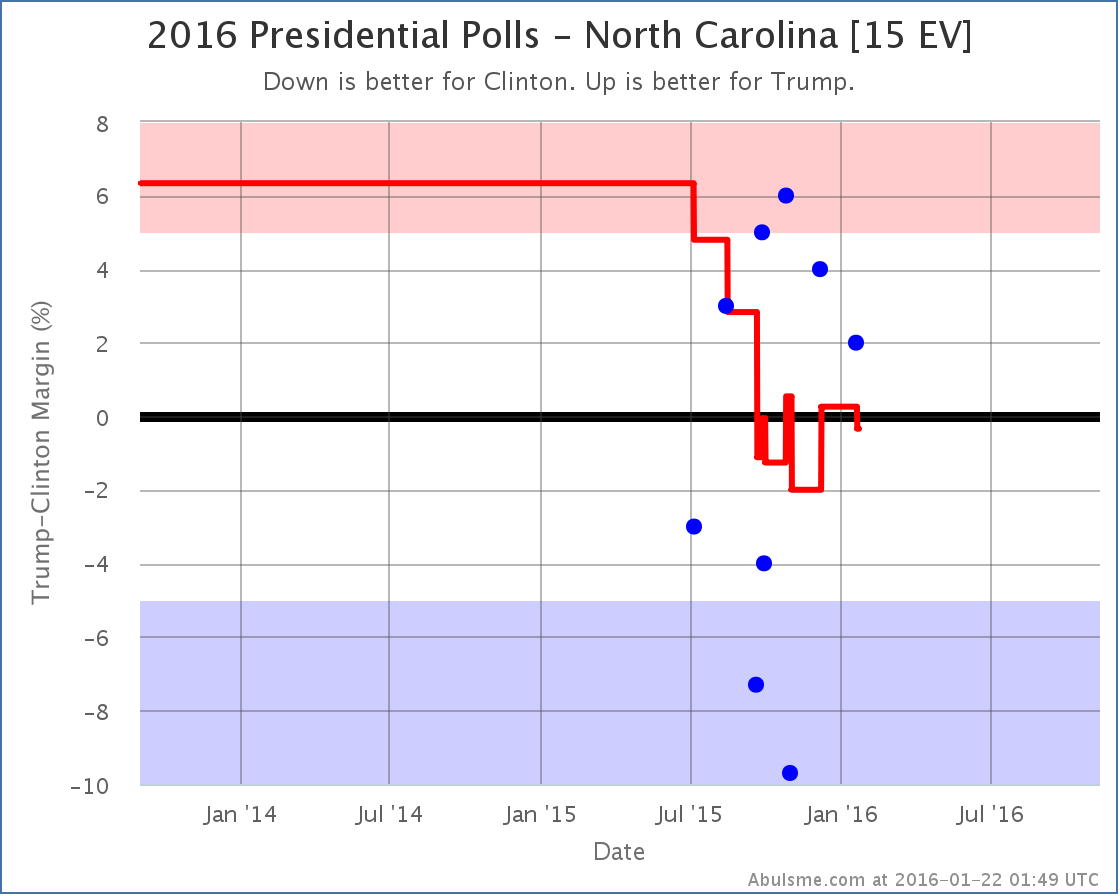
In this case the averages for Bush and Trump against Clinton move from Weak Republican to Weak Clinton, but once again the “weak” is the key here. Clinton leads Bush by 0.1% and Trump by 0.3%. So again, super close. A move from just barely on one side of the line to just barely on the other side of the line isn’t really too meaningful except if it seems part of a larger movement. In the case of Bush, the average seems to have been moving toward Clinton for several months. In the case of Trump, it is more bouncing around in a range over the past few months.
Rubio does a bit better here. North Carolina had actually been in the “Strong Rubio” category for a few months, with the poll average showing a Rubio lead of over 5%. With the latest update, Rubio’s lead slips under 5% to 4.2%, which means I once again consider North Carolina a state that could go either way in this matchup, but Rubio still has a lead.
New Hampshire [4 EV]
New Hampshire is the one state that has good news for the Republicans in this update. No category changes for Bush, Rubio, or Trump… but this time Cruz jumps into a new category.
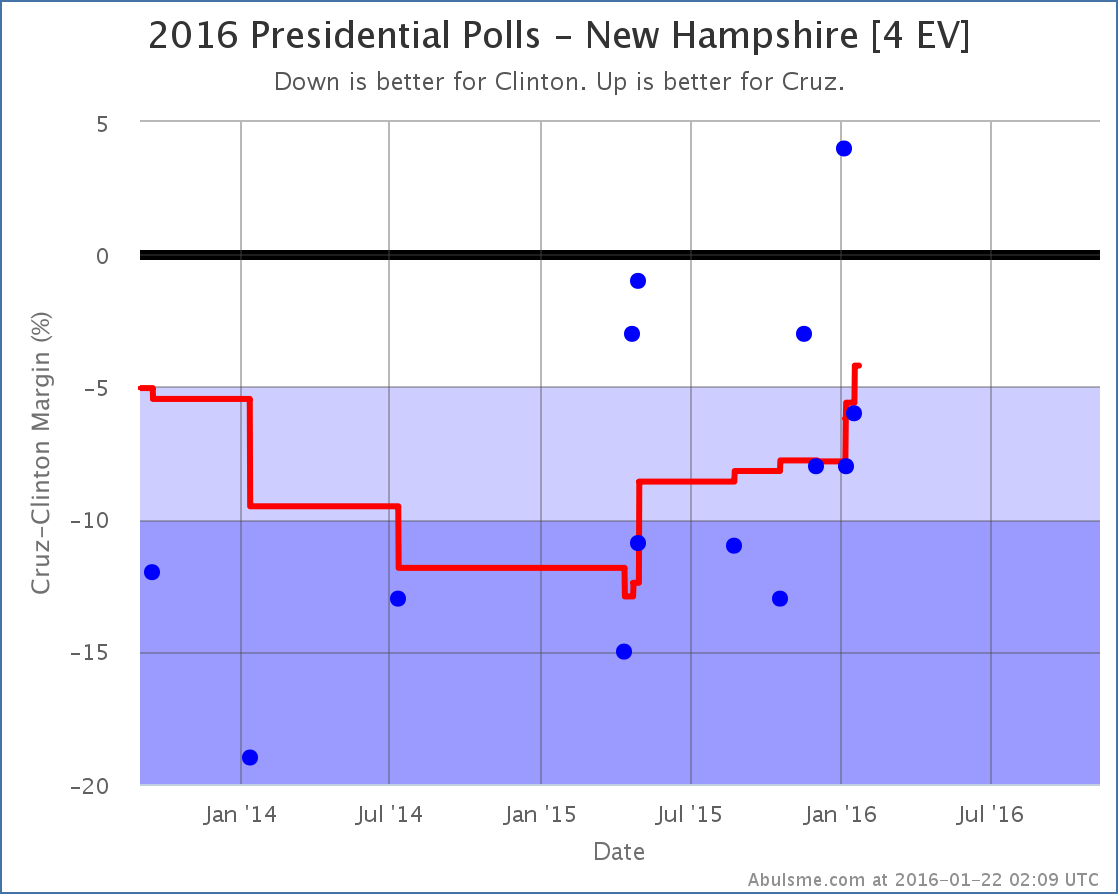
Cruz’s recent movement in New Hampshire is the opposite of the trends we were looking at for the other candidates in the other states. Cruz is gaining on Clinton in New Hampshire. For the first time, the state starts to look competitive in this match up. Clinton is still up 4.2% in the average, but now it is conceivably within reach for Cruz.
National Ranges
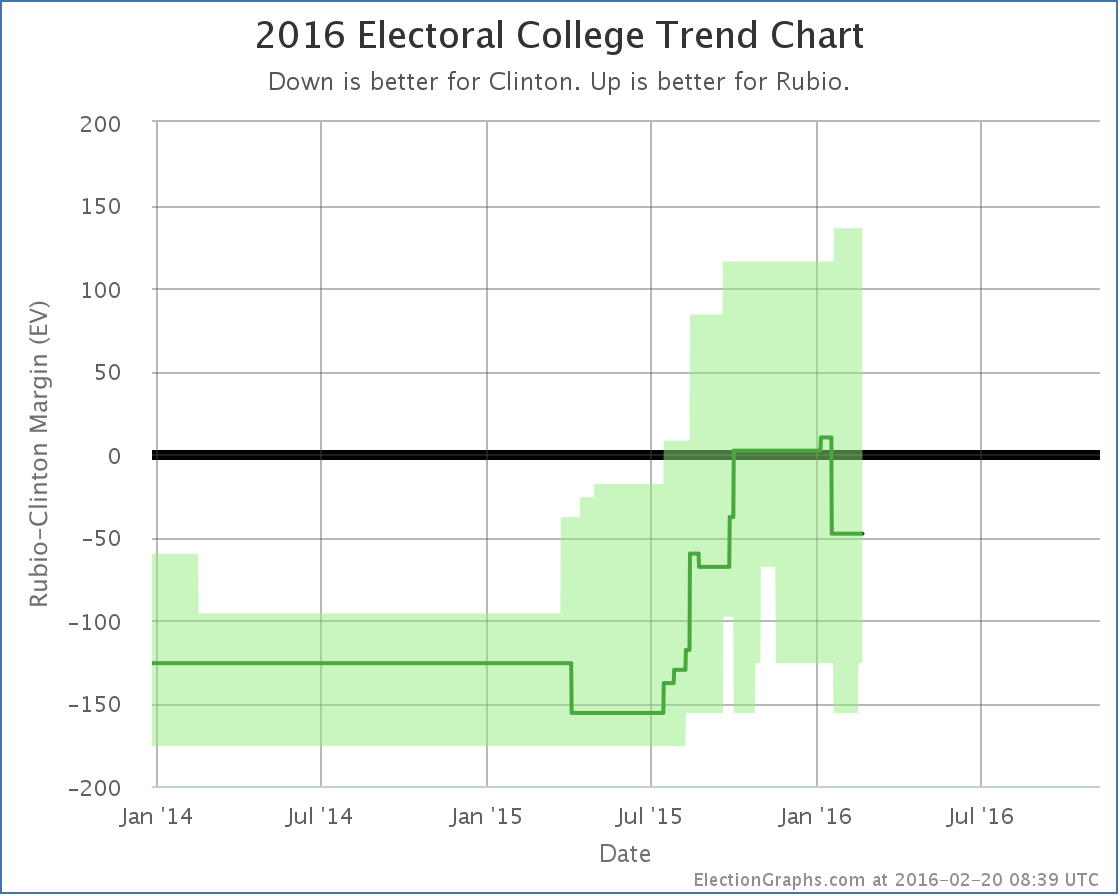
So with all these various changes, what do things look like nationally for all these candidate pairs? Here we go:
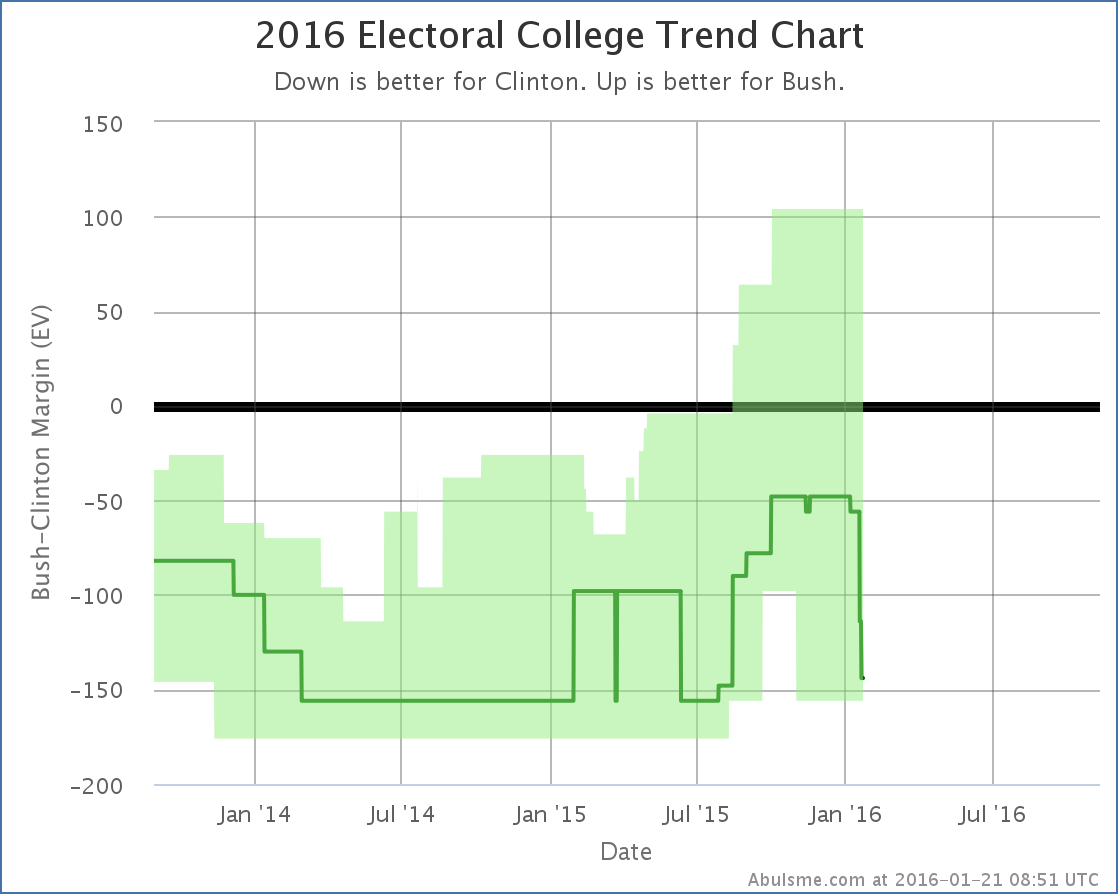
With Florida and North Carolina back out of his column, the result if everybody just wins the states they are ahead in now sits at Bush losing by 144 electoral votes. If he manages to flip the states where Clinton is ahead by less than 5% he could still win by up to 104 electoral votes though, so while Bush is behind, this is still a race.
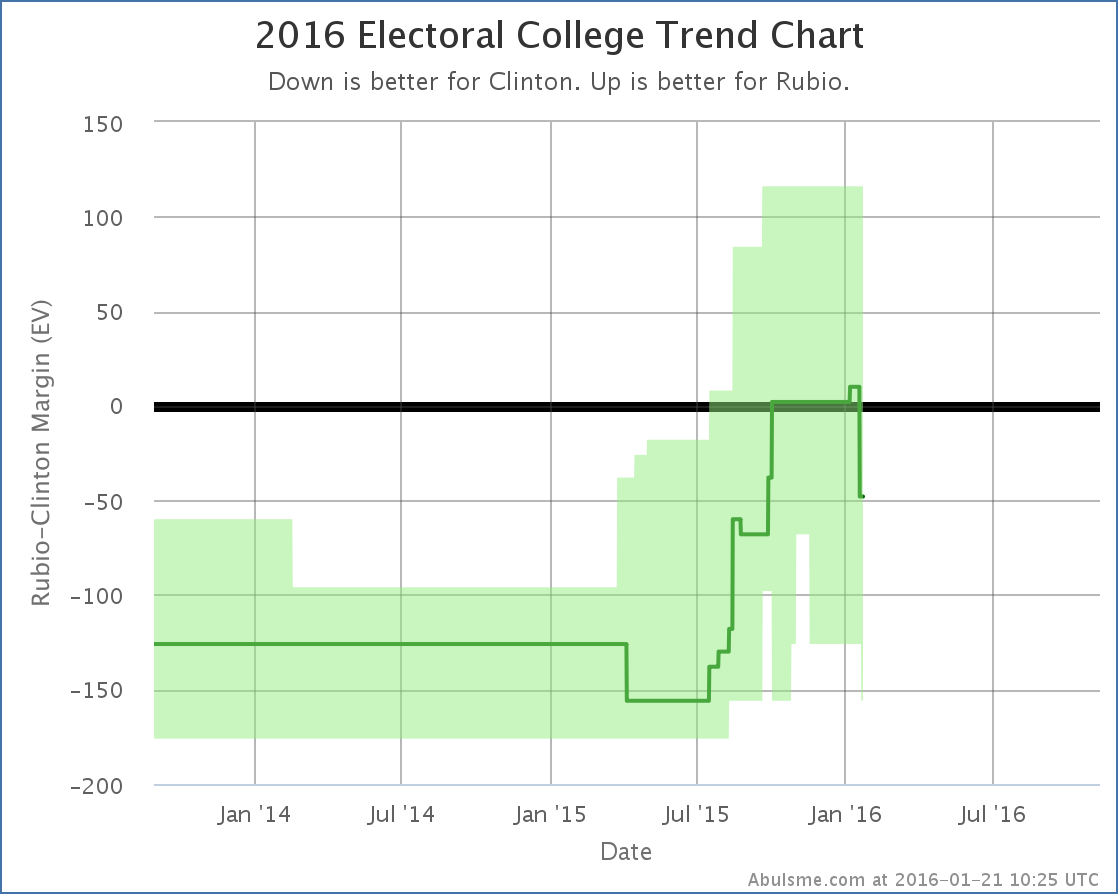
Before this update, Clinton vs Rubio was actually expected to be a narrow 10 electoral vote Rubio win. But if you take Florida away, that changes into a 48 electoral vote loss. With North Carolina also now considered a possibility for Clinton, Clinton’s “best case” improves to a 156 electoral vote win. Rubio’s best case is still a 116 electoral vote win though, so this matchup is also a real race that could go either way.
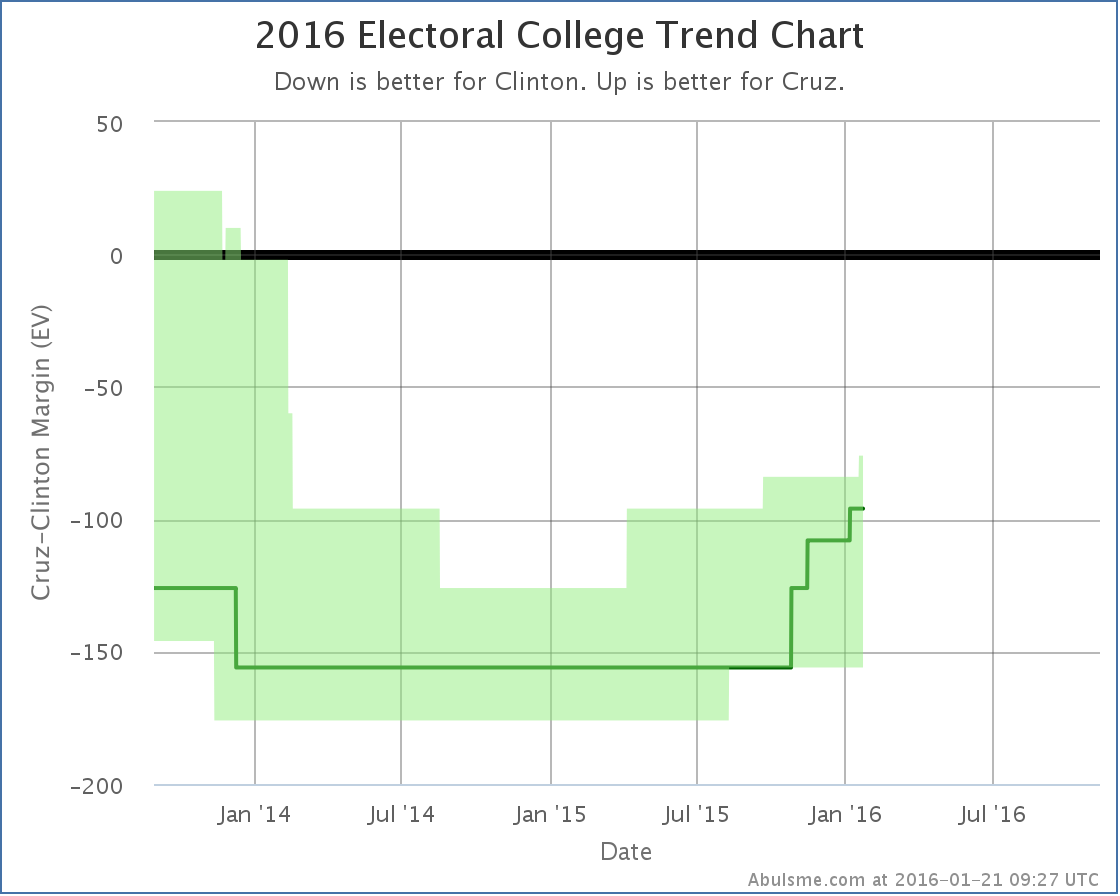
On the other hand… making New Hampshire possible brings Cruz’s best case… where he wins every state he is ahead in, plus all the states where Clinton’s lead is less than 5%… to Cruz losing by 76 electoral votes. This is better than it was. Cruz has been improving since last spring. But he is still not yet in a place that would make a Clinton vs Cruz race even competitive. Right now that matchup looks like an easy Clinton win.
Now, the Real Clear Politics average for Clinton vs Cruz actually shows Cruz ahead of Clinton right now. (Rubio too.) How does this mesh? First thing to note is that the state level polling that the estimates on this site are based on are still not happening quickly enough to show national movement that happens on timeframes less than a few months. So it is quite possible there has been a recent move just isn’t reflected in the state numbers yet. If so, if Cruz ends up the nominee, there will be a lot more polling, and we’ll see the state level analysis move toward the national numbers as more data becomes available. It is of course also possible that Cruz’s support is distributed between states in such a way that gives him a popular vote advantage while still leaving him behind in the electoral college. To be frank though, that is less likely.
Given that, it is reasonable to think that perhaps the gains Cruz showed in the New Hampshire update today are quite likely happening in other states as well, there just isn’t the polling available yet to show it on a state by state basis. So Cruz may be stronger than he appears on this chart.
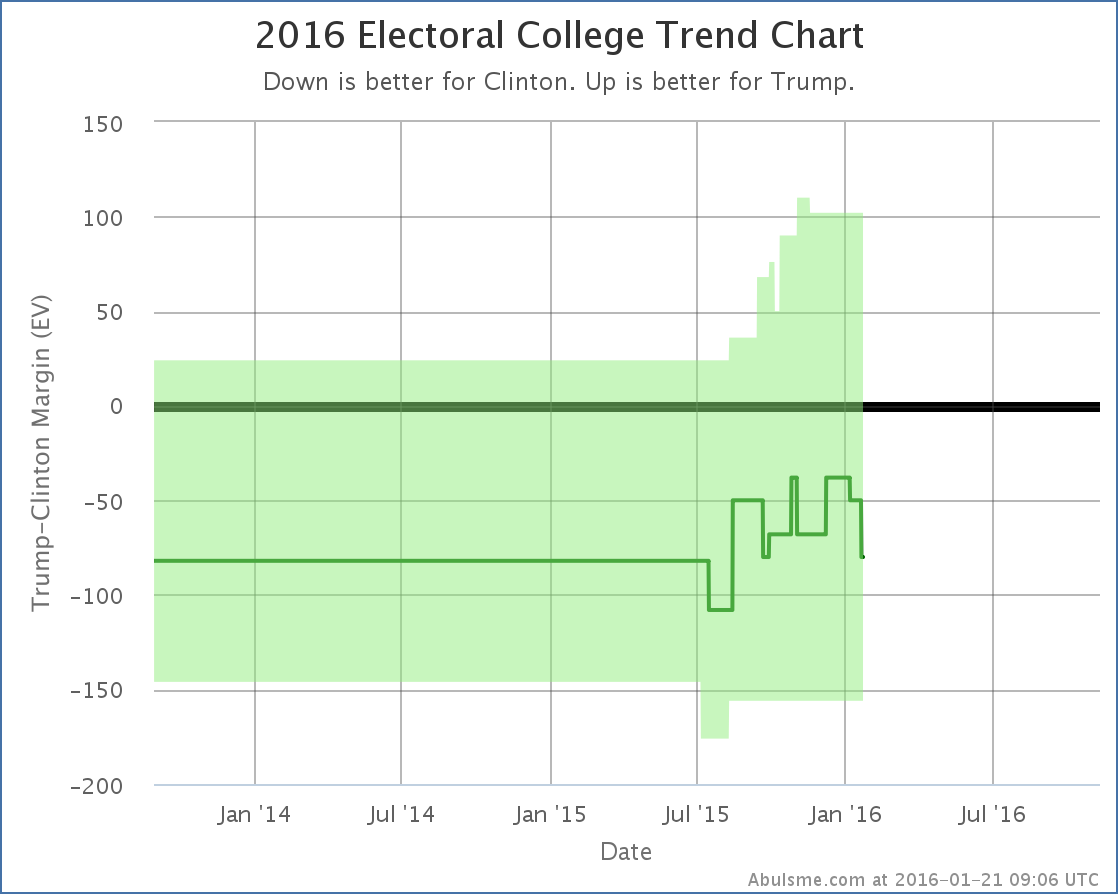
There really wasn’t polling on Trump before this summer, so most if not all of the movement seen here is not real movement, but just the process of getting enough polls to have a reasonable picture of how Trump is doing. The “expected” case doesn’t show a real trend, it has just bounced around a bit. Trump’s best case kept improving as more polls became available. At the moment, the state poll averages show a Clinton vs Trump race could reasonably be anywhere from a 156 electoral vote Clinton win to a 102 electoral vote Trump win, with the “expected case” being an 80 electoral vote win by Clinton. But this matchup DOES look like a real race, not a Clinton rout. Trump does better against Clinton than either Cruz or Bush. Of these four, only Rubio does better.
Or course, I should repeat all the usual caveats again. See the top of this post. There is still lots of time. Everything can and will change over the next few months.
291.9 days until the polls start to close. 11 days until the Iowa caucuses.
This whole thing is going to start moving very quickly very soon.
PS for Sanders fans: Although no match up vs Sanders has been polled enough to talk about in detail here, with today’s updates Sanders strengthened vs Rubio in North Carolina, while weakening against both Rubio and Cruz in Florida.
Note: This post is an update based on the data on ElectionGraphs.com. All of the charts and graphs seen here are from that site. Graphs, charts and raw data can be found there for the race nationally and in each state for every candidate combination that has been polled at the state level. In addition, comparisons of the best polled candidate combinations both nationally and each in each state are available. All charts above are clickable to go to the current version of the detail page the chart is from, which may contain more up to date information than the snapshots on this page, which were current as of the time of this post. Follow @ElecCollPolls on Twitter for specific poll details as I add them. And like Election Graphs on Facebook!
It may well be that Clinton bottomed out and is now strengthening daily in the Democratic primary race, but her declines have not stopped on the general election front… at least not yet. The latest batch of polling shows her continuing to weaken against Rubio, in North Carolina this time:
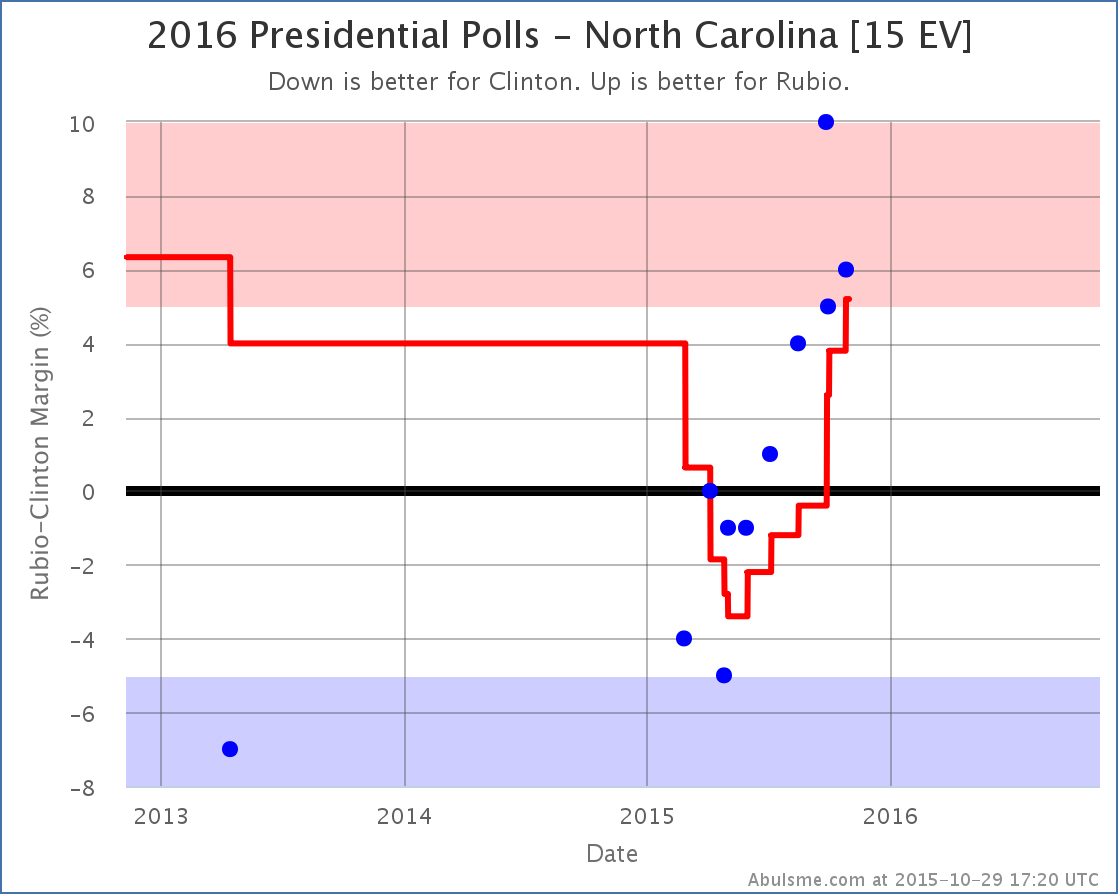
The trend toward Rubio has continued for over 5 months now. With this latest update, the poll average has Rubio with a 5.2% lead. That is enough for us to take North Carolina out of the list of states that could go either way, and just give it to Rubio. For the moment anyway.
Insert here the usual reminder of just how far it is until the election and how things can change quickly.
In any case, this weakens Clinton’s “best case” a bit, leaving us with this:
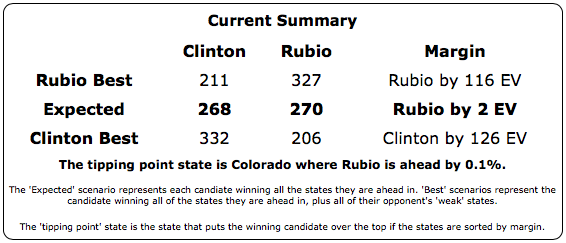
Clinton losing North Carolina from her “maybe” column makes this already close matchup look even closer. Right now Rubio does better against Clinton than any of the other “five best polled” candidates, and that race is neck and neck.
We haven’t looked at a map in awhile here, so a quick look at what a neck and neck race with the Republican just barely eking out a win looks like:
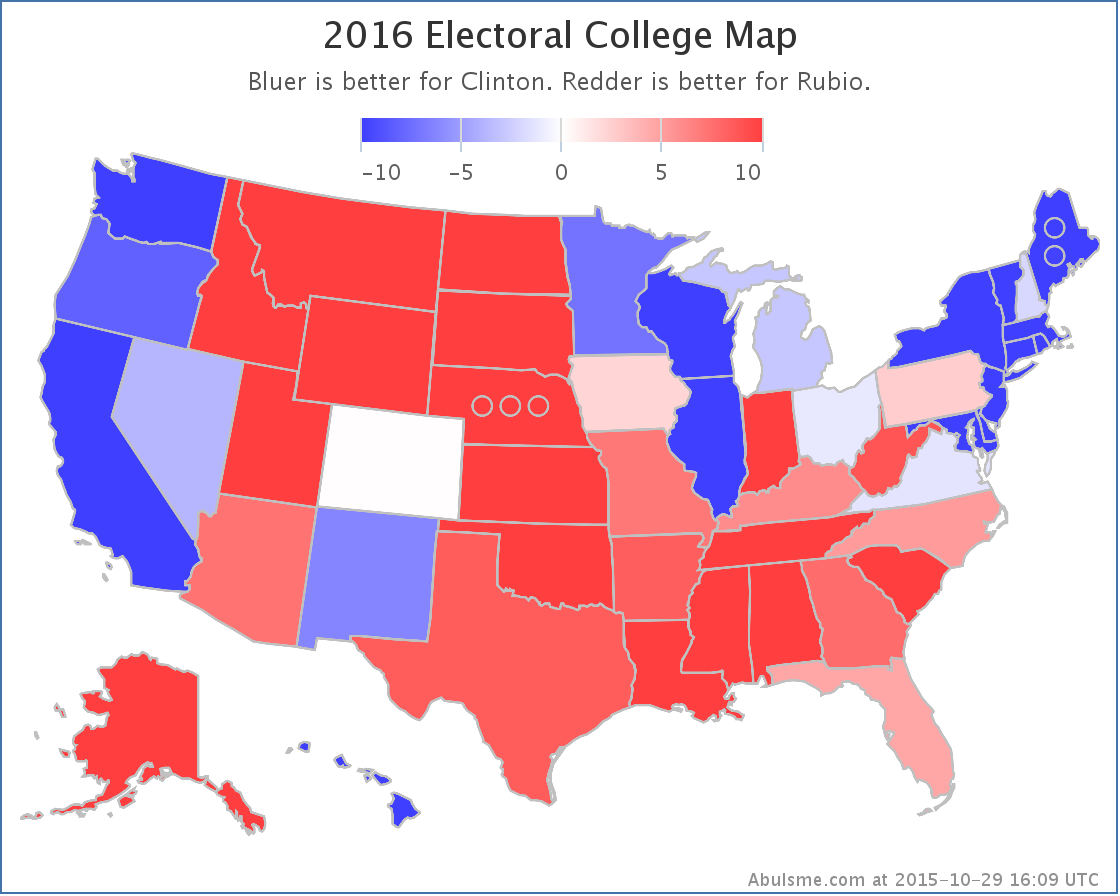
Looks like a lot more red than blue, but a lot of the red states have fewer electoral votes, which is of course why you have to look at the numbers, not just the map.
Going forward, the main question is does Clinton stop her slide and start showing improved performance against Rubio and the other Republicans. With Biden out and Sanders seemingly at a plateau, Clinton can concentrate her efforts on the general election. She seems to be on a roll the last few weeks, turning around her primary poll numbers and for the first time in many months getting a lot of positive press. The unforced self-inflicted errors have not been present for a little while. This has done what it needed to amongst Democrats. I suspect that if Clinton doesn’t do anything to damage herself, and the Republicans continue as they are, we will indeed start to see some of the states that have moved away from Clinton over the past few months start drifting back.
As usual though, actual events may vary.
376.1 days until the general election polls start to close. Stay tuned.
Note: This post is an update based on the data on ElectionGraphs.com. All of the charts and graphs seen here are from that site. Graphs, charts and raw data can be found there for the race nationally and in each state for every candidate combination that has been polled at the state level. In addition, comparisons of the best polled candidate combinations both nationally and each in each state are available. All charts above are clickable to go to the current version of the detail page the chart is from, which may contain more up to date information than the snapshots on this page, which were current as of the time of this post. Follow @ElecCollPolls on Twitter for specific poll details as I add them. And like Election Graphs on Facebook!
Continuing the trend, in today’s update Clinton just weakens further. Let’s just jump right into the details:
Clinton vs Bush
With the latest polls Bush surges to the lead in North Carolina. This has been a pretty quick move. All three polls taken since mid-September have shown a Bush lead. Before that he hadn’t managed better than a tie in North Carolina since September 2014.
This of course improves Bush’s “expected case” where he wins all the states where he leads in my poll average:
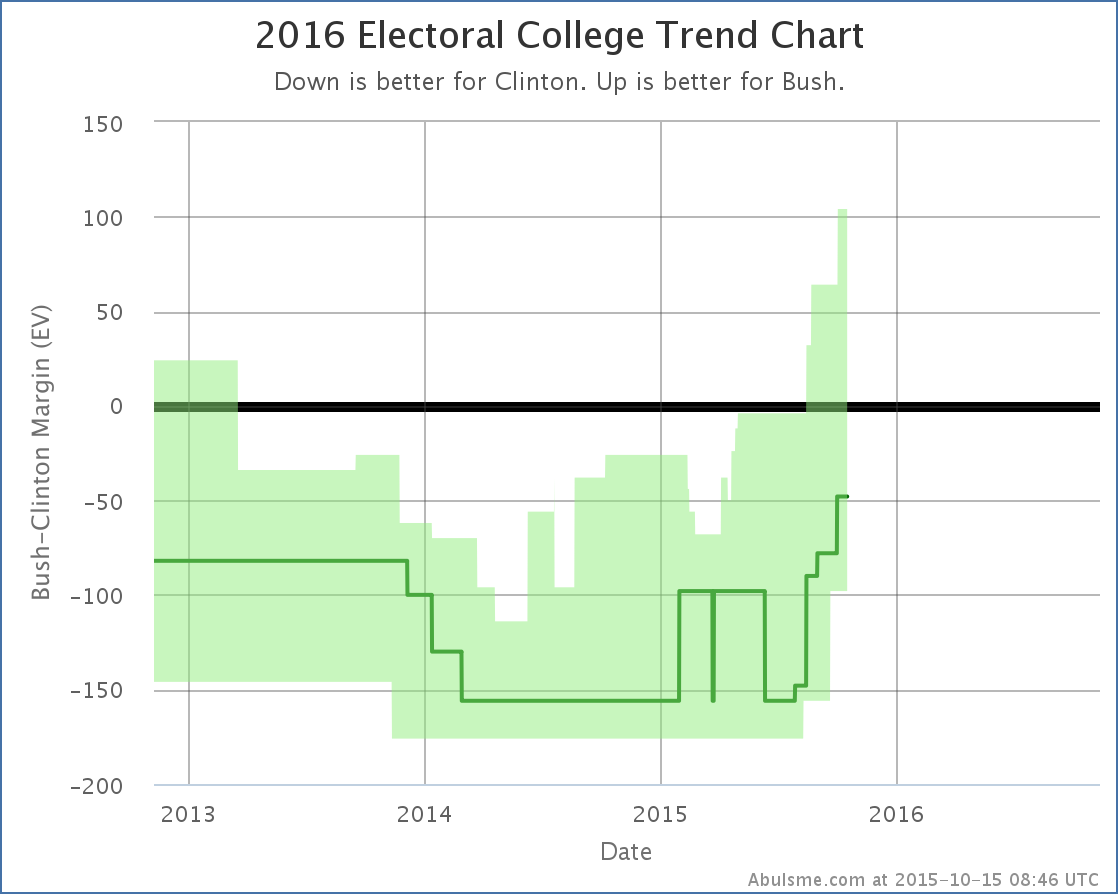
This brings the expected result to Clinton 293 to Bush 245. Still a 48 electoral vote loss for Bush, but that is closer than it has ever been before.
Bush also improved against Clinton in Virginia. This did not result in a category change, but it did move the tipping point further in Bush’s direction:
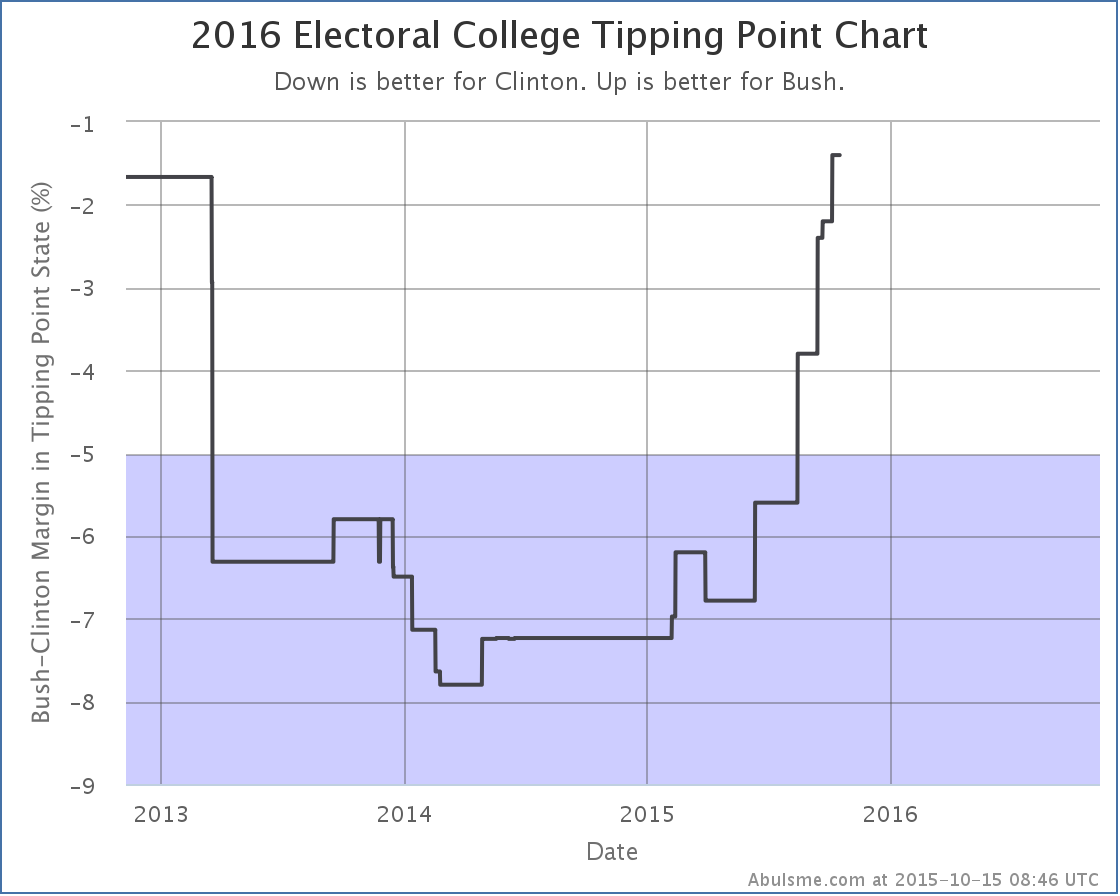
The tipping point is now 1.4% in Michigan in Clinton’s favor. So a national poll move of as little as 0.7% would flip the electoral college to Bush’s side. Bush may not be leading yet like Rubio is, but he is actually very close to that. His best case is to win by 104 electoral votes if he gets all the close states. So Bush is certainly competitive with Clinton at the moment.
Bush vs Christie
Christie? Is he still running? I thought he was just about gone. Before today’s update, nobody had bothered to include Christie in a state level poll since late August. More than a month. But CNU decided to include him in a new Virginia poll, and it improved his position in Virginia:
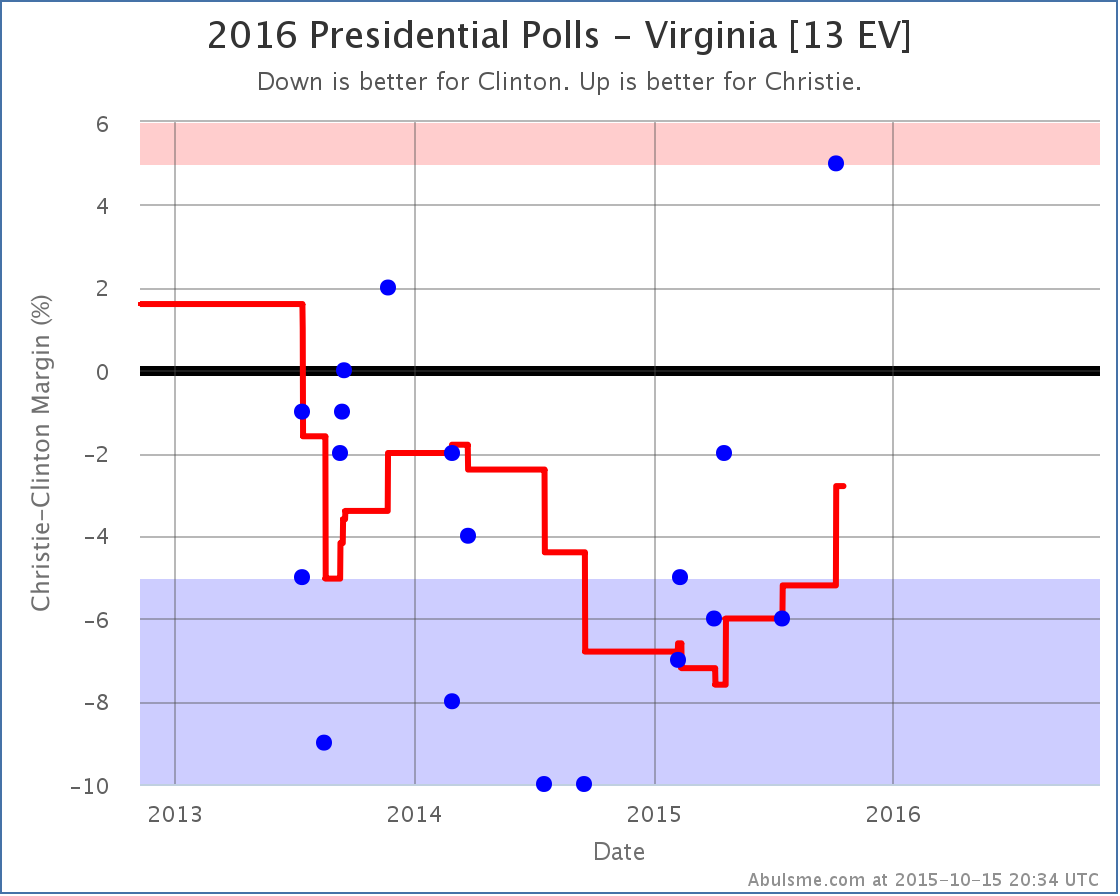
This drops Clinton’s lead against Christie in Virginia to only 2.8%, making the state once again a “swing state” that could go either way.
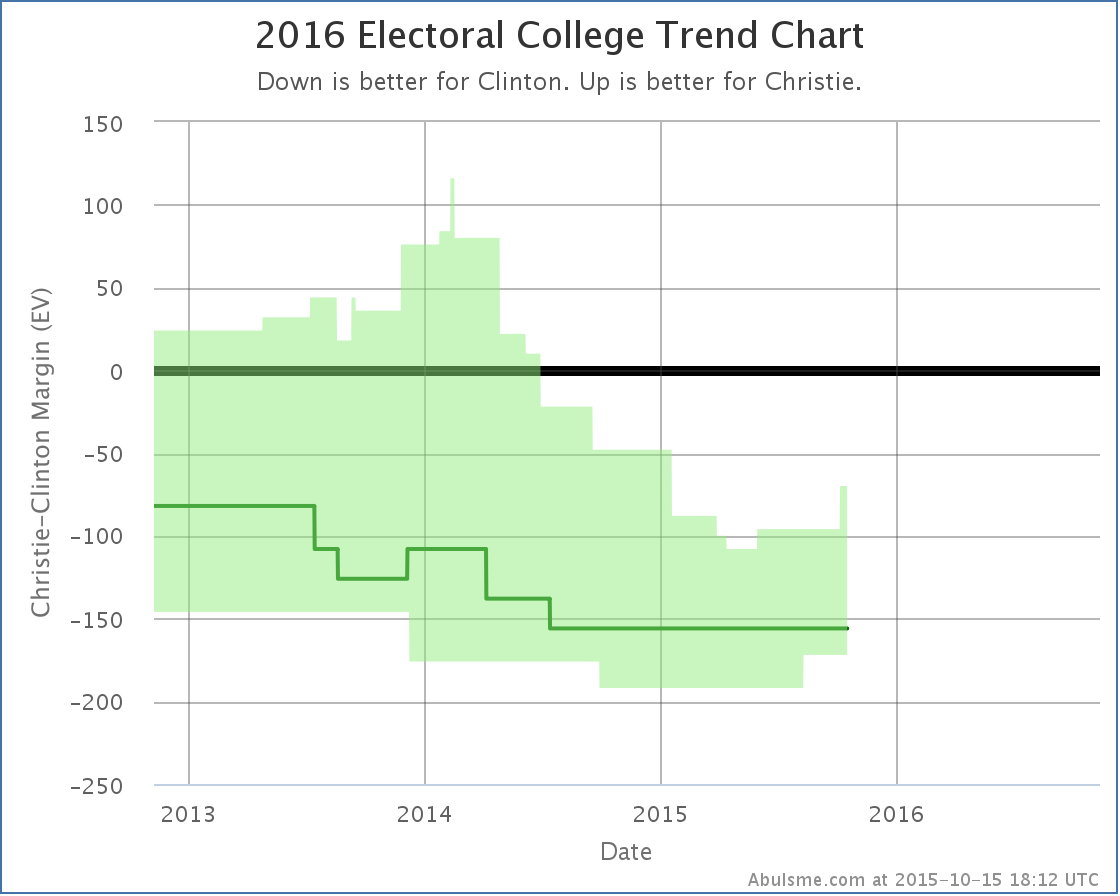
Christie’s best case, if he wins all of the close states, is now to lose by 70 electoral votes. His expected case is still to lose by 156 electoral votes. Unlike Bush, Christie is not competitive with Clinton at the moment. Things can change quickly though, so you never know! But with Christie at 1.9% in the RCP average of national Republican polls, I’m not sure if Christie will have a chance to find out.
390.1 days until the polls start to close!
Note: This post is an update based on the data on ElectionGraphs.com. All of the charts and graphs seen here are from that site. Graphs, charts and raw data can be found there for the race nationally and in each state for every candidate combination that has been polled at the state level. In addition, comparisons of the best polled candidate combinations both nationally and each in each state are available. All charts above are clickable to go to the current version of the detail page the chart is from, which may contain more up to date information than the snapshots on this page, which were current as of the time of this post. Follow @ElecCollPolls on Twitter for specific poll details as I add them. And like Election Graphs on Facebook!
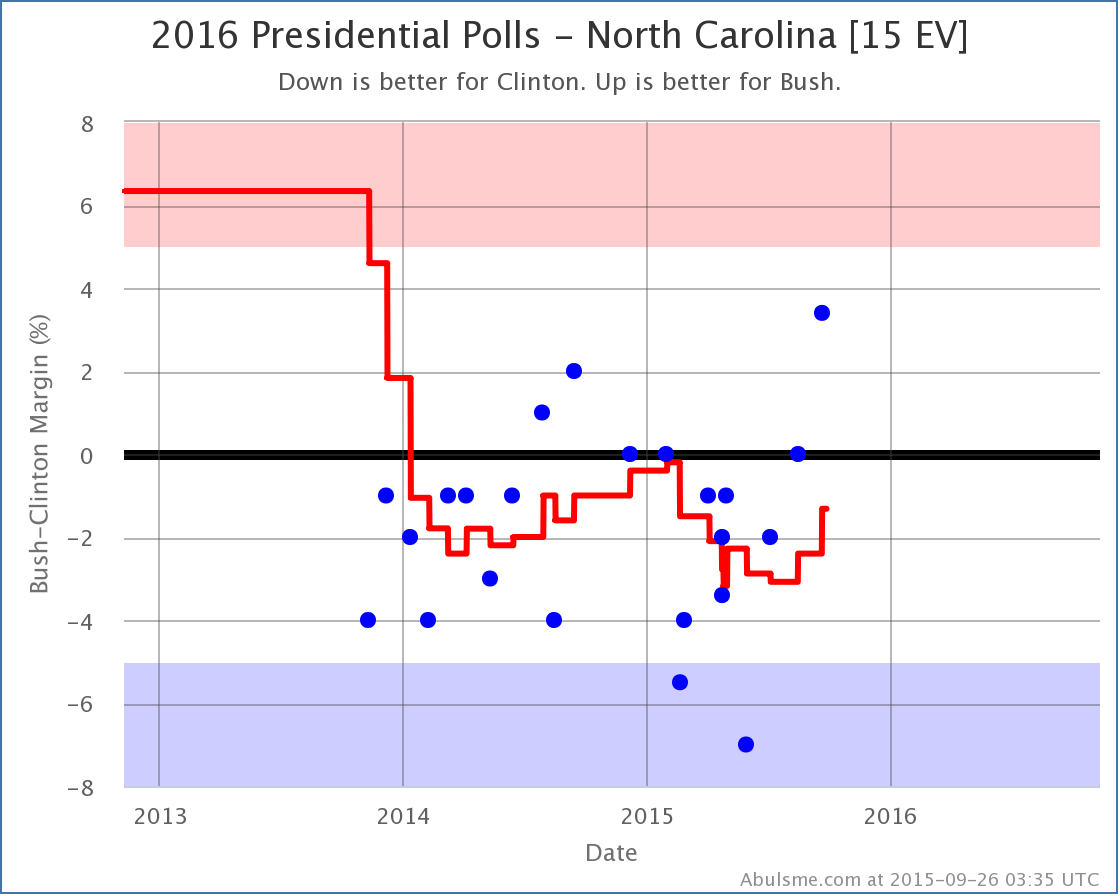
It is getting boring to keep saying “Republican getting stronger against Clinton”, but it is time for yet another update saying just that. As has been common lately, the Republican in question is Rubio, so lets look at these moves:
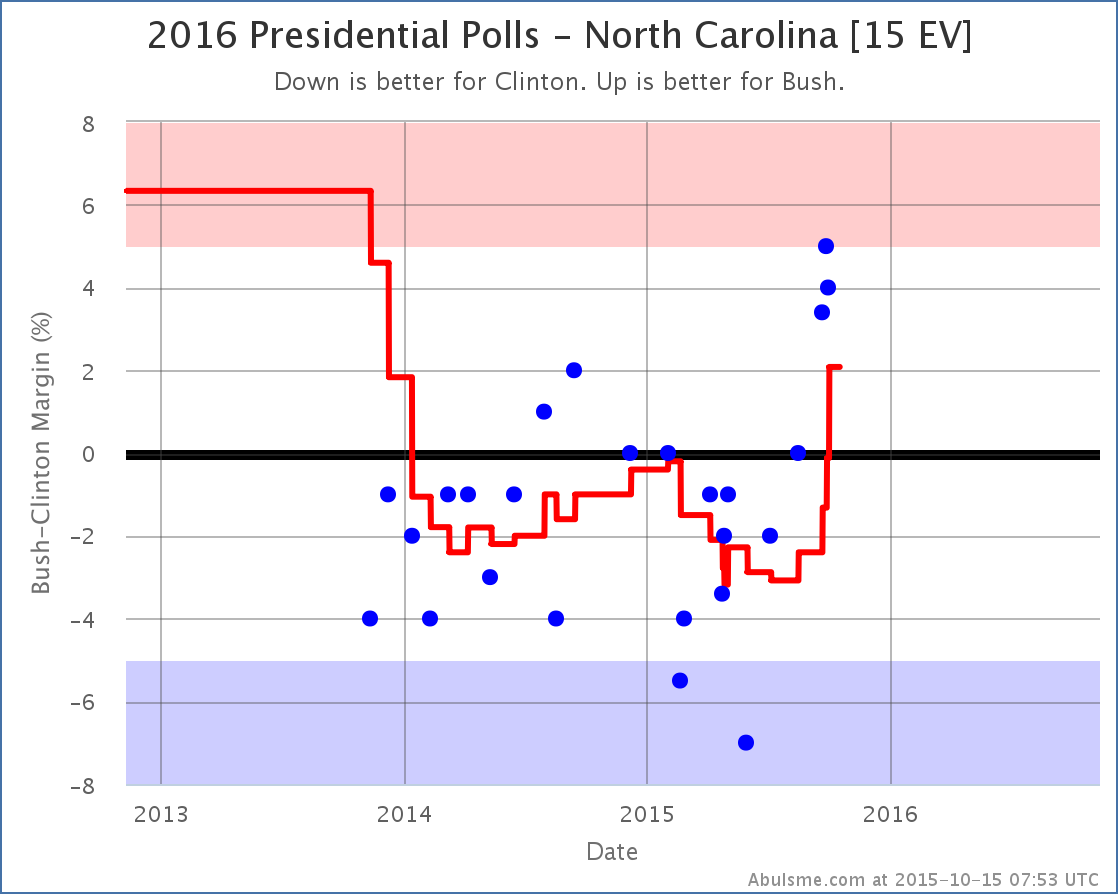
North Carolina
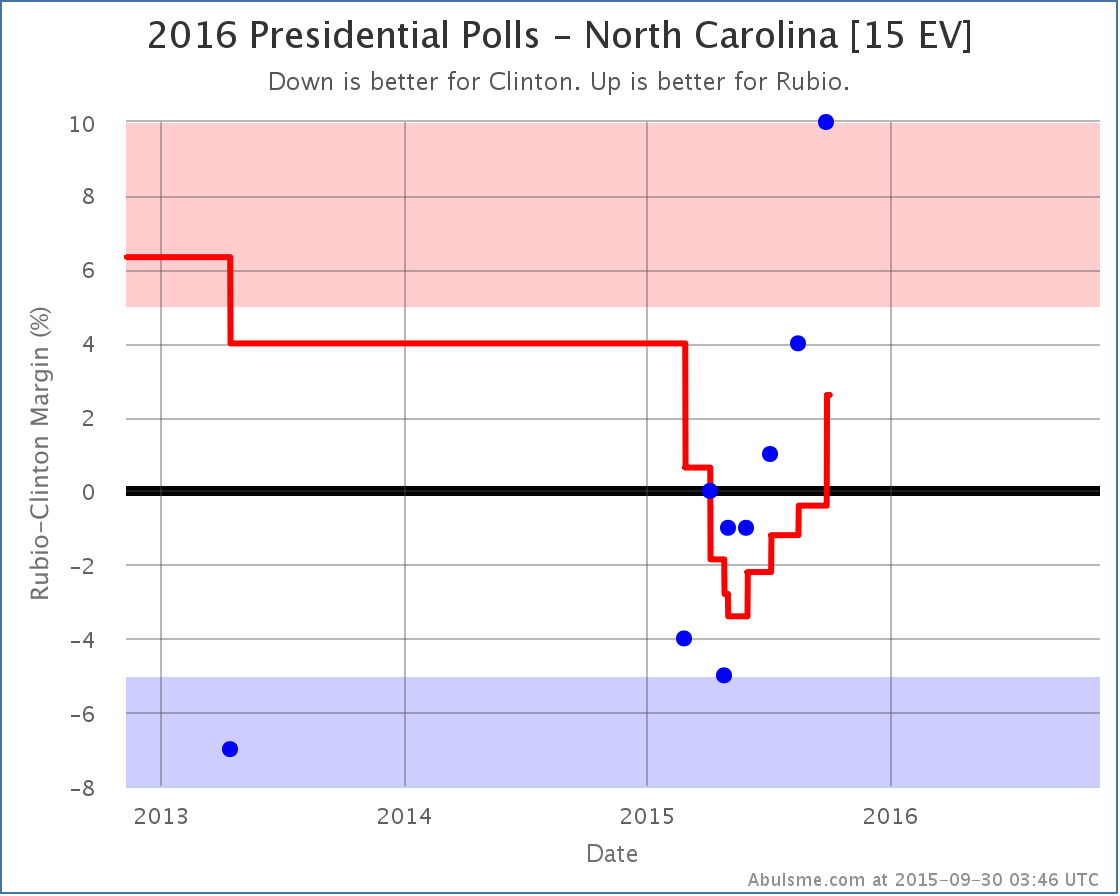
Look at that trend! It just gets worse and worse for Clinton. Every new poll in the last few months has been worse than the poll before. And with the latest, the average flips to Rubio’s side of the line.
North Carolina was never going to be a blow out for Clinton, but it was looking for awhile that she was in a good position to pull out a narrow win. That possibility seems to be evaporating quickly.
Michigan
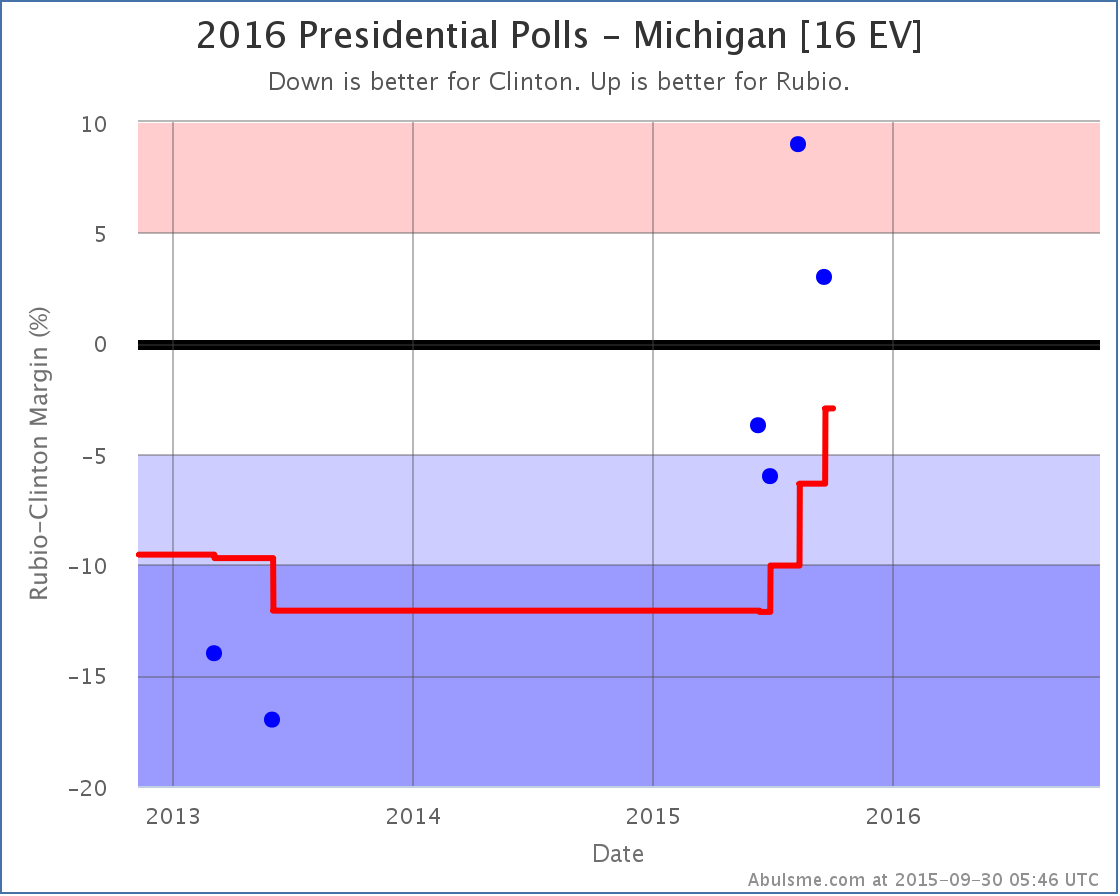
There are less polls to back it up, but the move in Michigan is potentially more dramatic. In a few months the average has gone from a strong Clinton lead, to Michigan essentially being a toss up.
Once again, not a good trend for Clinton. Michigan has not gone Republican since voting for George HW Bush in 1988. In 5 of those 6 elections the winning margin for the Democrats was over 5%. In two of them it was over 10%. A close Michigan means a Clinton in trouble.
National Overview
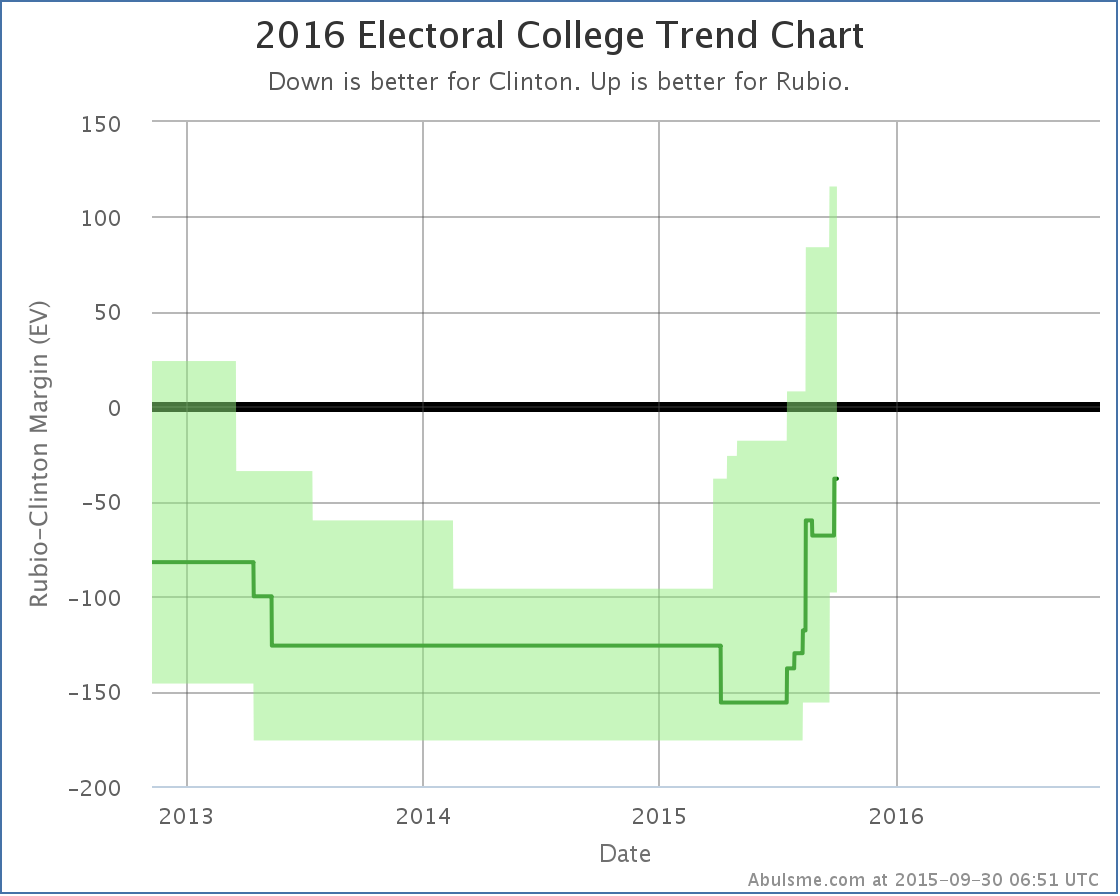

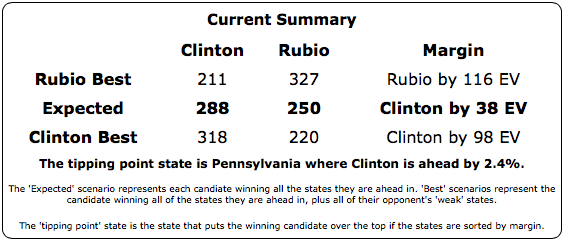
Yes, if everybody wins the states where they are leading in my poll average, Clinton still wins… barely. But there are a HUGE number of states where it is close. In this matchup, nine states are in play and the range of possible outcomes is very wide. Right now Rubio’s best case (if he sweeps all the close states) is actually better than Clinton’s best case (if she sweeps the close states).
Clinton still has an advantage here, but just by the slimmest of margins. There is a long way to the election, but for the moment, at least in the Clinton vs Rubio matchup, this is a close race…
Other Candidates
So Rubio is doing well against Clinton, and that is the only one of the five best polled candidate combinations with a change today, but a quick look at the comparison is still useful.
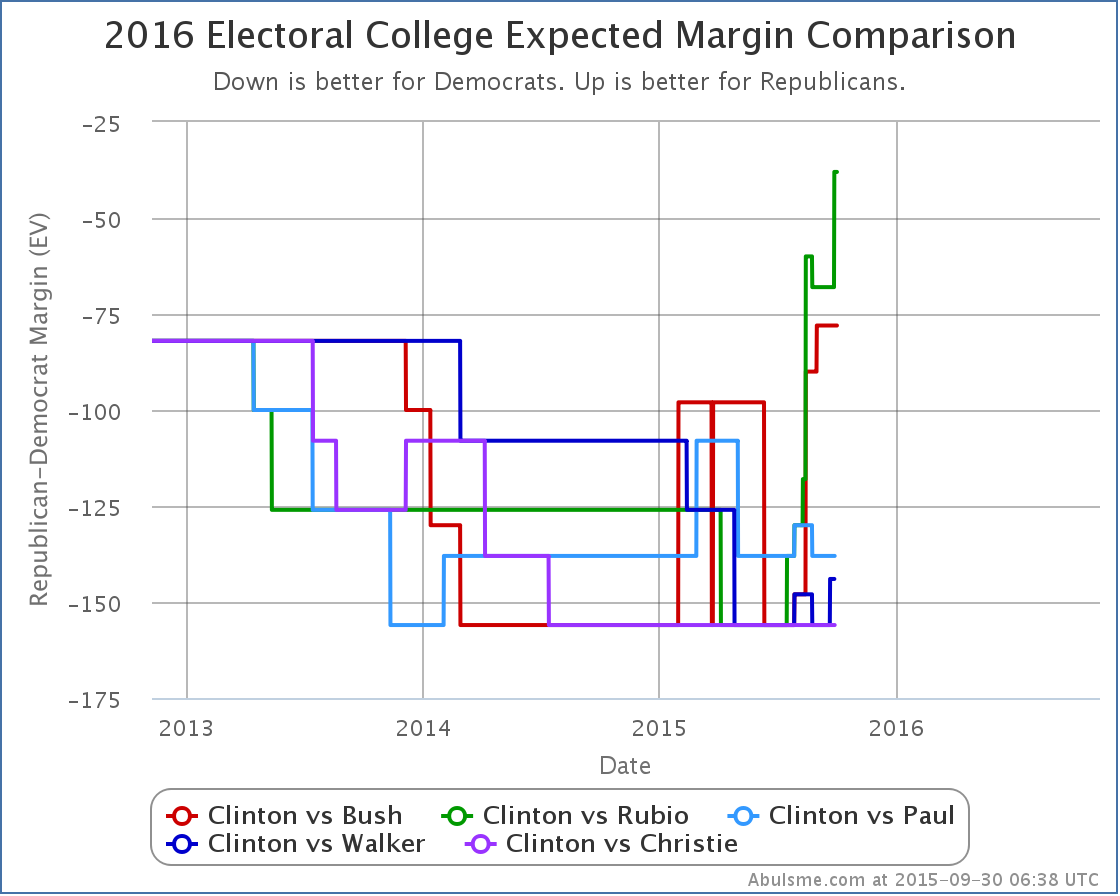
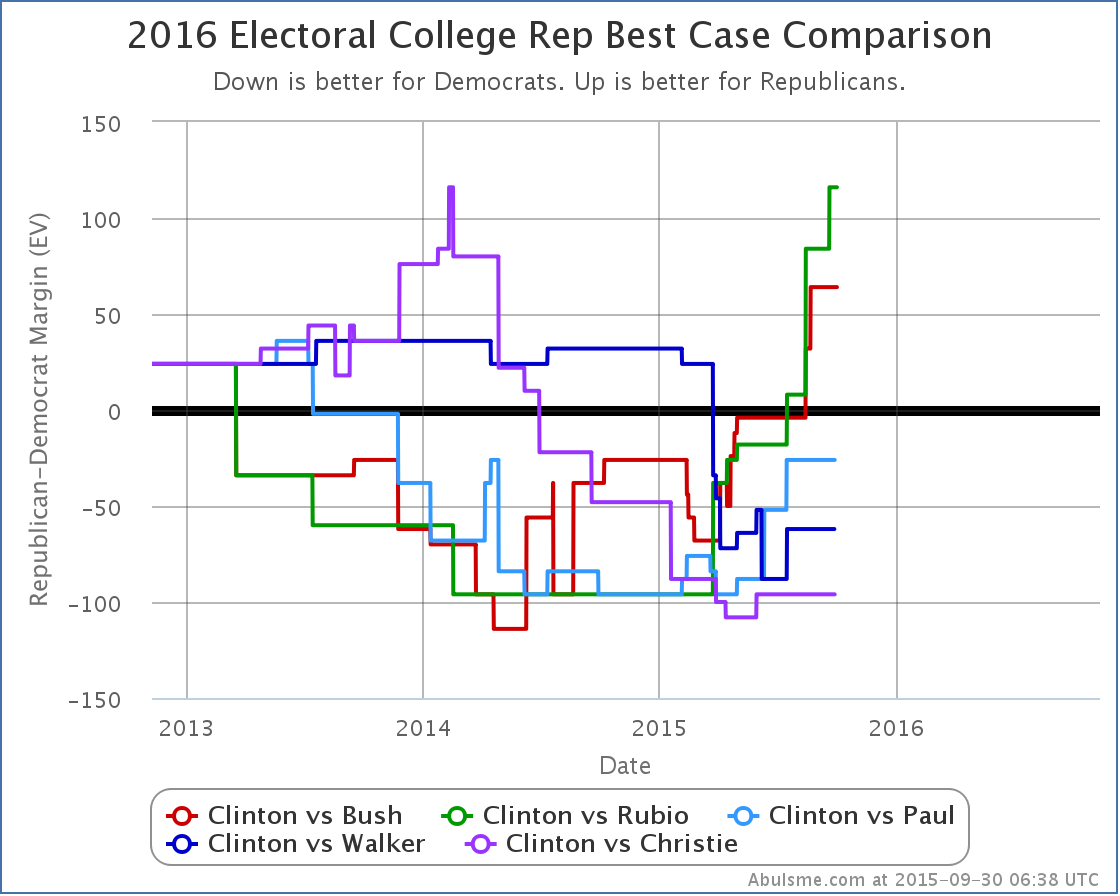
Highlighting these two comparisons specifically because of the Rubio changes today, but similar trends show up for the other comparisons. Of the five best polled combinations, Bush and Rubio are standing out and have been dramatically improving their positions vs Clinton. Paul, Walker and Christie… have not. At least not lately. Of course, Walker has already dropped out at this point, and Christie and Paul are on life support, with their national Real Clear Politics polling averages at 3% or less right now. So they just aren’t getting the attention… or the polling volume lately… of Bush and Rubio.
As I’ve mentioned before, other candidates are getting a lot more attention now, but they are still way behind these five in the arbitrary polling quality metric I use. They just haven’t had enough sustained polling to get a comparable picture yet. That will change if the folks like Trump and Carson and Fiorina remain viable and folks like Paul, Walker and Christie fade away. Same thing for Sanders and Biden. It just takes a bit of time to get enough good state polls to start paying serious attention to the results in an analysis like this.
405.1 days until polls start to close.
Note: This post is an update based on the data on ElectionGraphs.com. All of the charts and graphs seen here are from that site. Graphs, charts and raw data can be found there for the race nationally and in each state for every candidate combination that has been polled at the state level. In addition, comparisons of the best polled candidate combinations both nationally and each in each state are available. All charts above are clickable to go to the current version of the detail page the chart is from, which may contain more up to date information than the snapshots on this page, which were current as of the time of this post. Follow @ElecCollPolls on Twitter for specific poll details as I add them.
Aside from that one blip of good news in August every single update I’ve posted in many months has been more bad news for Clinton. This update is no exception, with two changes worth noting, both in favor of the Republican.
Clinton vs Bush
The new poll in North Carolina didn’t shift move the state to a new category, but the move from a Clinton lead of 2.4% down to a Clinton lead of 1.3% moved the tipping point, which had been North Carolina. With North Carolina shifting Bushward, the tipping point becomes Colorado, where Clinton is ahead by 2.2%.
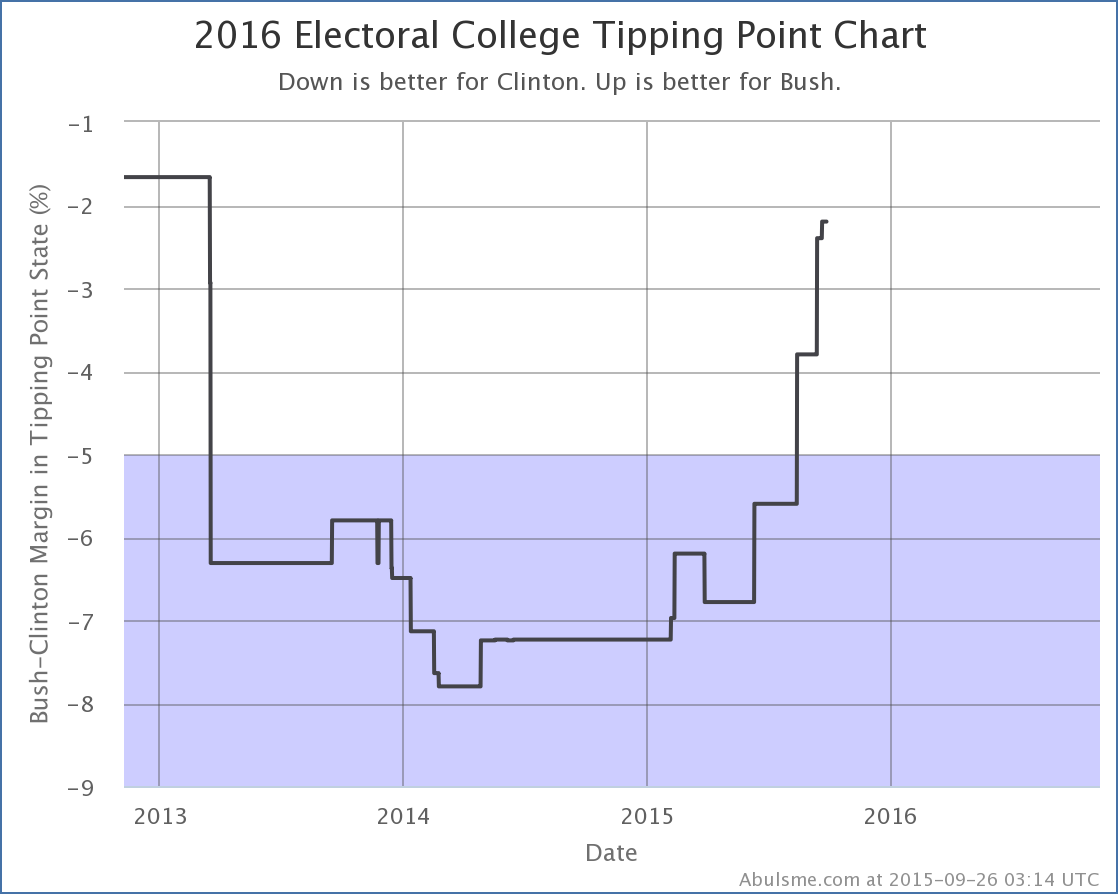
This is a relatively small blip upward for the tipping point, but it continues the trend. This race just keeps getting closer. Remember, the tipping point is how far polls have to move nation wide in order to flip the result of the election. The gap is now only 2.2%. That is tiny. A 2.2% lead can disappear over night, or be an illusion cased by a bias in the polls. Right now, Bush and Clinton are effectively neck and neck. Yes, Clinton has a lead, but it is extremely narrow.
The spectrum of the states now looks like this:
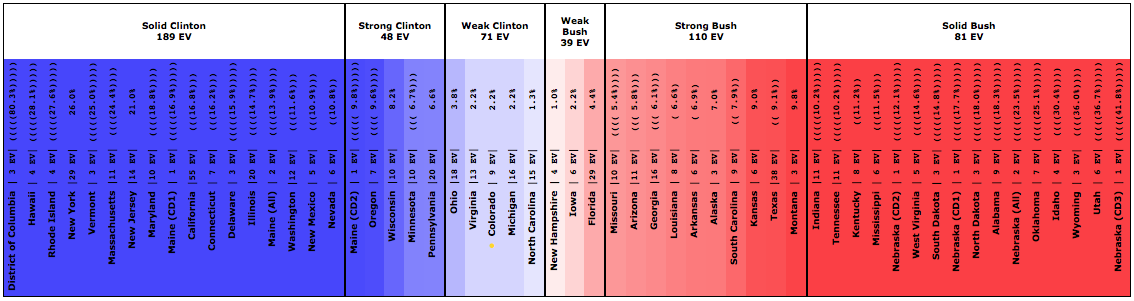
Clinton’s buffer is down to just Colorado, Michigan and North Carolina, all states where her lead is less than 2.2%. We’re only a few Republican leaning polls in those three states away from having a Republican in the lead for the first time since I launched this site.
Clinton vs Walker
Well, he dropped out. But a poll in Iowa that included him wrapped up just before his announcement. And that poll was good for Walker. So, one last hurrah…
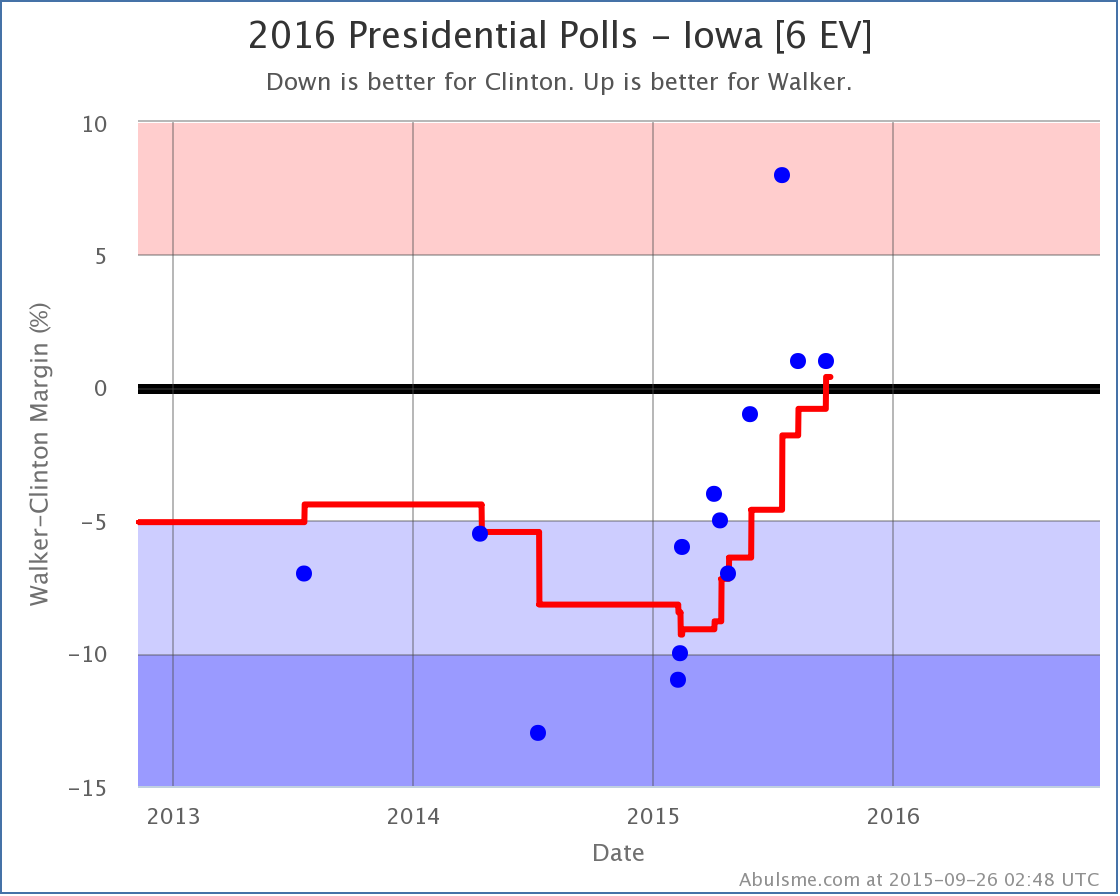
With this last poll… and it will be surprising if there are any more with Walker… Walker takes a narrow lead vs Clinton, and so moved Iowa into his column, increasing his “expected” result against Clinton…
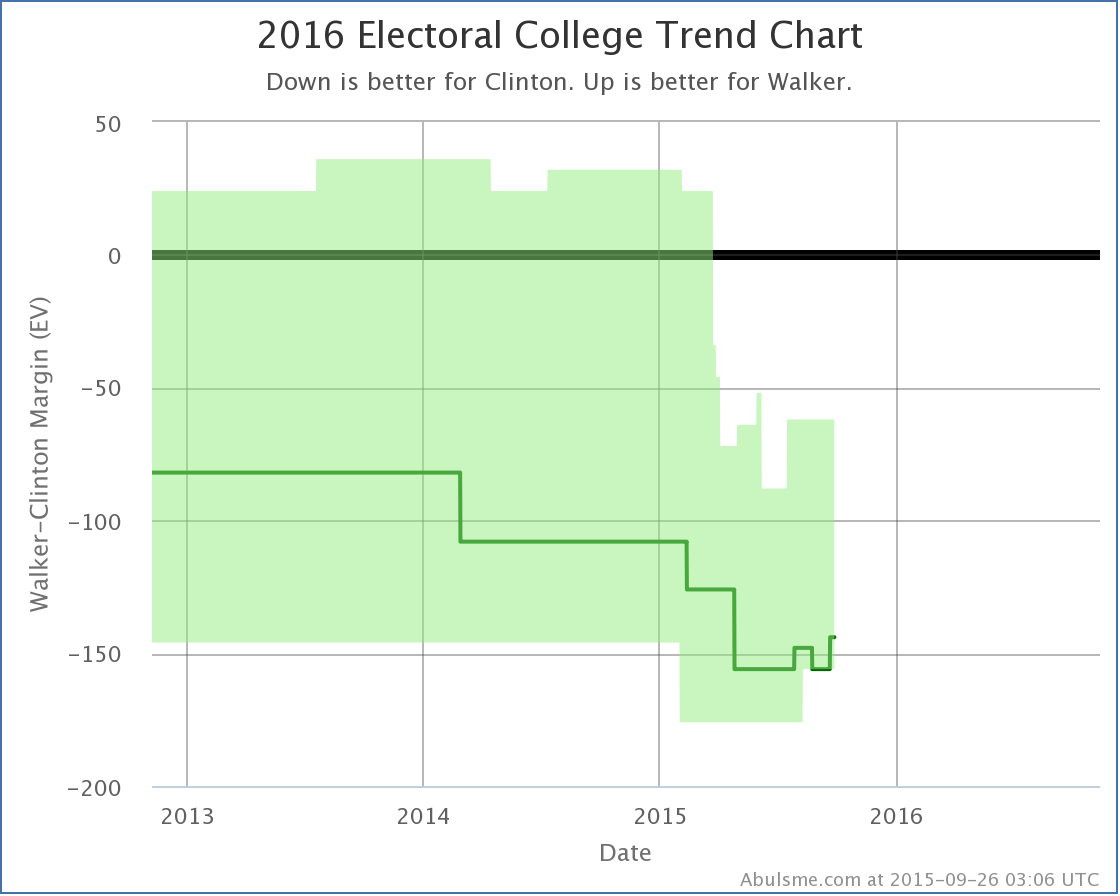
He increases his expected result to… losing by 144 electoral votes! Well, OK, Walker wasn’t the most competitive of the Republican candidates against Clinton.
Goodbye Walker.
409.8 days until polls start to close.
Note: This post is an update based on the data on ElectionGraphs.com. All of the charts and graphs seen here are from that site. Graphs, charts and raw data can be found there for the race nationally and in each state for every candidate combination that has been polled at the state level. In addition, comparisons of the best polled candidate combinations both nationally and each in each state are available. All charts above are clickable to go to the current version of the detail page the chart is from, which may contain more up to date information than the snapshots on this page, which were current as of the time of this post. Follow @ElecCollPolls on Twitter for specific poll details as I add them.
Only one change of note this week. PPP did another poll of North Carolina. Of the five best polled candiate pairs… right now still Clinton vs Bush, Paul, Christie, Huckabee, and Rubio… only Clinton vs Huckabee resulted in a category change.
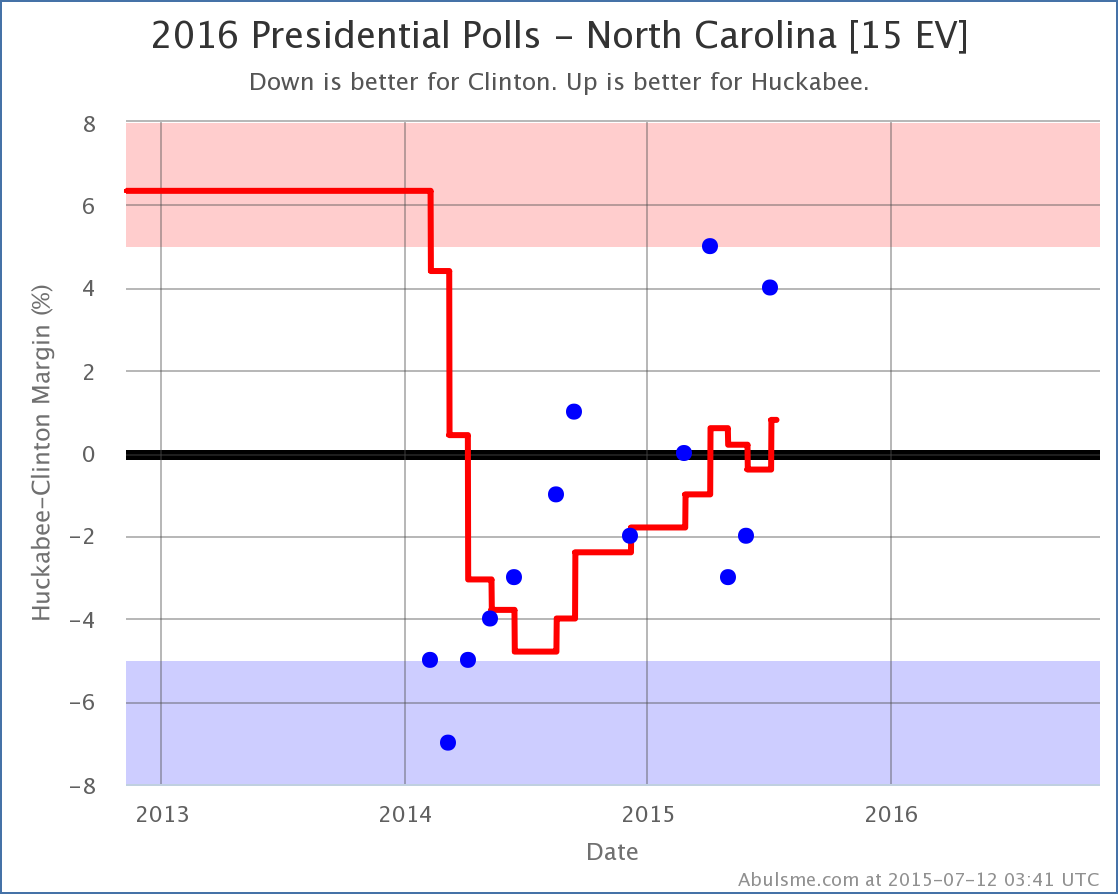
Huckabee takes the lead again after having lost it at the end of May. Looking at the long term trend, Huckabee has been gaining against Clinton in North Carolina for the last year or so. Now, is this just Huckabee, or part of a larger trend against Clinton?
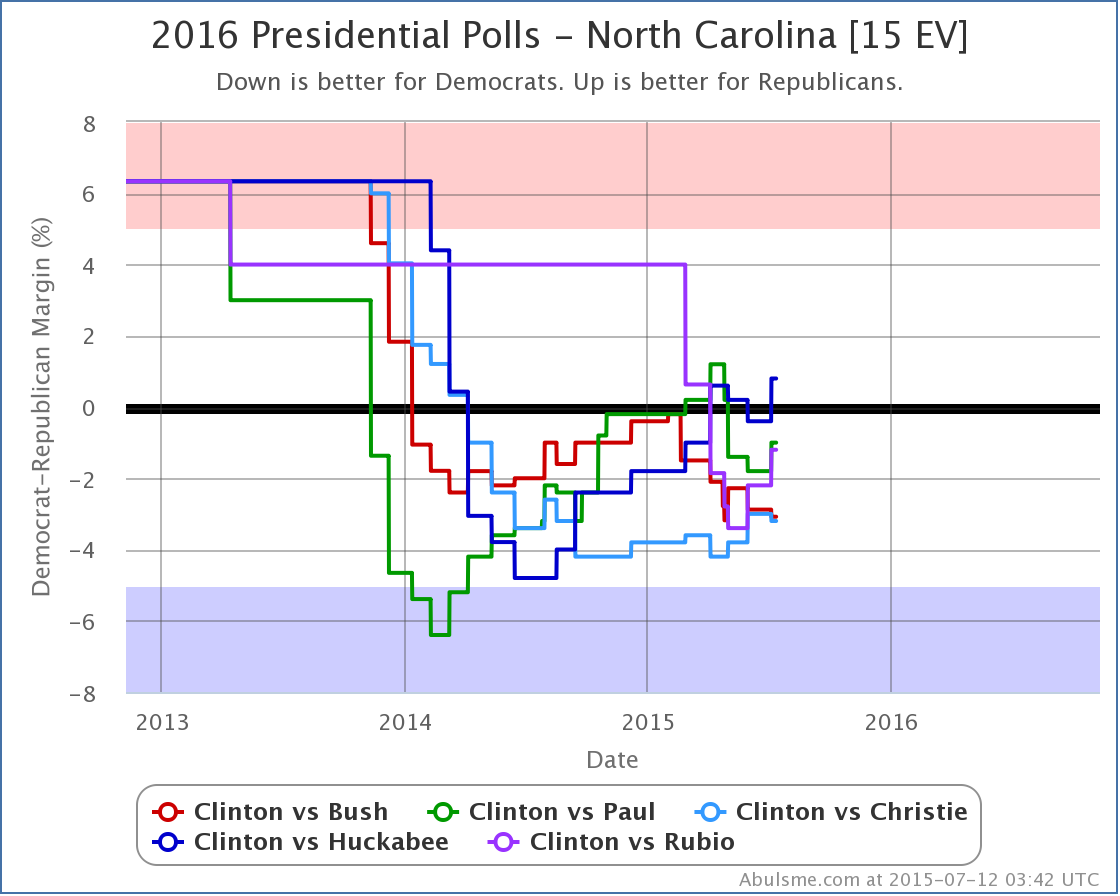
Lets look at how each of these five candidates has done against Clinton in North Carolina over the last six months, namely comparing where they stand today (July 12) vs where they were six months ago (January 12).
- Clinton vs Huckabee: Clinton by 1.8% -> Huckabee by 0.8% (2.6% Huckabee gain)
- Clinton vs Christie: Clinton by 3.8% -> Clinton by 3.2% (0.6% Christie gain)
- Clinton vs Paul: Clinton by 0.2% -> Clinton by 1.0% (0.8% Clinton gain)
- Clinton vs Bush: Clinton by 0.4% -> Clinton by 3.1% (2.7% Clinton gain)
- Clinton vs Rubio: Rubio by 4.0% -> Clinton by 1.2% (5.2% Clinton gain)
So, no. There hasn’t been an across the board Republican gain here, at least not over the last six months. (There is a bit more of move toward the Republicans if you look back a whole year.) Over six months though, we have Huckabee and Christie doing better against Clinton, while Paul and Bush are doing worse.
(You can discount the Rubio results, as six months ago there was only one actual Clinton vs Rubio poll in NC, so this was primarily movement toward the real Rubio numbers away from the average of previous election results, rather than actual movement in Clinton vs Rubio.)
Given this, there might really be something to the notion that Huckabee may be getting some resonance in North Carolina that Bush is not.
Regardless though, North Carolina is “close” for all five of these candidates against Clinton. It could very easily go either way. The differences between these five candidate pairs aren’t actually all that huge. North Carolina is looking like it will definitely be one of the swing states this cycle.
Looking back at Huckabee for a minute, we can see how this changes his “expected” result vs Clinton:
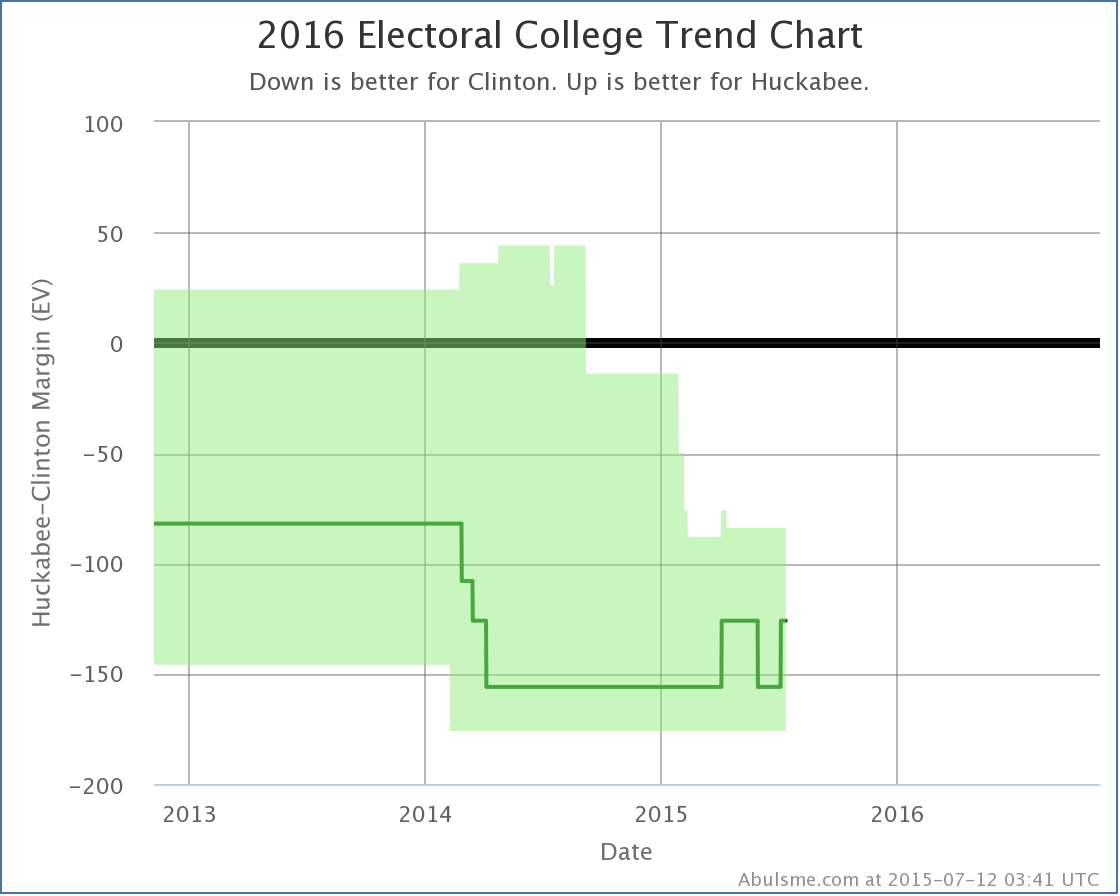
With North Carolina back in his column, if each candidate won every state they are currently ahead in, we end up with… Clinton 332 to Huckabee 206. This is a 126 electoral vote win for Clinton.
This is also an exact match for the 2012 election results, which were Obama 332 to Romney 206. Not only do the numbers match, but every single state matches. So with today’s polls, with Clinton and Huckabee, we essentially end up with an exact rerun of 2012.
Interestingly though, if you look at just the “expected” results such as the above, and not the “best cases” for each of the Republicans (where you give them all the states where Clinton is ahead by less than 5% too) then at the moment, somewhat shockingly I think… Huckabee is actually out performing each of the other four Republicans in the five best polled candidate combinations:
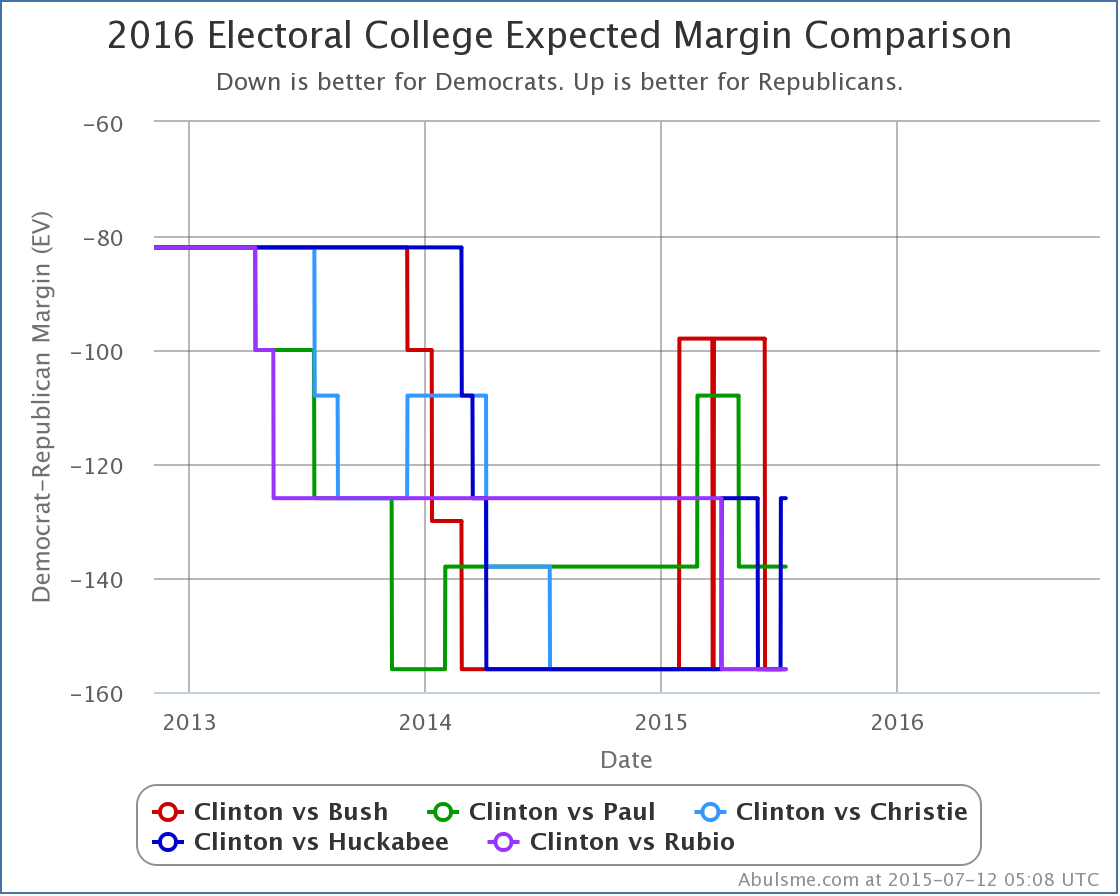
Of the five best polled candidates:
- Clinton vs Huckabee: Huckabee loses by 126 – exact match of 2012
- Clinton vs Paul: Paul loses by 138 – Paul gets all Romney states except NC (15 ev), but gains CO (9 ev)
- Clinton vs Bush, Christie and Rubio: Republican loses by 156 – Republican gets all Romney states except NC (15 ev)
So, with all the polling and back and forth so far and all my various squiggly lines… at least as of today… the only states that are shifted from 2012 for any of these five candidates against Clinton are Colorado and North Carolina. Barely any change at all!
But, as I always try to make sure to mention: All of these numbers are “if the election was held today” numbers, and the election is most certainly not held today! (And there are still many states with little or no 2016 polling yet.)
There will be a lot of events between now and the election, and a lot of campaigning, and a lot more polling. Plenty of time for things to change… potentially a lot.
485.8 days until the first polls close as I post this. Stay tuned!
Note: This post is an update based on the data on my 2016 Electoral College Analysis Site. All of the charts and graphs seen here are from that site. Graphs, charts and raw data can be found there for the race nationally and in each state for every candidate combination that has been polled at the state level. In addition, comparisons of the best polled candidate combinations both nationally and each in each state are available. All charts above are clickable to go to the current version of the detail page the chart is from, which may contain more up to date information than the snapshots on this page, which were current as of the time of this post. Follow @ElecCollPolls on Twitter for specific poll details as I add them.
|
|