This is the website of Abulsme Noibatno Itramne (also known as Sam Minter).
Posts here are rare these days. For current stuff, follow me on Mastodon
|
With today’s batch of polls added, Clinton vs Paul goes back to being the “best polled” candidate combination by my metric and thus is again the default view on election2016.abulsme.com. No status changes on Clinton vs Paul though.
There were however two other status changes of note that I’ll highlight here. (There were status changes below the five best polled candidate combinations as well, see @ElecCollPolls for those, or for details of the specific polls added today.)
Clinton vs Huckabee
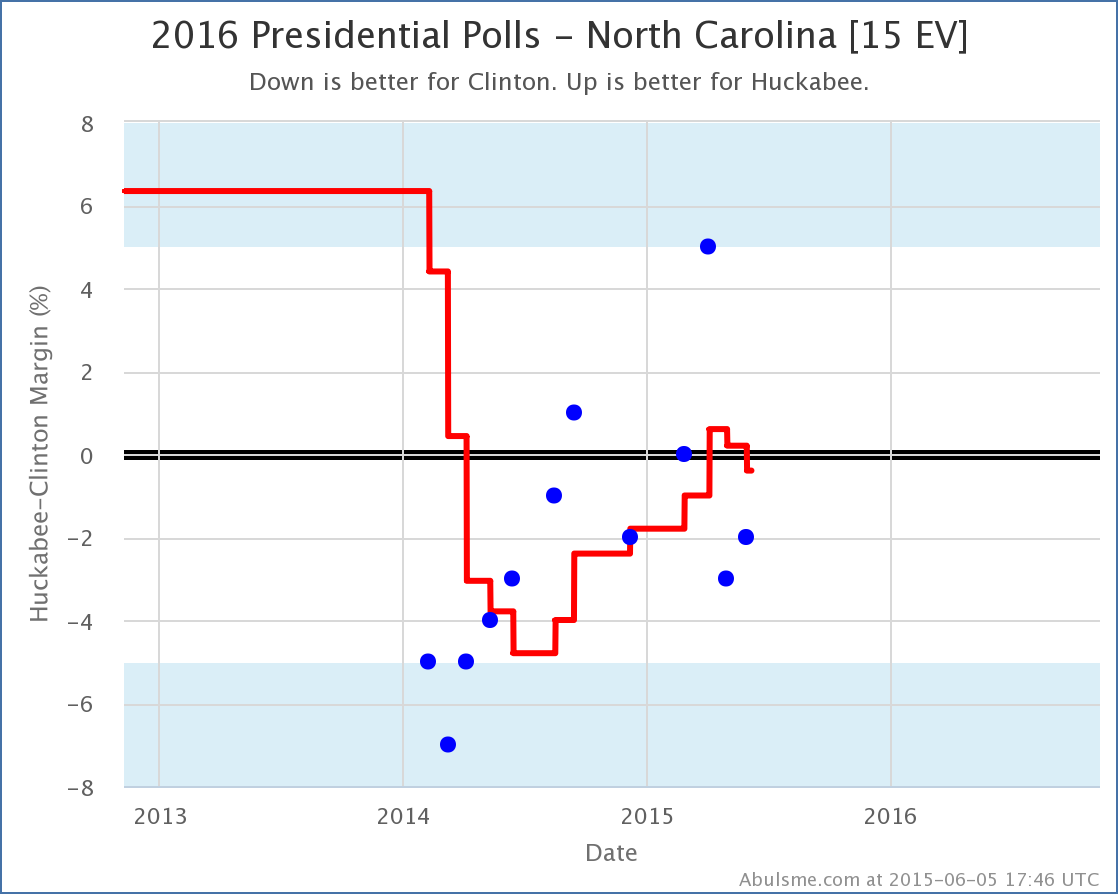
After a flirtation in April and May with actually leading Clinton in North Carolina, the state moves from just barely Huckabee, to just barely Clinton. Either way, North Carolina looks close in this matchup for the moment. This does however change the “expected” result in this match up in Clinton’s favor:
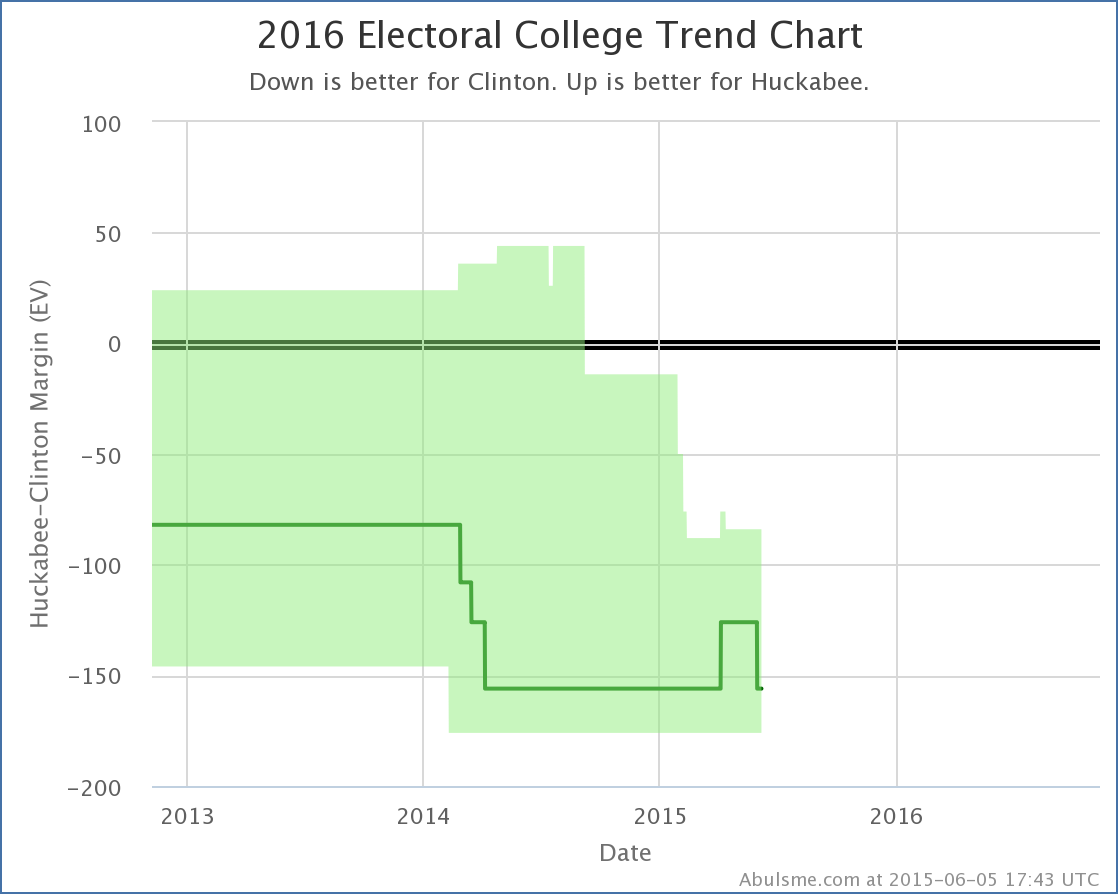
With this, the expected result… where each candidate wins all the states where they are currently ahead… returns to Huckabee losing by 156 electoral votes. (Specifically Clinton 347, Huckabee 191.) This has been the “expected” Clinton vs Huckabee result for most of the last year.
Clinton vs Christie
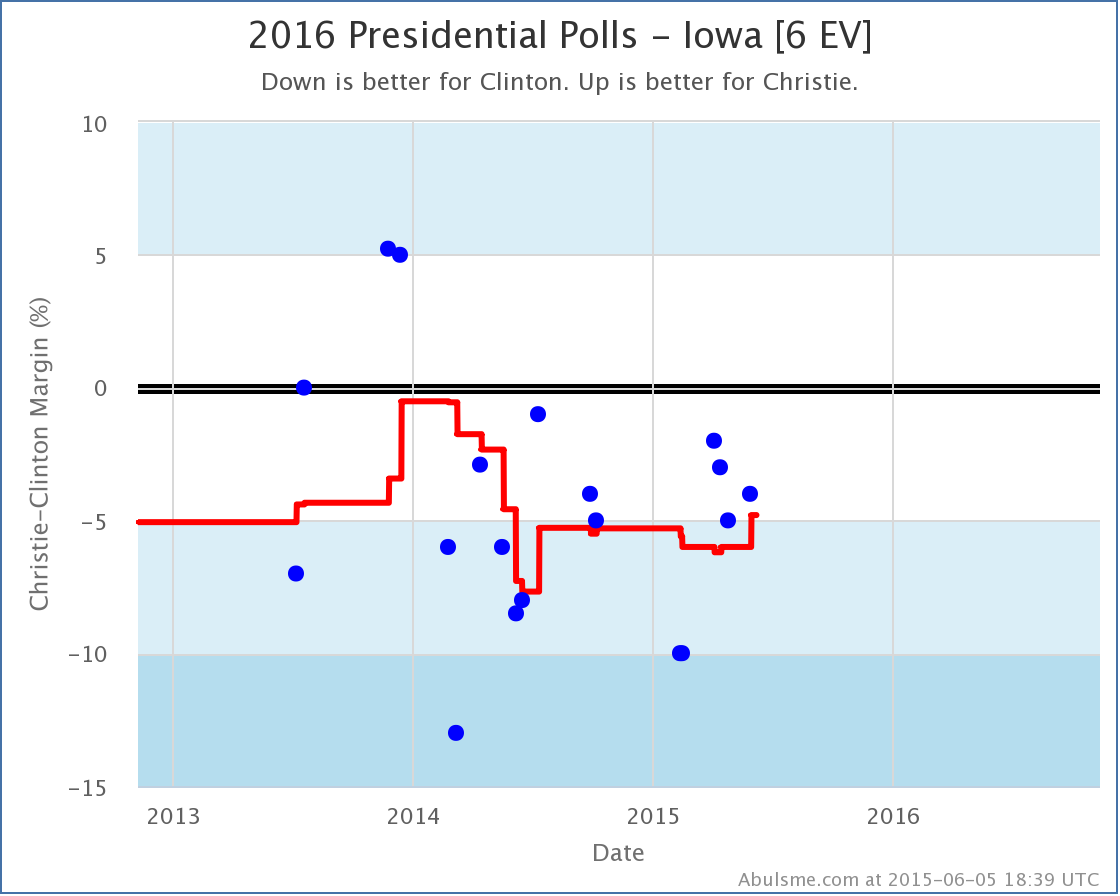
With the latest poll, the poll average for Clinton vs Christie in Iowa show’s Clinton’s lead below 5% for the first time since almost exactly a year ago. A 4.8% lead is still nothing to sneeze at, but it is close enough that we now allow for the possibility of Christie winning Iowa in our range of reasonably possible outcomes, so Christie’s “best case” improves:
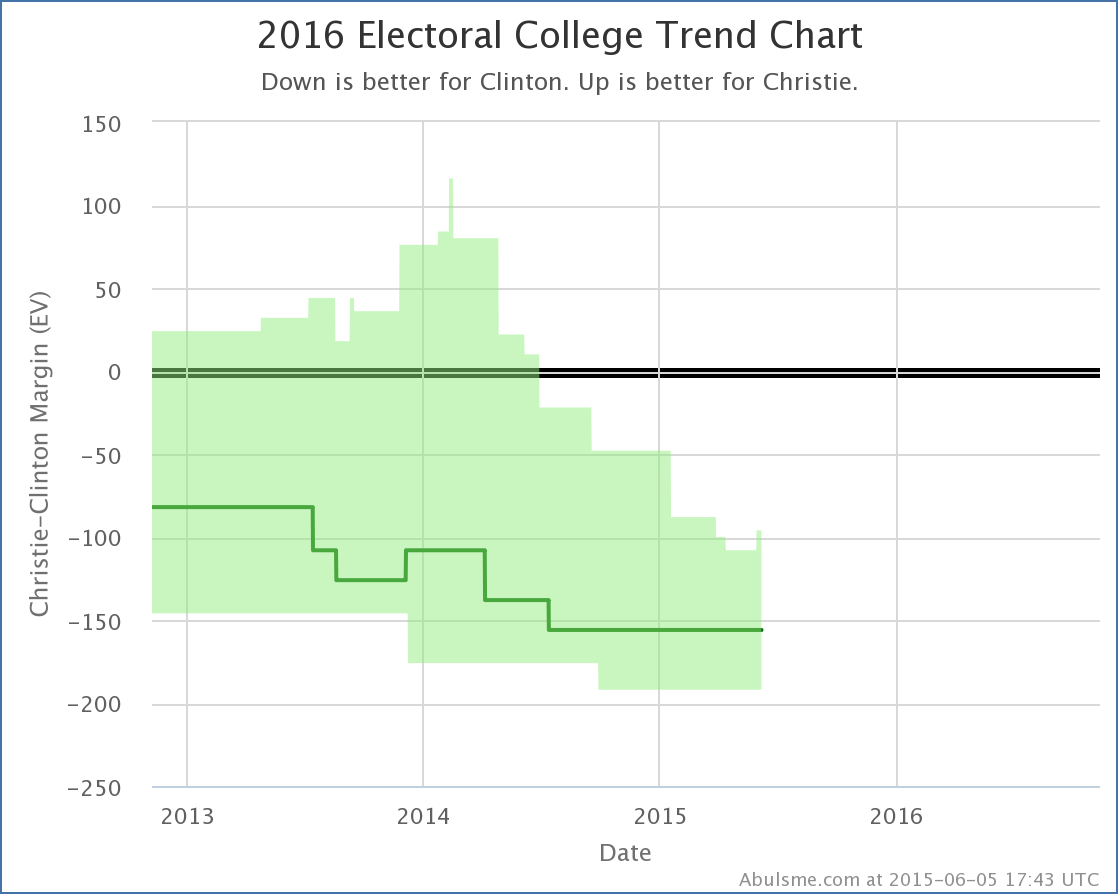
That bump in the top right of the green envelope is the improvement we’re talking about here. Christie’s best case is still a 96 electoral college loss to Clinton. Along with his tipping point improvement that I noted on Saturday though, this makes two moves in Christie’s direction in a week, so maybe there is some new momentum in his direction? Nah, probably not, right?
The Others
There may or may not be a specific move toward Christie, but lets look at the comparison chart in Iowa for all five of the “best polled” candidate combinations…
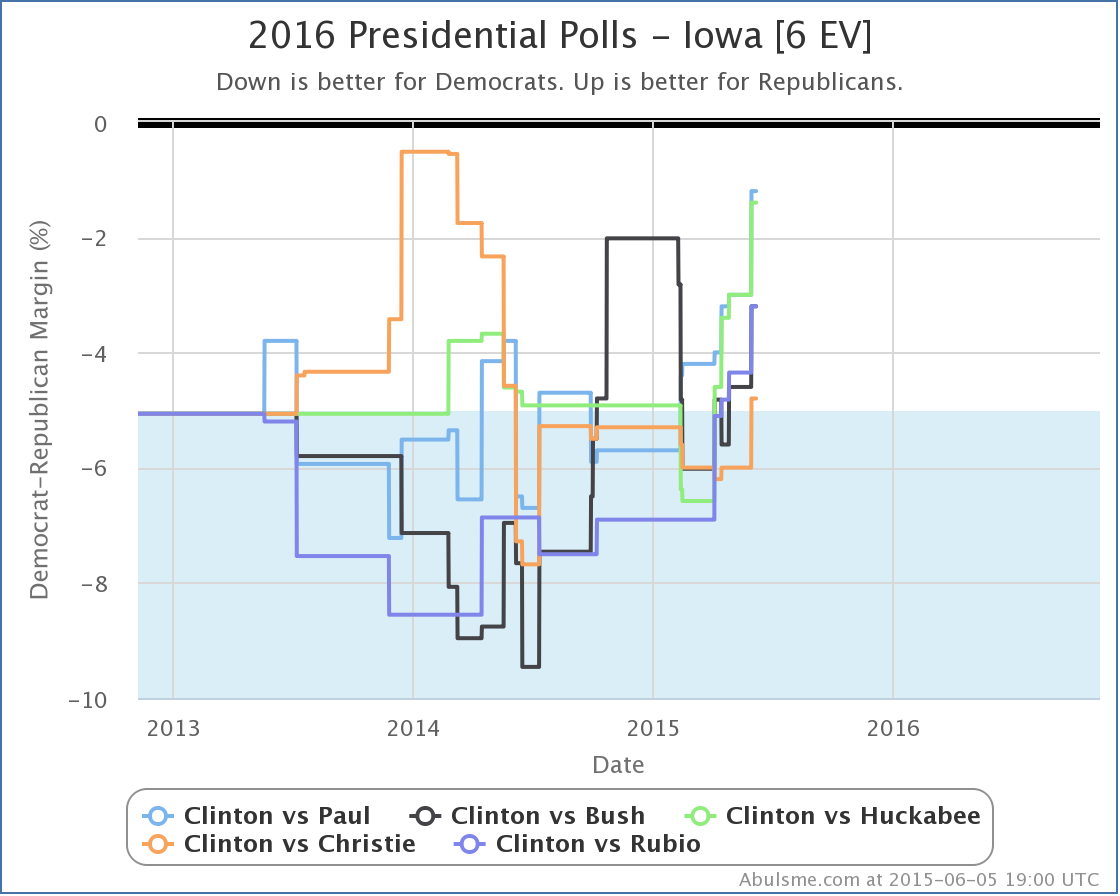
Hmm, definitely looks like some movement there in the last couple months.
Clinton’s lead seems to be evaporating in Iowa vs all five of these Republican challengers. But isn’t she spending all sorts of time in Iowa right now? Of course, Iowa gets attention due to the caucus of course, not an much for the general election, but still. This isn’t a good trend for Clinton.
There is no clear move like this on any of my national trend lines yet, but those take some time to move given that you need polling from a lot of states. But Iowa is one of the most polled states, so this could be a warning sign for Clinton’s broader situation.
522 days until the polls start closing. Plenty of time for drama and movement. Stay tuned!
Note: This post is an update based on the data on my 2016 Electoral College Analysis Site. All of the charts and graphs seen here are from that site. Graphs, charts and raw data can be found there for the race nationally and in each state for every candidate combination that has been polled at the state level. In addition, comparisons of the best polled candidate combinations both nationally and each in each state are available. All charts above are clickable to go to the current version of the detail page the chart is from, which may contain more up to date information than the snapshots on this page, which were current as of the time of this post.
Today I added results from PPP’s latest polling of North Carolina to my database. They polled 11 different candidate combinations, but only one of these resulted in a significant change to one of the five best polled candidate combinations. So lets hit that quickly:
Clinton vs Huckabee
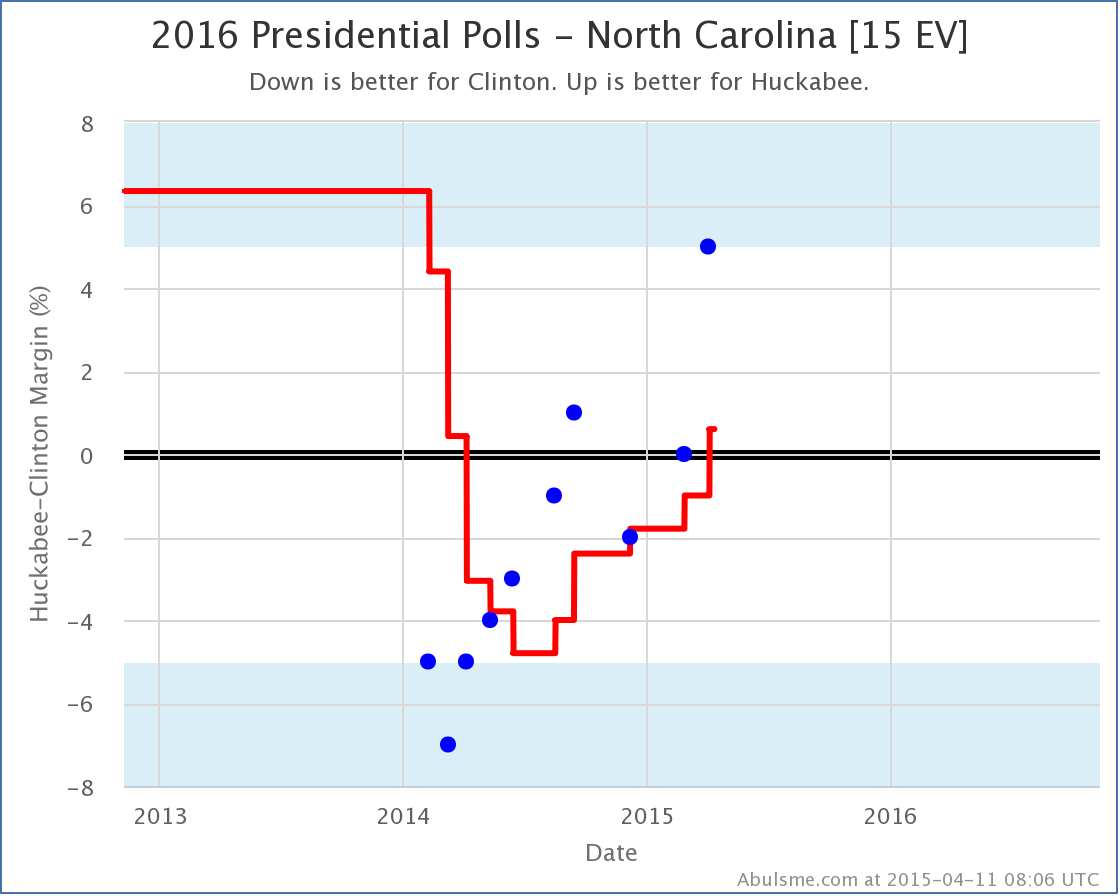
Yup, that newest poll may or may not prove to be an outlier, but that looks like a real trend, with Huckabee gaining a lot of ground vs Clinton over the last year, and now Huckabee takes the lead, just barely. This changes Huckabee’s expected result vs Clinton:
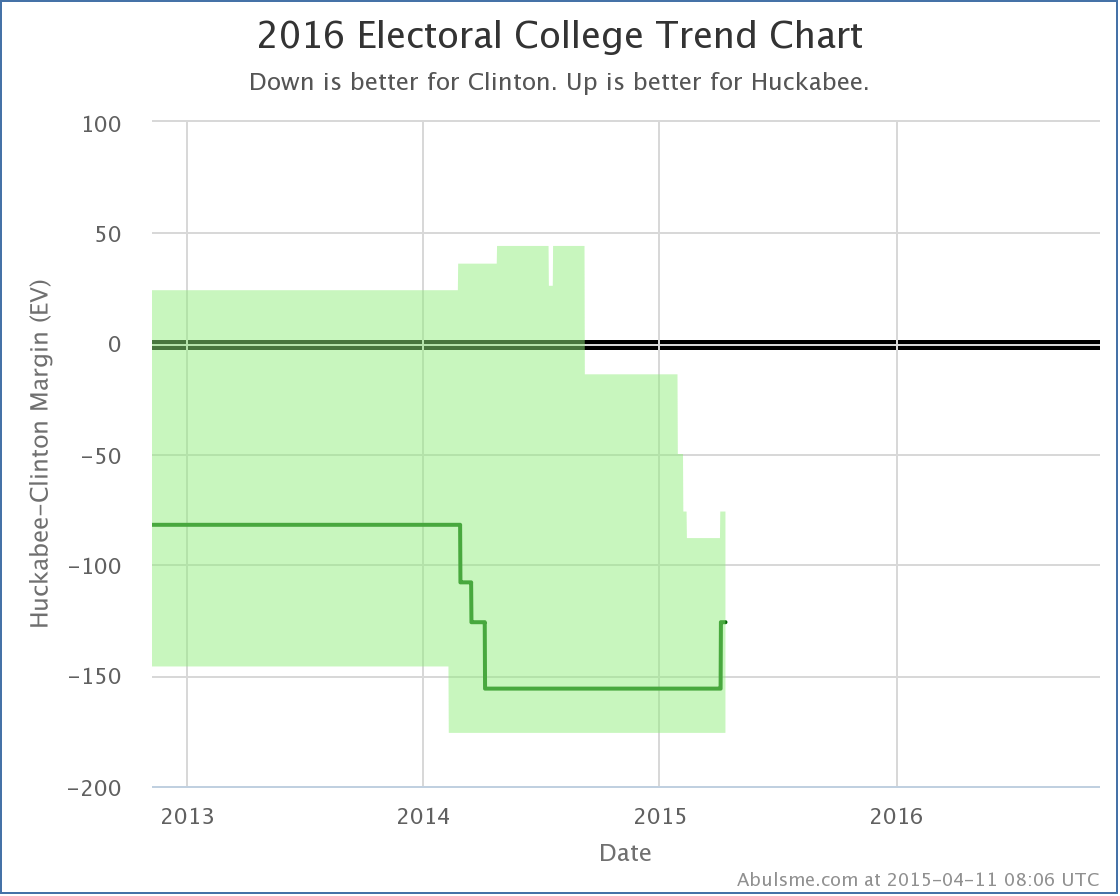
Huckabee’s “expected” result where he wins all of the states he is ahead in is now to lose to Clinton by 332 to 206… losing by 126 electoral votes… which is exactly the same as Romney’s loss to Obama. Right now, looking at the five best polled candidate combinations, Bush and Paul both do better than this, with Bush losing by 98 electoral votes and Paul losing by 108. Christie on the other hand does worse, losing by 156. But what about the 5th candidate combination? This brings up the other big news of the day, namely, the debut of Clinton vs Walker in my “Top 5”.
Clinton vs Walker
The new batch of polling added today causes a big improvement for Clinton vs Walker in my metric to measure polling quality. There is plenty to quibble with on how I construct this metric, namely that it might be overly sensitive to the situation in states that are VERY close in the poll averages, and I second guess it myself all the time, but it is “good enough” for these purposes. With today’s update, Clinton vs Walker jumps past Clinton vs Cruz, Clinton vs Rubio and Clinton vs Ryan to take the #5 spot in my top five ranking.
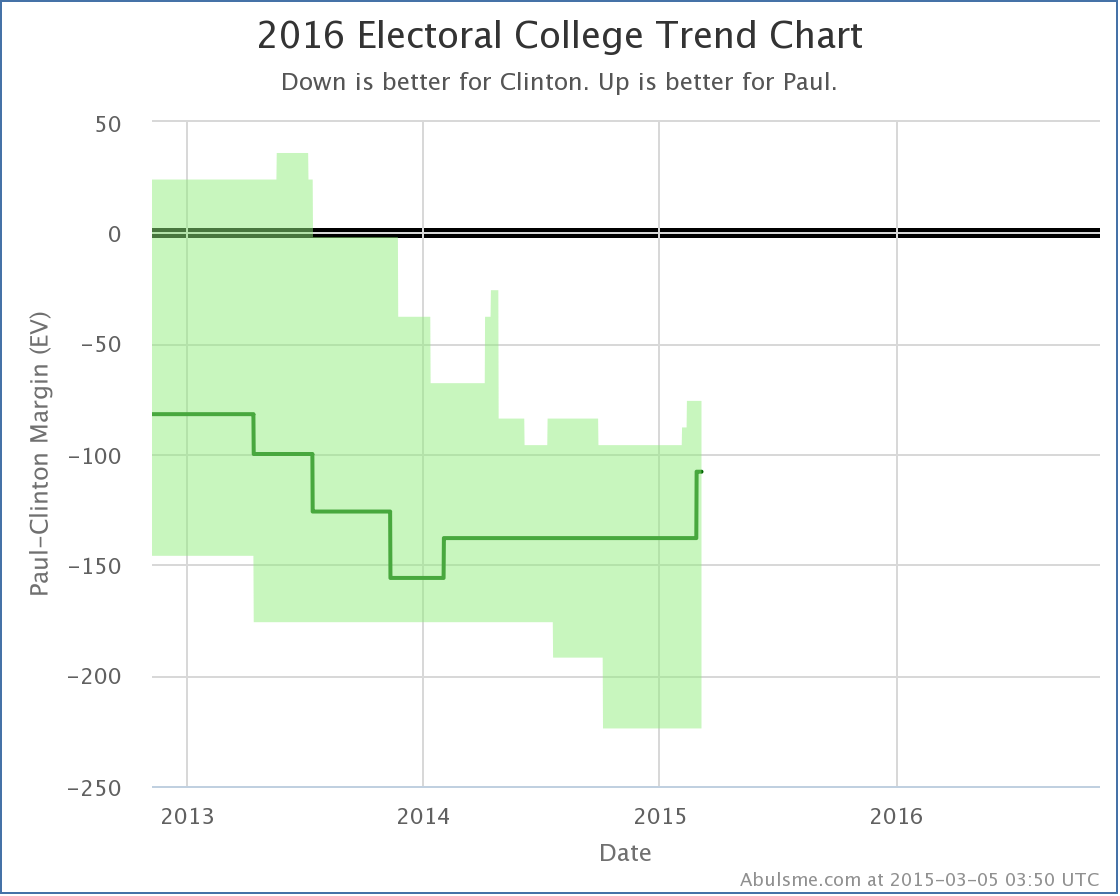
Looking at the historical trend charts for Clinton vs Walker wouldn’t really tell us too much. At this point those don’t really show real “trends” they just show the process of slowly getting enough polling to show where Clinton vs Walker really is, rather than having the map based mostly on the average of the 1996-2012 elections. So instead lets just look at a snapshot of NOW:
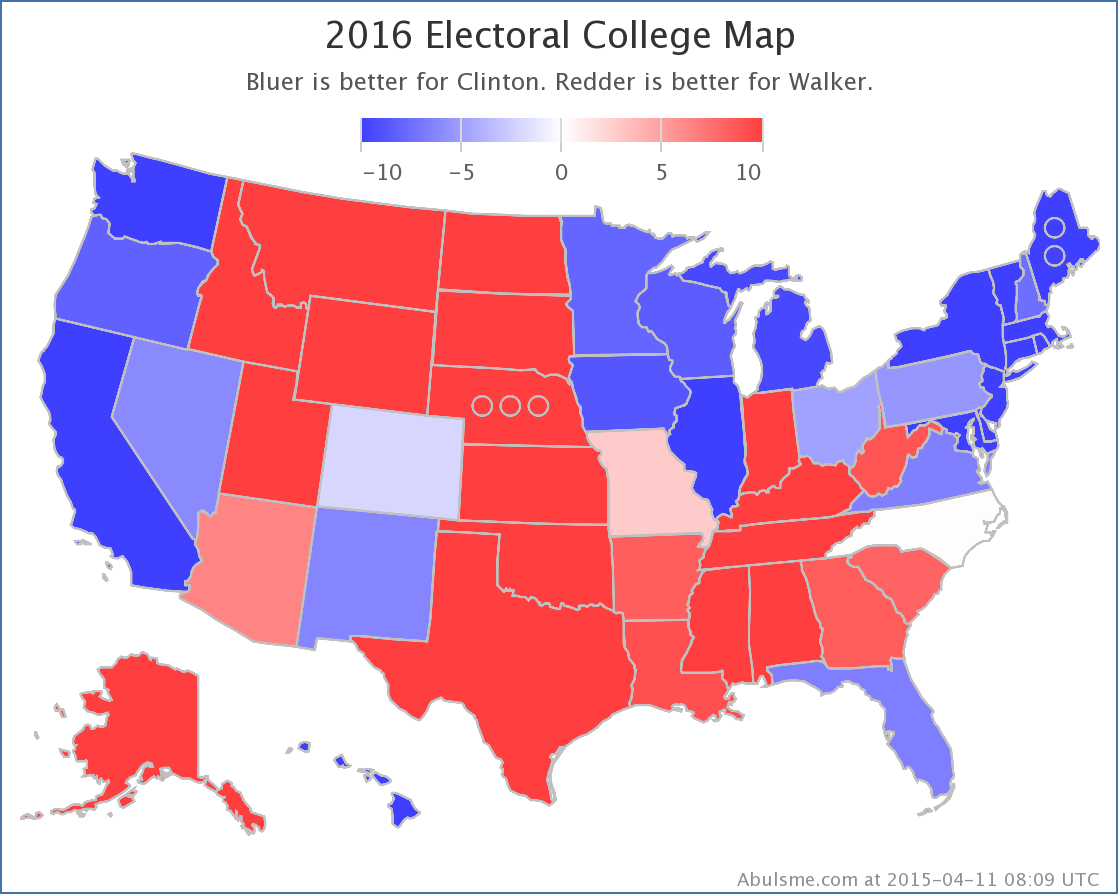 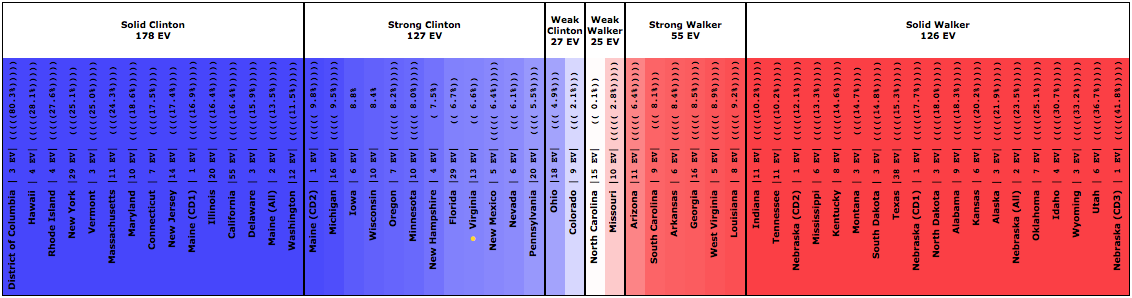 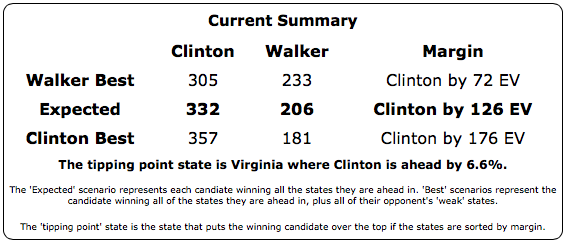
So where does Walker start out? 332-206. Matching the Obama vs Romney result. Matching Huckabee. Not doing as well as Bush or Paul, but not as badly as Christie. At least in terms of the “Expected” result.
Now, even though Walker makes it on to the Top 5 best polled list, that doesn’t mean polling is super robust. Only two states (Iowa and Wisconsin) actually have more than the five polls I usually use in my averages, and they aren’t even close states. (Hillary is ahead by over 8% in both.) Every other state is still relying to some degree on the results in the 1996-2012 elections to provide a baseline in the absence of actual Clinton vs Walker polls. Sixteen states have at least one Clinton vs Walker poll though, and a good number of those have several polls at this point, so we have enough to start paying attention.
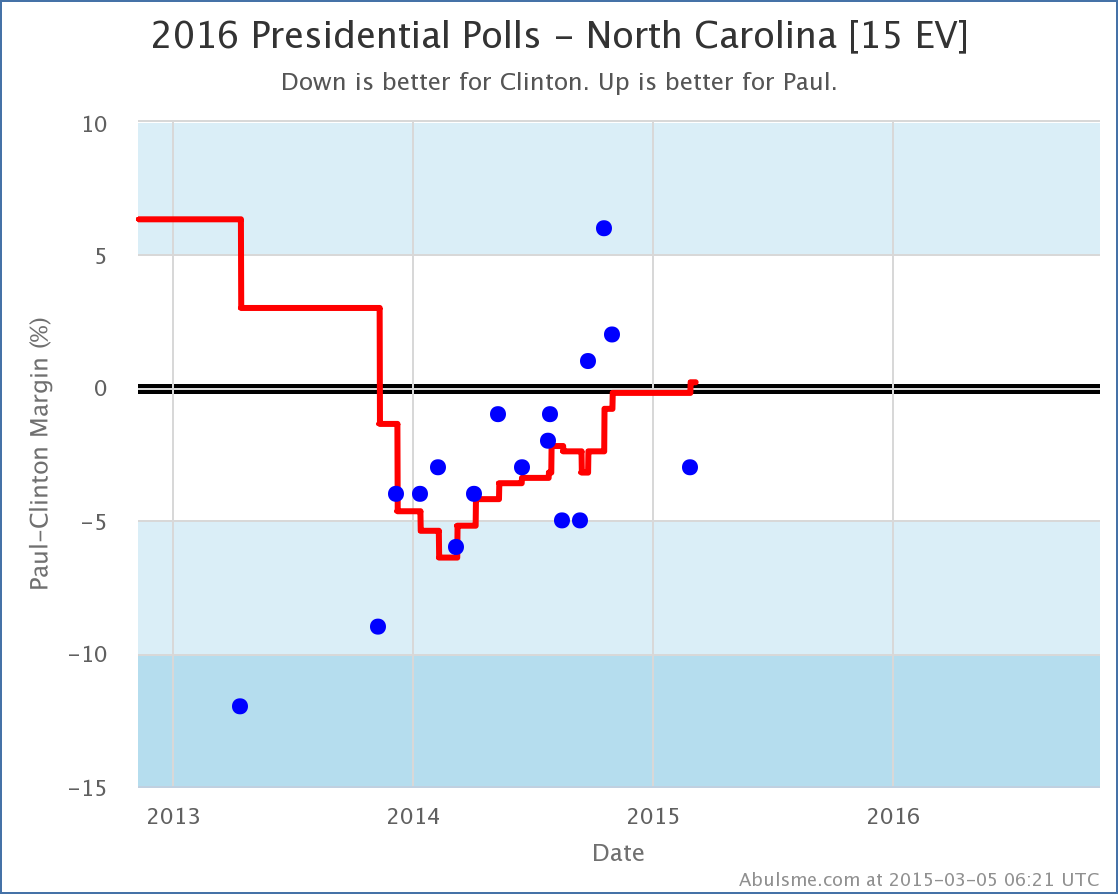
On Walker’s map right now there are only four “close” states: Ohio, Colorado, North Carolina and Missouri. The current “shortest path” to a Walker win is for him to win those four states, plus pull Pennsylvania, Nevada, New Mexico and Virginia over from the “Strong Clinton” category, first into contention as a close state, and then over to his side. The tipping point is Virginia, where Clinton’s lead is currently 6.6%.
6.6% seems like a pretty big lead. But the events of a long campaign can and do erase leads like that. Remember the crucial point that this far out polls are NOT predictive of the final result, instead, they essentially just show how much work the losing candidate needs to do (or how much the leading candidate needs to screw up) in order to flip the result. Another way of looking at a 6.6% lead is that 3.3% of people need to change their minds. Or the undecided need to break strongly in favor of the challenger. (My model just looks at the margin between the polling of the two candidates, and doesn’t take into account the size of the undecided pool at all.) In that context, 3.3% doesn’t seem quite as formidable.
Clinton has a strong lead here. Catching up and winning will take some hard work or good luck for Walker. But it is certainly possible. 577 days is a long time.
Note: This post is an update based on the data on my 2016 Electoral College Analysis Site. All of the charts and graphs seen here are from that site. Graphs, charts and raw data can be found there for the race nationally and in each state for every candidate combination that has been polled at the state level. In addition, comparisons of the best polled candidate combinations both nationally and each in each state are available. All charts above are clickable to go to the current version of the detail page the chart is from, which may contain more up to date information than the snapshots on this page, which were current as of the time of this post.
Today’s poll update consisted entirely of a new release of North Carolina data from PPP. They polled 11 different candidate combinations for 2016. Only one of these caused a category change for one of the top five “best polled” candidate pairs. That would be Clinton vs Paul:
Although the most recent poll has Paul behind by 3%, the poll it replaces in the average had Paul behind by 5%, so the average moves from an 0.2% Clinton lead to an 0.2% Paul lead.
Now, to be clear, just barely on one side of the line vs just barely on the other side of the line, either way this is about as close to a tie as you can get. (Especially since the way I calculate polling averages actually doesn’t allow ties, since it will pull in older polls to break any ties that might otherwise come up.)
The spread of the last five polls is from Clinton by 5% to Paul by 6%, so there is a lot of uncertainty here too. Basically, North Carolina is a toss up. But that’s what being “Weak” means in my model anyway. We allow the state to swing from side to side in calculating the range of possible outcomes.
But for now, this does push the “Expected Margin” in Paul’s direction:
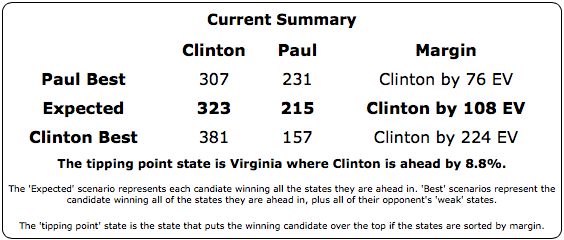
Still way behind to be sure, but every change in the Clinton vs Paul margin range numbers in the last few months has been in Paul’s direction.
Bush, Christie and Huckabee were also in this latest batch of North Carolina polls, so lets look quickly at the comparison chart as well:
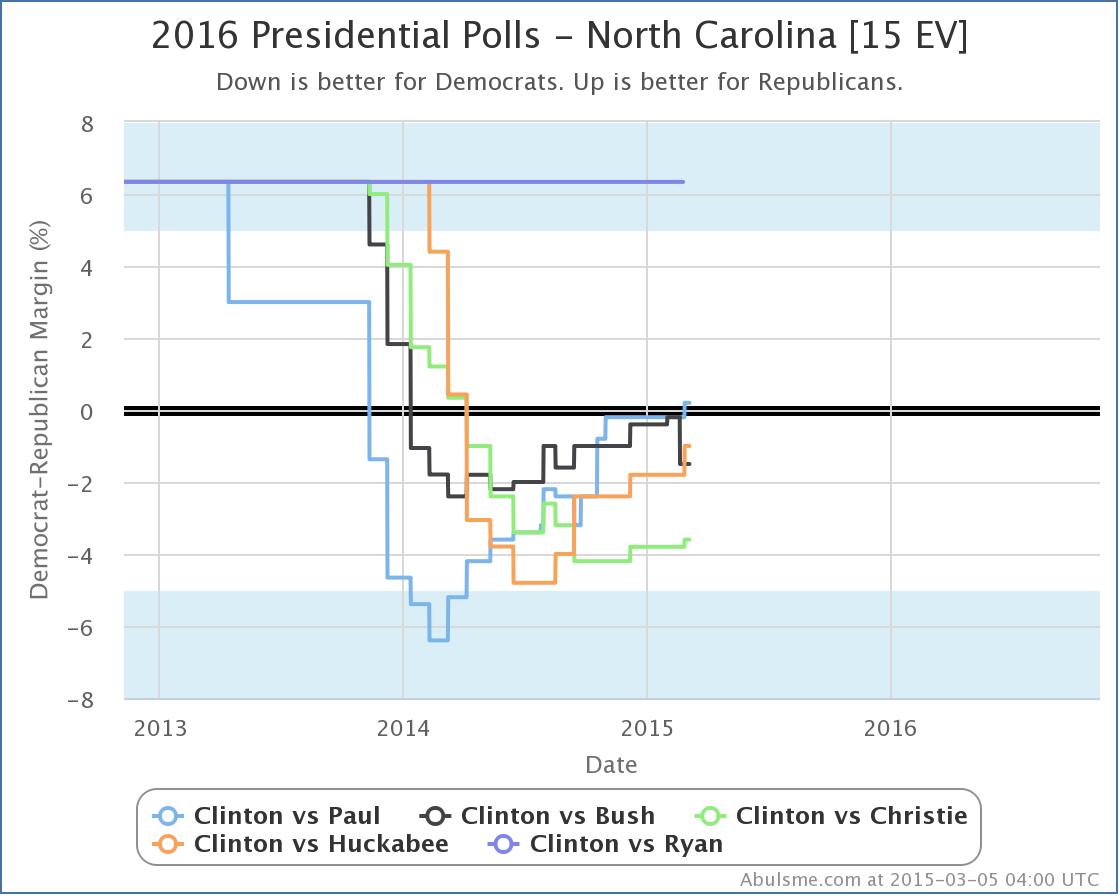
Ignore Clinton vs Ryan, which has never been polled in North Carolina.
All of the candidates have been improving against Clinton in the last few months. Paul is just the first to flip the state. Bush was very close, but the last two polls including him didn’t go his way, so he pulled back a bit. But even Christie looks like he may have bottomed out and is now improving again. In North Carolina at least, the trend seems to be away from Clinton and toward the various Republican contenders.
As usual though, the usual caveats apply on how sparse polling still is, just how far away from the election we still are, and how the very next poll may change the trend.
Final thing to mention, with today’s new data Clinton vs Huckabee passed Clinton vs Ryan to take the #4 spot in my “Top 5 best polled” list. Given that Ryan has said he is not going to run, it probably won’t be that long until he drops off the top 5. Cruz, Rubio and Walker (all vs Clinton) have all gotten recent polling attention that is improving their polling situation. Given all the recent attention, my bet would be on Walker, even though of this bunch he is currently furthest behind in my polling quality metric, but we shall see…
Note: This post is an update based on the data on my 2016 Electoral College Analysis Site. All of the charts and graphs seen here are from that site. Graphs, charts and raw data can be found there for the race nationally and in each state for every candidate combination that has been polled at the state level. In addition, comparisons of the best polled candidate combinations both nationally and each in each state are available. All charts above are clickable to go to the current version of the detail page the chart is from, which may contain more up to date information than the snapshots on this page, which were current as of the time of this post.
Some new polling was added today from PPP in North Carolina. It didn’t change the status of any state for any of the top five “best polled” candidates, nor did it change the tipping points for any of those. However, it did move Clinton vs Bush ahead of Clinton vs Paul in the metric I use to measure how good the polling is for the various candidate combinations. This means that Clinton vs Bush is now the default view when you go to election2016.abulsme.com.
Now, this does NOT necessarily mean that Clinton and Bush are the front runners in their respective primary races… although there is a strong argument that they are… it just means that there is currently better state by state polling data for this particular combination than any of the others.
Given this, I thought a quick overview of the Clinton vs Bush combination was in order.
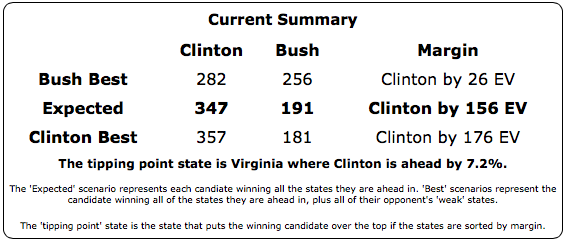
So, as with all the other “top five” Republicans against Clinton, Bush is behind, even in the “Best Case” where you give him all of Clinton’s weak states.
But, unlike some of the others, Bush’s “best case” has been steadily improving since last spring.
And while it hasn’t happened yet, there are two states right on the verge of flipping and improving his expected case as well…
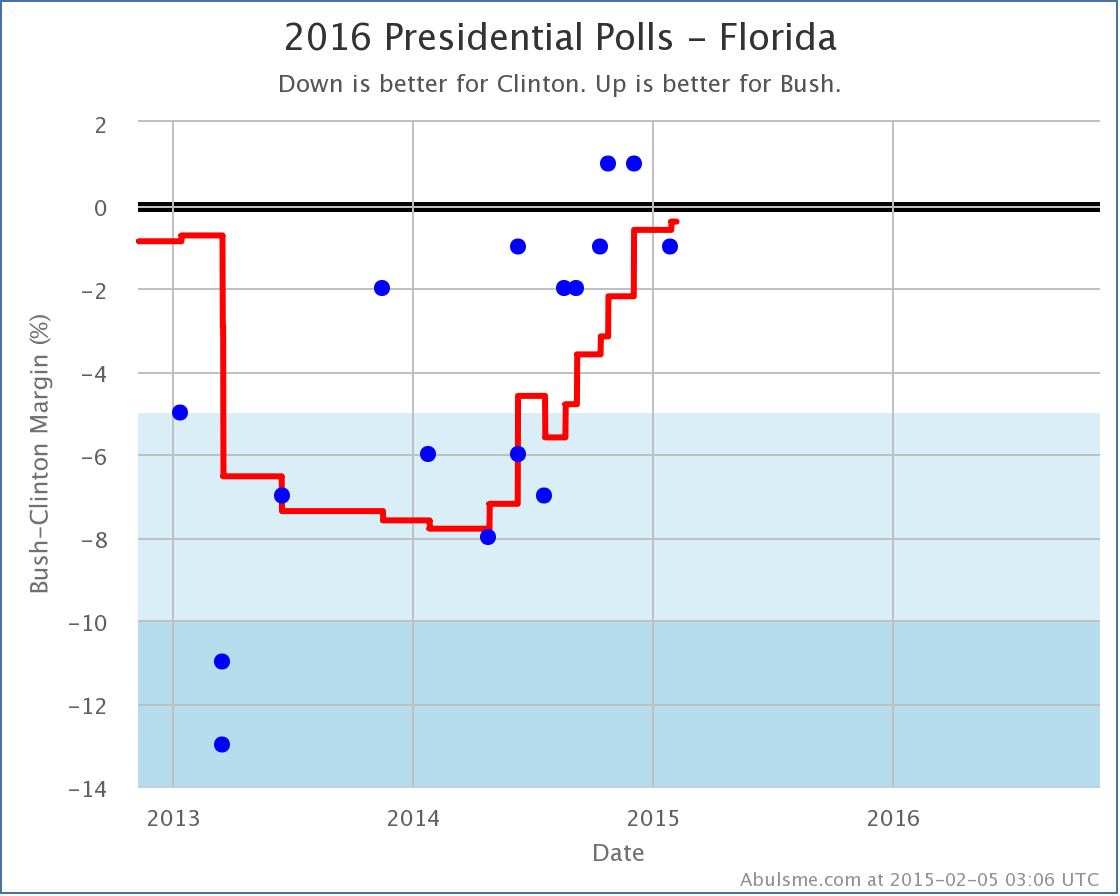
Florida, with 29 electoral votes, considered by many a “must win” for any Republican path to victory, has been trending strongly away from Clinton and toward Bush since bottoming out in the first part of 2014. Currently Clinton’s lead is 0.4% in my average. One more good poll for Bush, and Florida will move into his column.
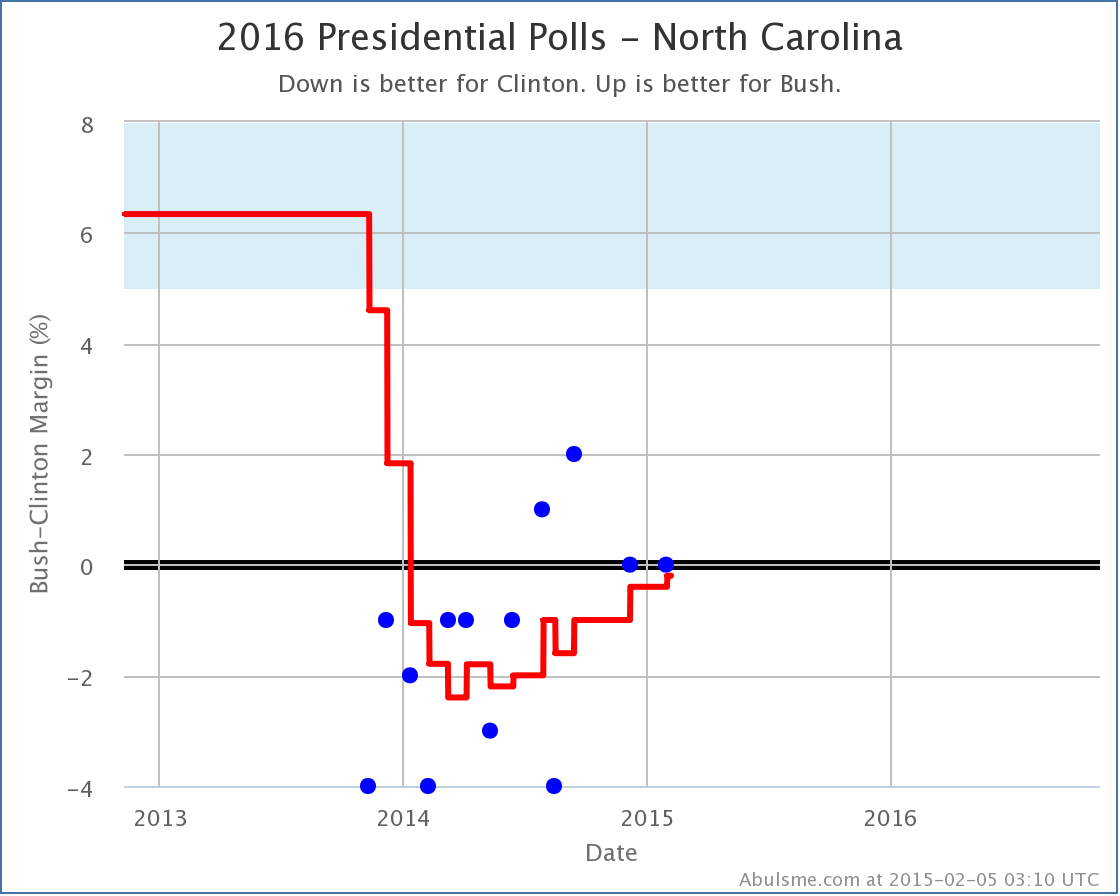
Ditto with North Carolina with 15 electoral votes, where Clinton’s lead is a minuscule 0.2%. Both these states are really neck and neck, but the trend has been in Bush’s direction in both.
Do not be surprised if these flip and Bush’s “expected case” starts moving in his direction soon.
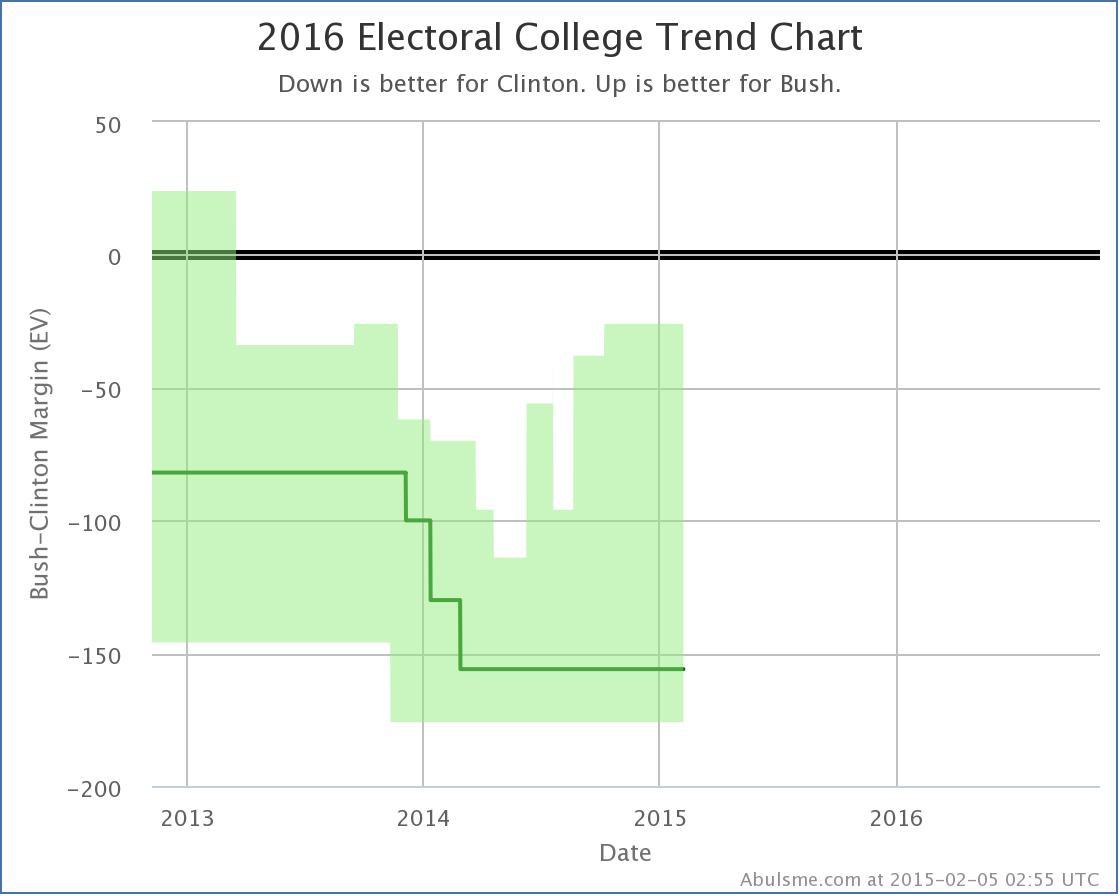
Of course, to actually win, a lot of states need to move. The “tipping point” measures this.
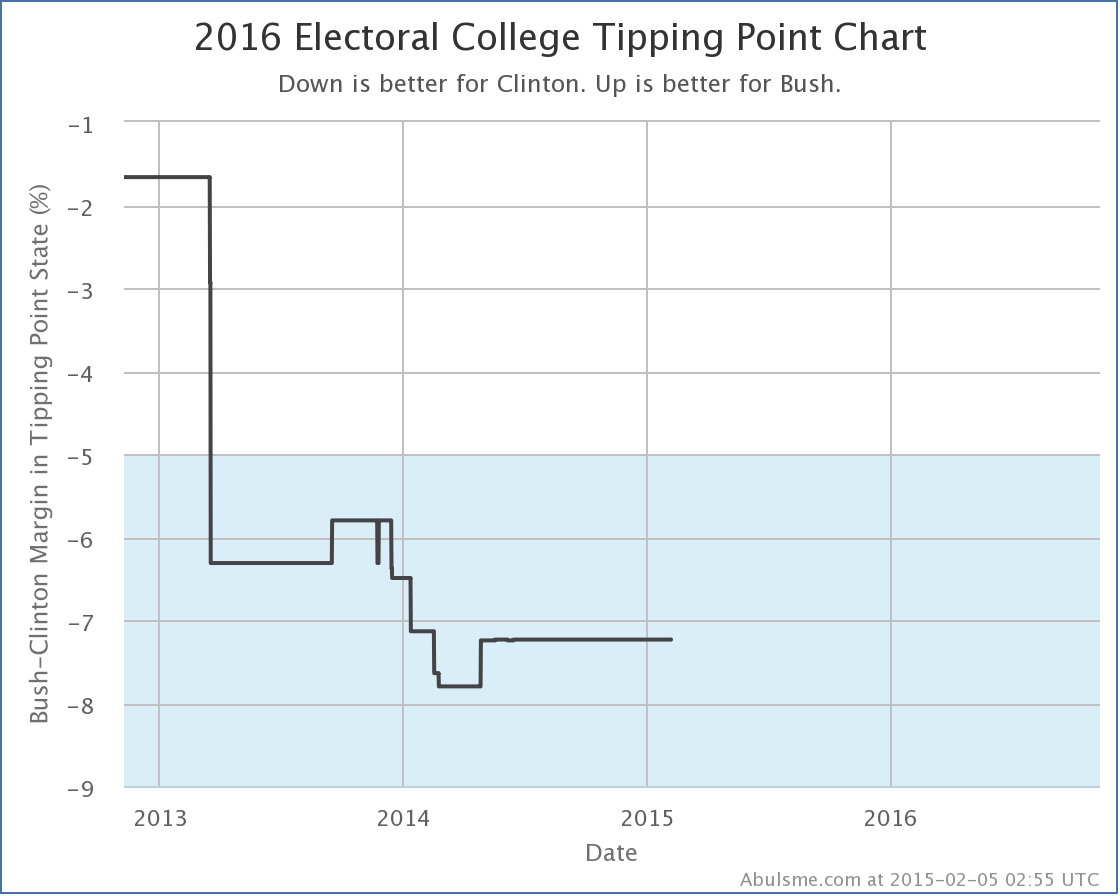
No significant movement here recently. Does this move Bush isn’t moving all the states he needs to? Maybe. But more likely, there just hasn’t been much new polling in the states near Bush’s current tipping point.
To start seeing movement in the tipping point for Clinton vs Bush, we need some new polls in states like New Hampshire (last poll in November), Wisconsin (last poll in April), Virginia (last poll in March), Minnesota (last poll in June) or Colorado (last poll in July).
The age of the polls in these states shows just how far away we still are from having a large enough volume of state level polling to have a good “real time responsive” sort of take on the situation. At this stage, polling is still slow and sparse in most states, and you have to interpret things accordingly.
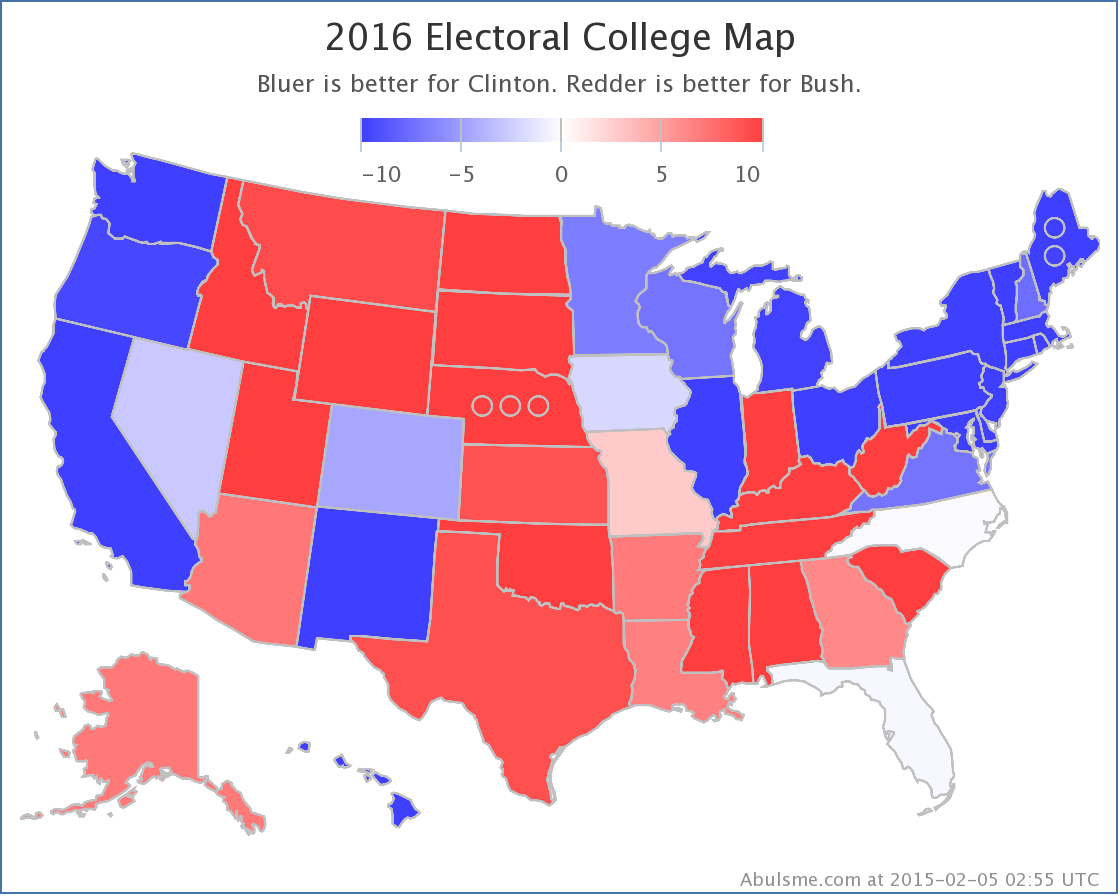
Now, you can’t give a summary without the traditional map. So here is the current Clinton vs Bush map…
And finally, here is how that looks as a spectrum of the states broken down into the various classifications:
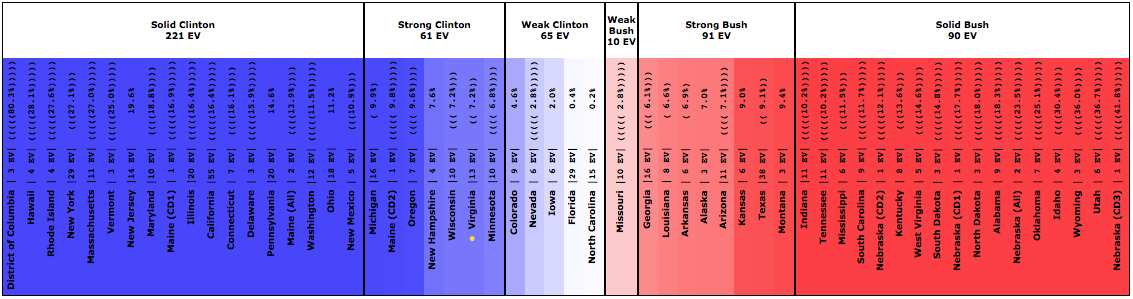
So there is our new “best polled” candidate combination… for the moment…


|
Romney |
Obama |
| Romney Best Case |
264 |
274 |
| Current Status |
206 |
332 |
| Obama Best Case |
205 |
333 |
A bunch of states were called between 04:00 UTC and 04:15 UTC:
- Obama: CA, HA, WA, WI, IA NM
- Romney: ID, MT, NC
Only one of these mattered. Iowa. Iowa was a close state. Romney needed every close state he had left in order to win. Without Iowa, even if Romney swept every other close state (and Maine’s 2nd) he would only get to 264.
When CNN called Iowa at 04:09 UTC, I called the race on twitter in these two tweets. Nine minutes later when some more states came in, CNN called the election for Obama. They were slow. More on those next states in the next update.
Anyway, Obama wins reelection!


No, this change is NOT due to Obama’s debate performance. There are not yet any state level polls that include time after the debate. We should have a few of those in a few days I’m sure. For now, this still represents what was happening pre-debate.
There was one change today, in what is currently the closest of the close states:

North Carolina has consistently been in the “close state” category all year long. It REALLY could easily go either way. With the latest data it moves from leaning just slightly Obama, to leaning just slightly Romney in the five poll average. Romney now leads by 0.8%.
Right now the next closest state is Florida, where Obama is ahead by 3.2% at the moment. If one argued that the 5% threshold I use for “close” is really too wide, you could easily conclude that North Carolina is actually the ONLY state where things are close at the moment. It really is right on the edge right now. Just about anything could move it one way or the other.
Regardless, as of right now, the five poll average has it back on Romney’s side of the line, where it has spent most of the last year. So, the new summary of the state of the race:
|
Romney |
Obama |
| Romney Best Case |
250 |
288 |
| Current Status |
206 |
332 |
| Obama Best Case |
191 |
347 |
The “current” line, where everybody gets every state they are even slightly ahead in, now reverts to a 332 to 206 Obama win. This has been where it has been more often than anywhere else over the last year. Things have sometimes moved a little from this line in one direction or the other, but it always seems to come back here.
In that sense the race has been remarkably stable. Most of the discussion I’ve presented here has ended up reflecting changes to Romney’s “best case” where he wins all of the close states. But if we only look at who is actually ahead in each state… we’re usually at a 332 to 206 Obama win.
I’ve mentioned before, if I had to pick a final state of the race right now, putting all the red and blue states on the map above in their respective columns, then giving North Carolina to Romney, and Iowa, Colorado and Florida to Obama, seems like a very safe bet.
At the moment, even if you give Romney all four of these states, he still loses 250 to 288. He needs to take the lead in Iowa, Colorado and Florida, then start making some of the “Weak Obama” states close again.
Romney had a very strong performance in the first debate, and Obama had a very weak one. But will that make a difference here? Study after study have shown that historically the effect of debates is very small. There are just too many voters who have already made up their minds and nothing in any debate short of a complete meltdown by one of the candidates will change that. I think that is likely to be the case here too.
I would not be surprised to see some tightening. Some of the “Weak Obama” states are just barely in that category. They could easily move back into my “Lean Obama” category. But Romney needs very big moves to start actually moving states onto his side of the line. Not just a point or two. Florida needs more than a 3% shift to move to Romney. To get enough states back on his side with a uniform shift he has to move things more like 6% or 7%. That would be a huge move.
I don’t think you will see that kind of move coming out of this debate alone. It is much more likely that we’ll see a small move. I think Romney’s beginning of September position, which was a closer race, but one which Romney was still losing, represents a cap on the gains Romney is likely to make. It will be very hard to Romney to break through that ceiling.
But, if from now until election day, the electorate sees the bold confidant and actually somewhat centrist Romney they saw last night, and they continue to see the nervous, hesitant, submissive Obama they saw last night… then we may start to see a bigger shift than would come out of just the debate alone.
I think it is a pretty safe bet the Obama campaign will be doing everything they can to present a different Obama next time out though. He knows he screwed up, he knows what he screwed up, and it is mostly about optics rather than substance, so they will try to fix it.
It has been the situation for quite some time that there wasn’t a huge amount Romney could directly do to help his position in the race, but that Obama had plenty he could do to damage his own position. Obama made that kind of mistake last night. Romney now has an opening, and for almost the first time in this race, Obama is on defense.
Note: Chart and map from the Abulsme.com 2012 Electoral College Prediction page. Both assume Obama vs Romney with no strong third party candidate and show polling as it currently exists. Things will change before election day. On the map red is Romney, blue is Obama, gold states are too close to call. Lines on the chart represent how many more electoral votes a candidate would have than is needed to tie under several different scenarios. Up is good for Obama, Down is good for Romney.
Important note added 2012 Oct 5 16:36 UTC: Virginia should also have changed from Weak Obama to Lean Obama in this update. I had the polls. The numbers were there in my spreadsheet, I just completely failed to notice. I will be including the Virginia change in the Friday update and talking about it there.
 
Big day, lots of changes in polls behind the scenes aided by the fact I’ve now added PollTracker as a source. They seem to be picking up and including some polls left out by my other sources. The big batch of new polls today led to three category changes. So lets get to them in order of electoral college size from small to large:

First up, South Dakota with 3 electoral votes. It has been very sparsely polled, but it is easy to see why. This state is not even remotely in contention. It is a Romney state. Back in August a new poll had brought the five poll average down to a Romney lead of less than 10%, moving it to “Weak Romney” instead of “Strong Romney”. Now the first poll since then moves it back to “Strong Romney”. Either way, South Dakota is not a state we imagine Obama winning even in his best possible scenario.

Next up is Virginia with 13 electoral votes. On Thursday Obama’s lead in the state tipped just barely over 5%. With a new poll today, it dips back just barely below 5%. So once again it goes into my “Lean Obama” category and it is once again considered one of the states Romney *could* win, even though he is currently behind in the state. So this improves Romney’s best case and opens up more possible “paths to victory” that one can mathematically imagine given the polling.

Finally, North Carolina with 15 electoral votes. Never once in the last year has this state not been “close”. Most of the time it has leaned toward Romney though, with just a few bounces toward Obama. Today’s batch of new polls are all favorable to Obama though, and the five poll average tips toward Obama, barely, at a 0.8% lead for Obama.
Now, there is some oddness in how I count polls here. When a poll includes results in more than one way (Likely Votes vs Registered, or with our without Leaners) rather than picking one version of the poll based on some criteria I make up, I count those as separate polls if they are reported differently by the sources I use. This will potentially overweight the one poll with multiple reports. I count on this effect being washed out over time. This state is close enough that it can make a difference though.
But the difference is between just barely leaning one way, and just barely leaning the other way. These two situations are barely distinguishable from each other. So, for instance, in the case of North Carolina, while the new polls tip the state over the center line, it should be kept front of mind that a 0.8% lead is NOTHING and is close enough that it can easily just be statistical or methodological noise, and even if it isn’t, is close enough it can be wiped out overnight by the events in a news cycle.
So while this does move the “everybody gets every state they are ahead in” line in my models, do keep in mind that ALL of the “close” states should be considered to be states that easily could go either way.
So, with all of these, the new model summary:
|
Romney |
Obama |
| Romney Best Case |
291 |
247 |
| Current Status |
191 |
347 |
| Obama Best Case |
180 |
358 |
With this the “Current Status” where everybody gets every state they are ahead in is back up to matching Obama’s previous highs in April and May. Even with Obama’s best case, he isn’t matching his 2008 performance. But he is at what has so far been his ceiling in this race. To move beyond this he needs to start pulling ahead in states like Tennessee, Georgia, Arizona, Indiana, Missouri, South Carolina and Montana. All of these have so far seemed way out of reach this time around. And they still do. We would need a major Romney collapse to start bringing these states over to Obama.
As I said though, this lead in North Carolina is by the slimmest of margins, and is helped along slightly by my methodology. It would not be surprising at all for this to flip back to the “normal” 332 to 206 Obama victory margin we’ve been seeing most of the year in my model.
In the mean time, Virginia getting a bit closer again is good news for Romney. If he can’t bring states like Virginia back to being at least close, it is really hard to see how he pulls off a win. Having said that though, the recent trend in Virginia has been against him. We’ll need more polls (I’m sure we’ll have them soon) to know if Romney is really making Virginia close again, or if it will slip back away from him with the next batch of polls.
Note: Chart and map from the Abulsme.com 2012 Electoral College Prediction page. Both assume Obama vs Romney with no strong third party candidate and show polling as it currently exists. Things will change before election day. On the map red is Romney, blue is Obama, gold states are too close to call. Lines on the chart represent how many more electoral votes a candidate would have than is needed to tie under several different scenarios. Up is good for Obama, Down is good for Romney.
(Edited 2012 Sep 22 23:50 to add some final thoughts and do some cleanup.)


One change in this update, and for the first time in more than two weeks it is a move in Obama’s direction.

The state that moves this time is indeed Missouri (10 ev), the location of the recent dustup about comments made by Todd Akin. Could some of that be spilling into the presidential poll numbers? Well, I’d be reluctant to say that quite yet. Two of the five polls in the five poll average were taken after the incident last weekend. A PPP poll on the 20th showed Romney up 10% in Missouri. Then a Rasmussen poll on the 22nd showed Obama up 1%. Now, perhaps that was real movement caused by the coverage going on in those days. Or not. The two polls are just not enough to get a good grasp on that.
The addition of the latest poll does drop Romney’s lead in the state in my average to 3.6% though, which is enough to call the state close again. While Obama is still behind here, it is now close enough that putting some effort into trying to win it doesn’t seem completely unreasonable. Having said that, despite a few scattered polls showing Obama leads, Obama has never been ahead here in the five poll average. Obama winning Missouri is unlikely absent large moves nationally pushing toward an Obama landslide.
This does improve what I call Obama’s “best case”:
|
Romney |
Obama |
| Romney Best Case |
317 |
221 |
| Current Status |
235 |
303 |
| Obama Best Case |
170 |
368 |
Obama’s best case now actually exceeds his 2008 results (a 365 to 173 victory). This would require a sweep of all of the close states though, including the ones he is behind in at the moment. That would be Florida (29 ev), North Carolina (15 ev), Tennessee (11 ev) and Missouri (10 ev). In the five poll average at the moment, Romney is ahead by 3.5% in Florida, 0.6% in North Carolina, 4.2% in Tennessee and 3.6% in Missouri.
I’ve always said that a lead less than 5% can disappear overnight with the right events in the news, but still, it is hard to imagine at the moment the kind of news that would get Obama all four of these states.
Florida has bounced back and forth all year. It is easy to imagine it going either way.
North Carolina is more of a stretch. Obama has sometimes been in the lead there, but most of the time Romney has been. But maybe if things go very well for Obama he will manage North Carolina.
Tennessee and Missouri though? Obama has never been ahead in those states. Obama taking leads in either states would be indicative of a huge Romney collapse.
The Republican convention is starting in a few days though. So don’t expect many moves in Obama’s direction in the short term. Unless the convention is a huge disaster, it is much more likely we see more movement toward Romney from now until the Democratic Convention gets under way.
Note: Chart and map from the Abulsme.com 2012 Electoral College Prediction page. Both assume Obama vs Romney with no strong third party candidate and show polling as it currently exists. Things will change before election day. On the map red is Romney, blue is Obama, gold states are too close to call. Lines on the chart represent how many more electoral votes a candidate would have than is needed to tie under several different scenarios. Up is good for Obama, Down is good for Romney.


Chart and map from the Abulsme.com 2012 Electoral College Prediction page. Both assume Obama vs Romney with no strong third party candidate. Both show polling as it currently exists. Things will change before election day. On the map red is Romney, blue is Obama, gold states are too close to call. Lines on the chart represent how many more electoral votes a candidate would have than is needed to tie under several different scenarios. Up is good for Obama, Down is good for Romney.
One state changes status today, and it is once again a move in Romney’s direction:

Colorado has been polled less frequently than one would expect. Since April 11th I have classified it as a “Weak Obama” state as the 5 poll average has been over 5%. It now looks clear that this was mostly on the strength of one PPP poll in April showing an Obama 13 point lead which now very much looks like an outlier. With the most recent polls, Obama’s lead falls back under 5%, so I move it back to “Lean Obama” again and it is now once again considered to be a state that could go either way. This improves Romney’s “best case”.
|
Romney |
Obama |
| Romney Best Case |
278 |
260 |
| Current Status |
206 |
332 |
| Obama Best Case |
159 |
379 |
This move opens up some additional paths to victory for Romney. He can now afford to lose Iowa (6) if he wins the rest of the swing states. Or he can win Iowa (6) and lose Colorado (9) and still tie 269-269 and pull out a win in the House. But Florida (29), Ohio (18), North Carolina (15), Arizona (11), Tennessee (11), Missouri (10), and Wisconsin (10) are all still must win states. If Romney loses any one of them, he loses the election.
And now, as I continue to go through data provided by Darryl at HorsesAss I have another correction to the old historical time series. In this case I was missing an old North Carolina poll from last September. This changed North Carolina’s status at the very beginning of the year from very slightly leaning Obama to very slightly leaning Romney.
The old timeline had been:
- Jan 1 -> Jan 12: Lean Obama
- Jan 12 -> Apr 12: Lean Romney
- Apr 12 -> Apr 14: Lean Obama
- Apr 14 -> May 2: Lean Romney
- May 2 -> May 18: Lean Obama
- May 18 -> Present: Lean Romney
Now it is simply:
- Jan 1 -> Apr 12: Lean Romney
- Apr 12 -> Apr 14: Lean Obama
- Apr 14 -> May 2: Lean Romney
- May 2 -> May 18: Lean Obama
- May 18 -> Present: Lean Romney
This only changes what the status should have been at the very beginning of the year. Current status remains the same. The historical chart is corrected starting with today’s update. It is important to note that regardless of the flips back and forth from leaning one way to leaning the other way, North Carolina has been in the “swing state” status the whole time… it is just plain too close to call and has been the whole time.


Chart and map from the Abulsme.com 2012 Electoral College Prediction page. Both assume Obama vs Romney with no strong third party candidate. Both show polling as it currently exists. Things will change before election day. On the map red is Romney, blue is Obama, gold states are too close to call. Lines on the chart represent how many more electoral votes a candidate would have than is needed to tie under several different scenarios. Up is good for Obama, Down is good for Romney.
One state changes status today:

North Carolina moves from Obama up by 2.0% to Romney up by 0.6%. Either way, this is too close to call. North Carolina remains a swing state. Now, the latest poll actually has Romney ahead by 8%. This might be the start of a larger move toward Romney. Or maybe it is an outlier. It is too early to tell. For now, North Carolina is now a swing state that leans ever so slightly to Romney.
Since North Carolina remains too close to call, this doesn’t change either candidate’s best case scenarios, which represent the range of reasonably possible results based on current state polling. The current line drops a nice ways in Romney’s direction though.
|
Romney |
Obama |
| Romney Best Case |
276 |
262 |
| Current Status |
235 |
303 |
| Obama Best Case |
170 |
368 |
Glancing at the chart, it looks like there has been a nice move in Romney’s direction lately. Lets look at some specific numbers and compare to one month ago. One month ago was the first time that the state polls showed Romney’s best case being to lose. Things clearly look much better for him today.
On April 18th, Romney’s best case showed him losing 260 to 278. Now he wins 276 to 262. He has moved 16 electoral votes (net) back into contention that a month ago seemed out of reach.
On the current line, a month ago Obama was winning 328 to 210. Now he is only winning by 303 to 235. Over the last month Romney has pulled a full 25 electoral votes (net) over the line toward him.
As for Obama’s best case… no change. The needle hasn’t moved at all. Obama hasn’t managed to pull more electoral votes into being competitive, nor have any moved out of reach.
So the movement has definitely been in Romney’s direction. If he keeps it up, we’ll start to see the map looking much more competitive soon.
By comparison, look at 4 years ago… the two best cases were much more symmetric around the tie line. The candidates were more evenly matched and the range of possibilities was not really favoring either candidate. It was clearly a wide open race four years ago. Having a lot more swing states helped.
The “current” status looked very similar to today’s though… we had McCain 302, Obama 236. Reverse the parties, and we are almost exactly in the same place we are today. Of course McCain did not go on to win. One should look at Obama’s current lead in the model with that in mind. There is still a long time until November.
Edit 2012 May 20 06:39 UTC – Fixed Map, SC was incorrectly colored as a swing state, it is now correctly colored as “Weak Romney”.
|
|


