This is the website of Abulsme Noibatno Itramne (also known as Sam Minter).
Posts here are rare these days. For current stuff, follow me on Mastodon
|
If changes keep coming in at this rate, I may need to move to a once a week update format, at least until we get a bit closer to the election. In any case, with today’s batch of new polls, we get a couple of status changes in Iowa, which in turn shift the national picture a bit.
Click on any of the charts to see more detail.
Clinton vs Paul
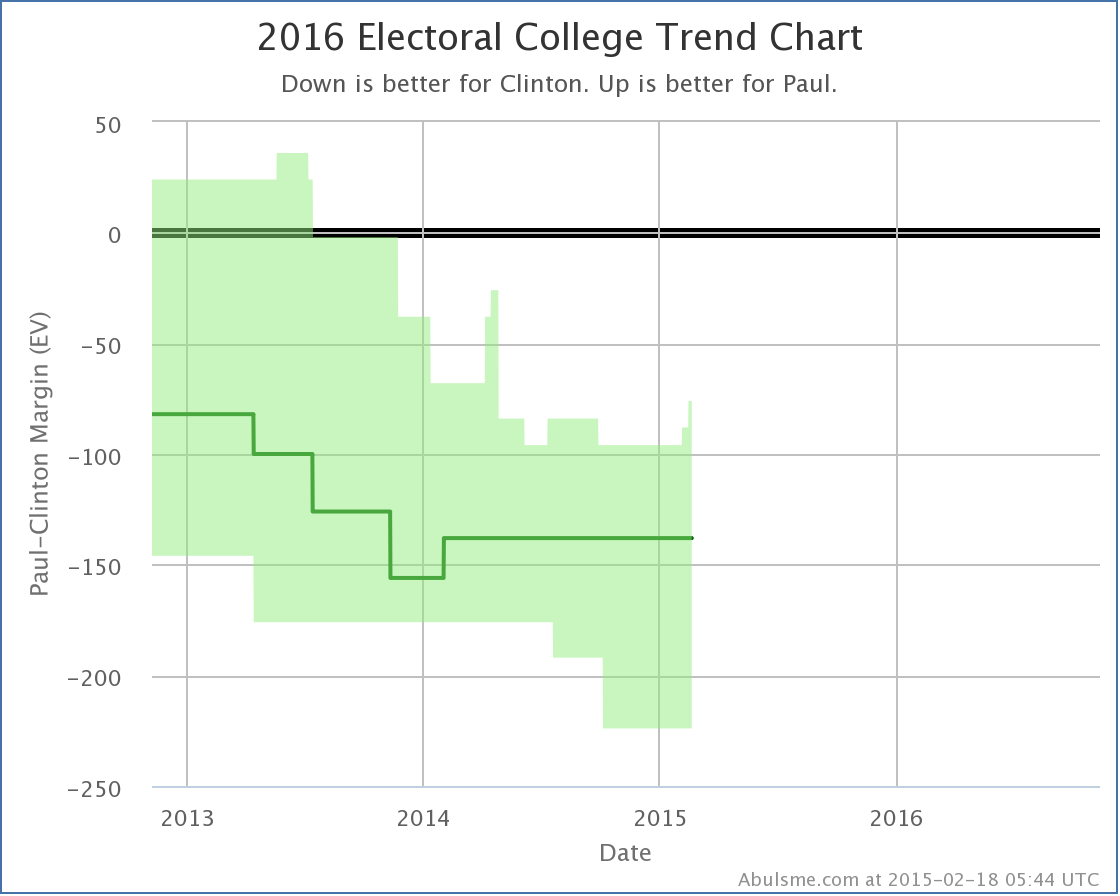
With today’s update, Iowa moves into the “Weak Clinton” zone, meaning that I consider it to be close enough to allow for the possibility of Paul winning. This improves Paul’s best case against Clinton to losing by 76 electoral votes. A couple of weeks ago, Paul’s best case was to lose by 96 electoral votes. So there does seem to be some movement here.
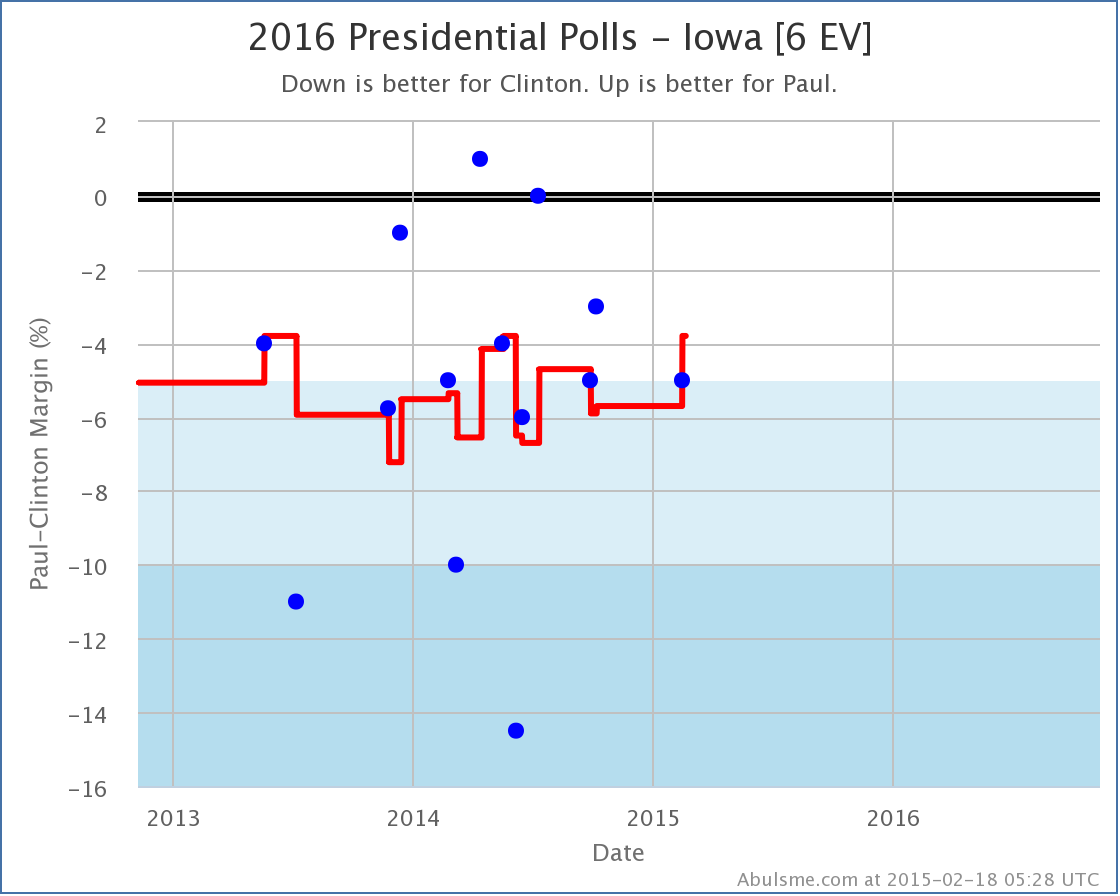
Looking at the actual polls in Iowa though, this trend is a little less clear. Iowa seems to have been bouncing back and forth over the 5% Clinton lead line for the last two years, spending more time with Clinton further ahead than 5%, but with occasional temporary movement toward Paul. Can we say that this time is a real “trend” rather than just another short term bump? Nope. Or maybe the average being further in Clinton’s direction is really just the result of a handful of outlier polls and really this “should” have been closer all along. Maybe. We’ll have to wait for more polls to see.
For now though, my charts show movement toward Paul.
Clinton vs Huckabee
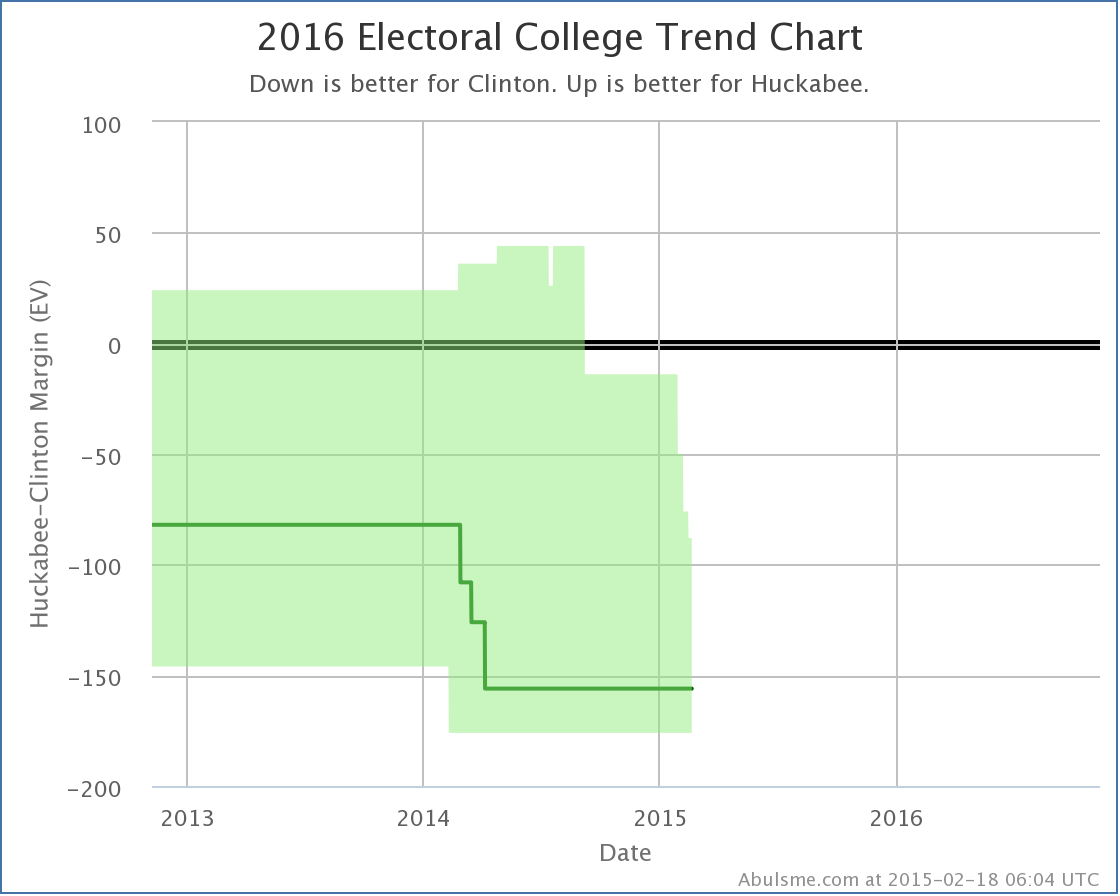
While Paul’s picture is improving, Huckabee’s continues to decline. In the latest update, Iowa slips out of Huckabee’s best case. Huckabee’s best case is now to lose to Clinton by 88 electoral votes. A month ago, his best case was losing by only 14 electoral votes, but states keep slipping away. Now, there has been a lot less Clinton vs Huckabee polling than there has been Clinton vs Paul polling, so there is a good chance a lot of this has simply been getting enough polling to get a good picture, rather than actual movement.
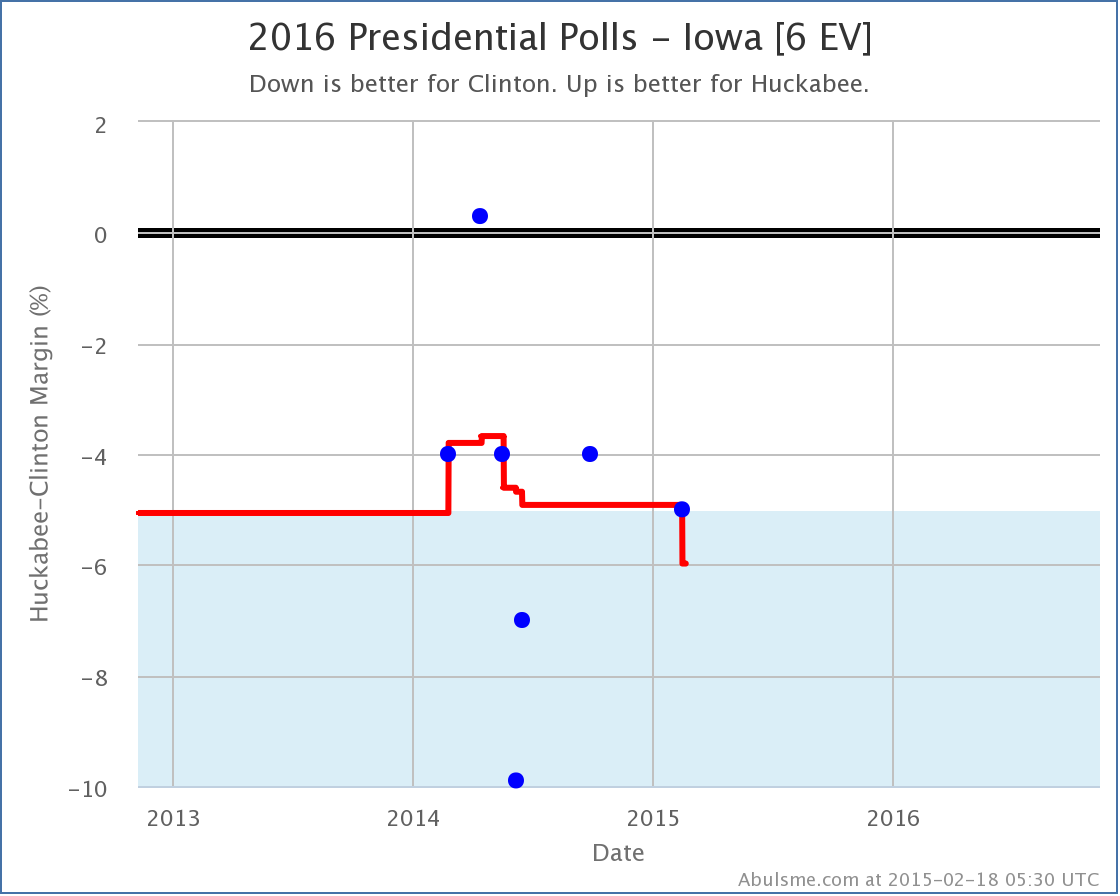
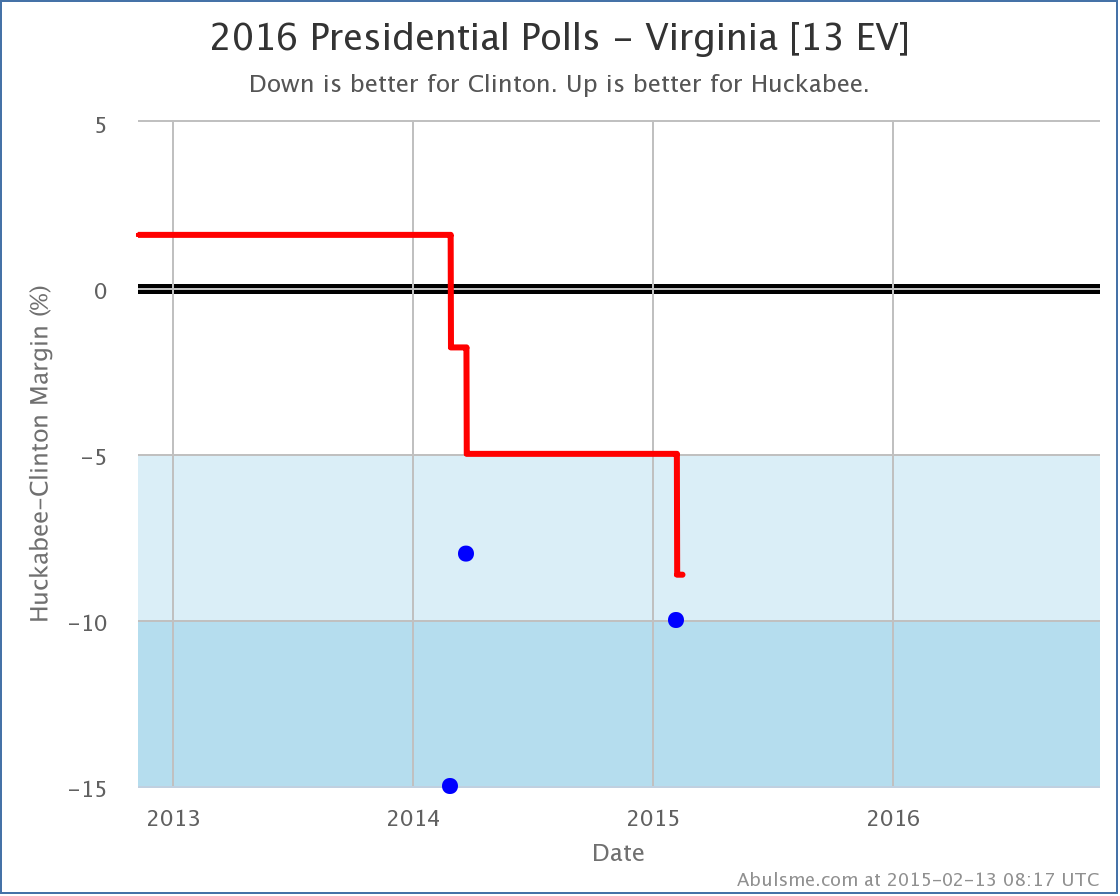
Specifically looking at the individual Iowa polls, you can see that we already did have five polls in Iowa, so the picture wasn’t dependent on previous election results, but there have only been 7 polls compared to the 14 for Clinton vs Paul. And there is quite a scatter between those polls (as there also was with Clinton vs Paul). The “movement” here is basically one extreme poll (the one showing Huckabee actually ahead in Iowa) falling out of the average, while another extreme point (the one showing Clinton ahead by 10%) remains in the average.
As with the Paul situation, it is far from clear that this is a real trend as opposed to just a temporary bump in this direction, and the next polls could change the picture again. It is well within the realm of possibility that the “real situation” for both of these candidates is that Clinton is just about 5% ahead of them, and they will just bounce back and forth between my categories as new polls come in.
Comparison
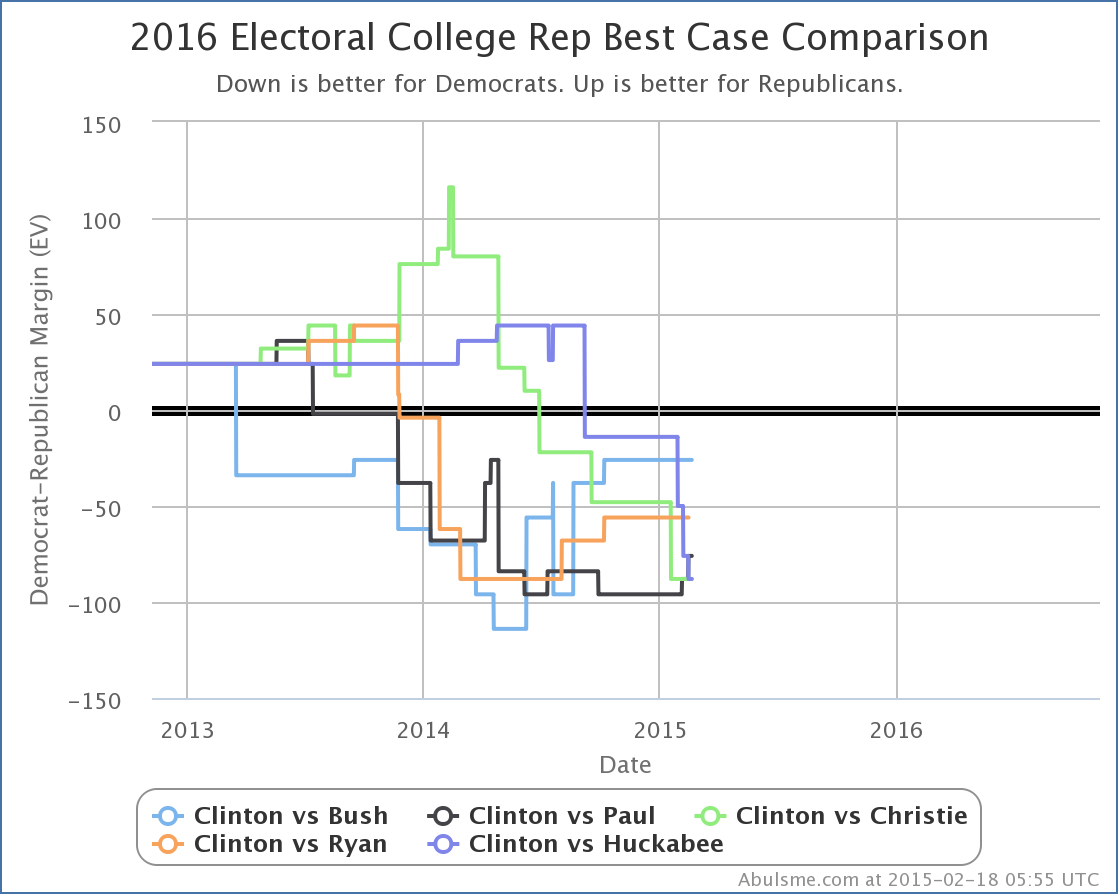
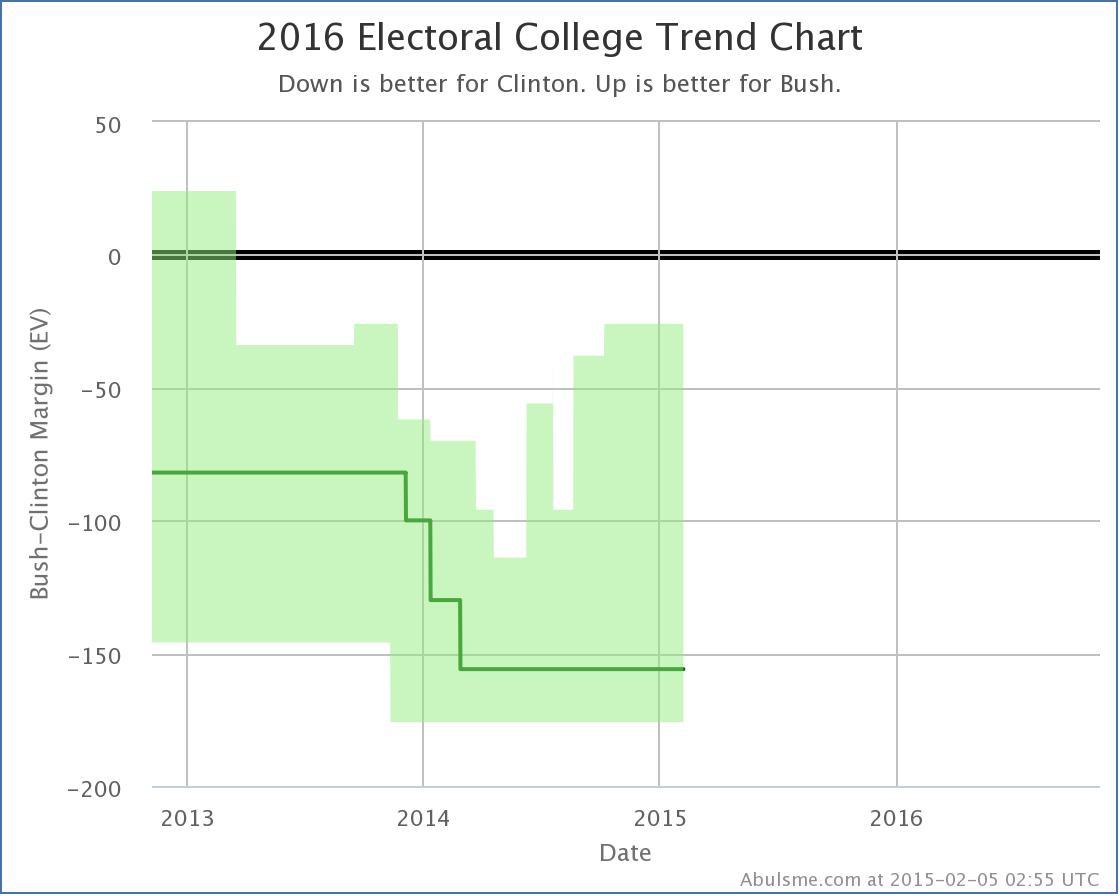
Since in both cases today, what has changed is the Republican best case, lets look at the trends there with the five best polled candidate combinations. Looking just since the 2014 elections, the movement on this specific metric has been Paul improving, Bush and Ryan flat, Christie and Huckabee declining. Other metrics show slightly different trends, but when all of the Republicans here are losing even when you give them all the close states, the first step is just to start making states close, and this chart measures that process.
But wait, Ryan has said he isn’t running, and what about this Walker guy? A bunch of people have been talking about him lately. Well, I recently introduced this new chart on where the candidate combinations stand in my “polling quality” metric:
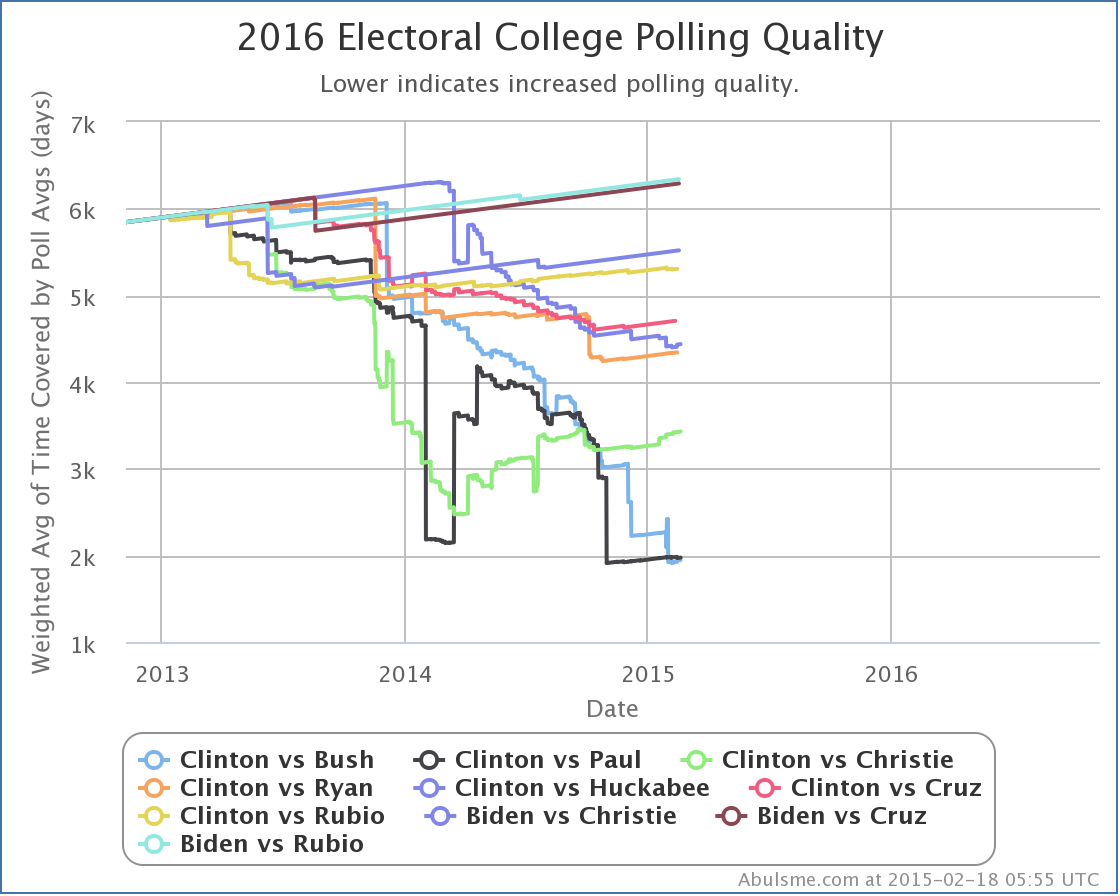
This shows the best TEN polled candidate combinations, not just the top five, so we can see if new candidate pairs are heading toward the top five.
On this chart the lower the line, the better the polling quality. Poling quality is measured by the average amount of time used in the polling averages across the 56 jurisdictions that have electoral votes, weighted such that close states count a lot more than states where one candidates lead is large. A new poll may or may not improve polling quality, since if new poll makes a state less competitive than it was, the weight of that state also decreases in this metric. If there are no new polls for a candidate pair, the polling quality slowly gets worse as each day passes.
Anyway, what do we see here? Well, if trends continue, looks like Clinton vs Huckabee may soon pass Clinton vs Ryan, and Clinton vs Bush and Paul are very close to each other so easily could flip back and forth, but Clinton vs Cruz hasn’t shown any signs lately of much life. Nor any of the others in the 6-10 zone. So we may not get any new combinations in the top five for a little while yet.
How about Clinton vs Walker? Oh, yeah. that combination is still way out at #18 on this ranking. He stands at about 6616 on this metric, compared to 6340 for the worst of the top ten shown in the chart above and 4437 for the worst of the top five. We need a lot more state level polls of that combination before we have enough polls to meaningfully compare that scenario to the five we’re showing in the analysis here.
We are 634.6 days from the first polls closing as I write this message. But yet here I am with the fourth of these updates in a two week period. I honestly didn’t expect the polling to be picking up quite this fast. But it seems to be. So be it.
Please keep in mind that everything here describes where things are now, and how things are trending NOW. We are far enough from the 2016 election that nothing here represents a prediction for what will happen in 2016. But knowing how things look now and observing the trends still provides interesting insight.
Today I added new polls from CNU in Virgina and from Bloomberg / Saint Anselm / Purple in New Hampshire. These resulted in changes worth noting* for three candidate pairs. I’ll review them quickly in order of the magnitude of the change.
Click on any of the charts to go to the election2016.abulsme.com site for more detail.
Clinton vs Huckabee
Huckabee had only been hanging on to the “Weak Clinton” category in Virginia by virtue of the fact that I pad my poll average with previous general election results if there are not yet five actual polls between the candidates in question. With the third poll directly pitting Clinton vs Huckabee in Virginia, Huckabee falls much further behind, and Virginia now seems to slip out of reach. Huckabee’s best case vs Clinton therefore gets worse.
Without Virginia in the mix, Huckabee’s “best case” (where he wins all the states he is ahead in, plus all of the states where Clinton is ahead by less than 5%) is now to lose to Clinton by 76 electoral votes.
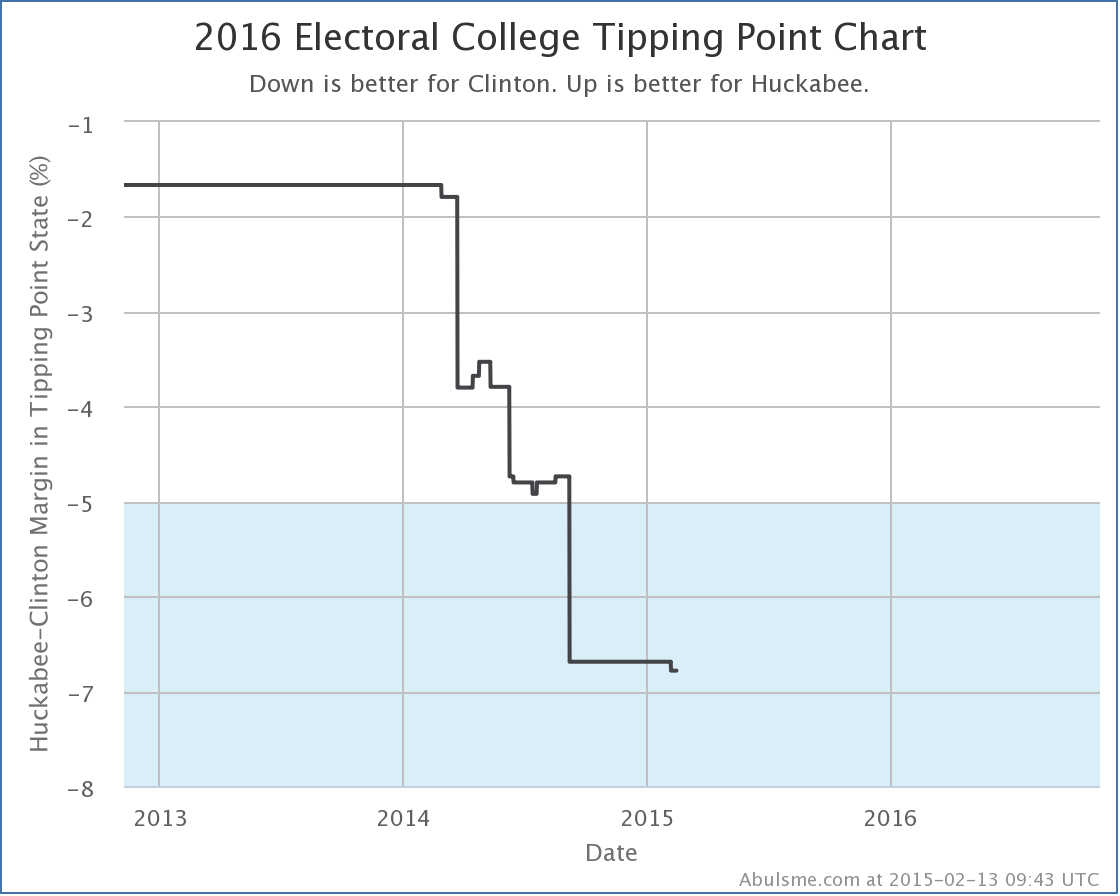
This change also drops the “tipping point” (which represents how much of a uniform shift in polling across all states would be needed to flip the election) further in Clinton’s direction. The tipping point state for Clinton vs Huckabee is now Minnesota, where Clinton is ahead by 6.8%.
Clinton vs Paul
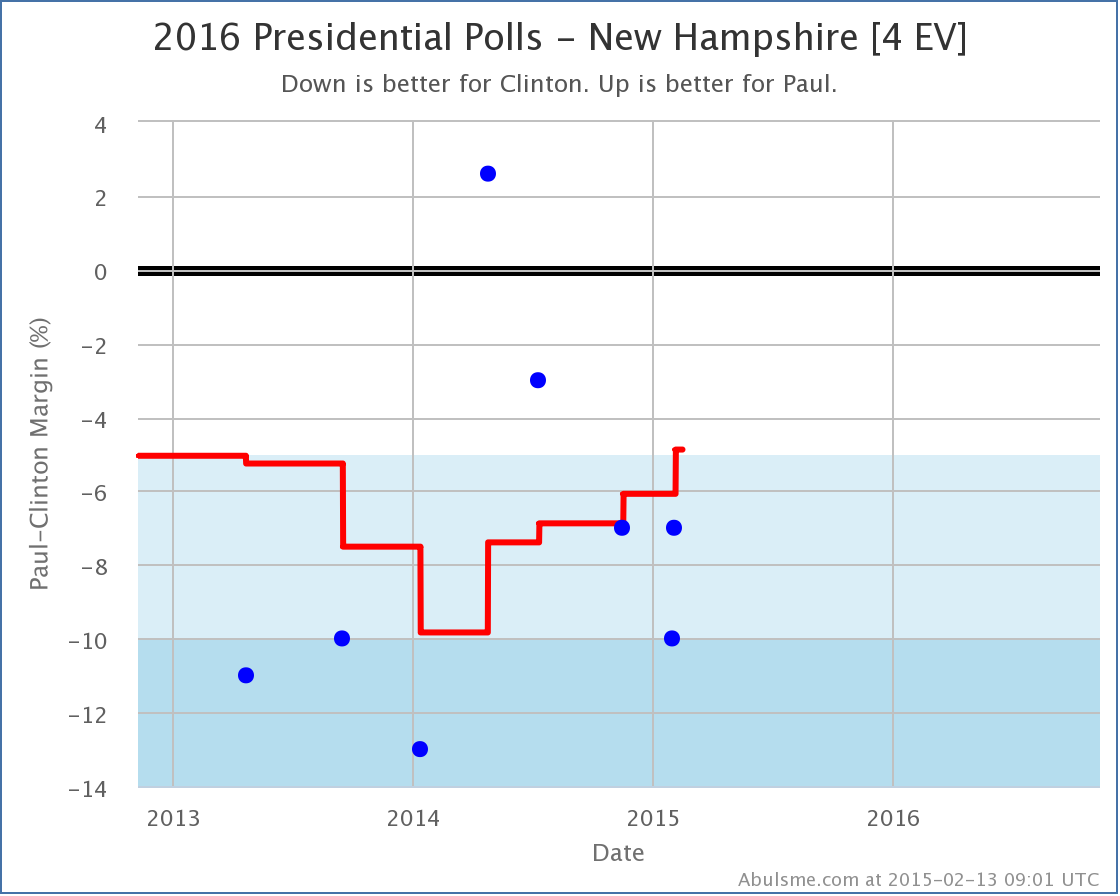
This chart of Clinton vs Paul polls in New Hampshire is interesting, and actually shows one of the disadvantages of using an average of the most recent polls, rather than some more sophisticated sort of trend smoothing. Paul’s average vs Clinton has been steadily improving for the last year. But if you look at the individual polls, you see that this is because some really bad polls for Paul from 2013 and early 2014 were “aging off” the average, being replaced by some relatively good polls for him from the last year, including one where he was actually ahead!
But if you actually look at the trend of the individual polls since then, the trend has been back toward Clinton. With a straight up poll average, this trend in the last five polls is invisible. We just know that the average of the newest five is higher than that of the five most recent polls not counting the brand new one. Basically, a poll where Paul was behind by 13% was replaced by a poll where Paul was only behind by 7%, so the average moved toward Paul… even though there may be a different trend if you look within the five polls actually used in the average.
If the trend in the last five polls is real (it may or may not be) then it would not be surprising to see New Hampshire fall back into “Strong Clinton” territory with the next poll.
For now though, we grant Paul the possibility of winning New Hampshire in his “best case” which is now to lose to Clinton by only 88 electoral votes.
Clinton vs Bush
No changes in best, worst or expected case for Bush against Clinton, but since the tipping point in this case was Virginia, and we had polling in Virginia, it is not unsurprising that the tipping point here moved, if only a little.
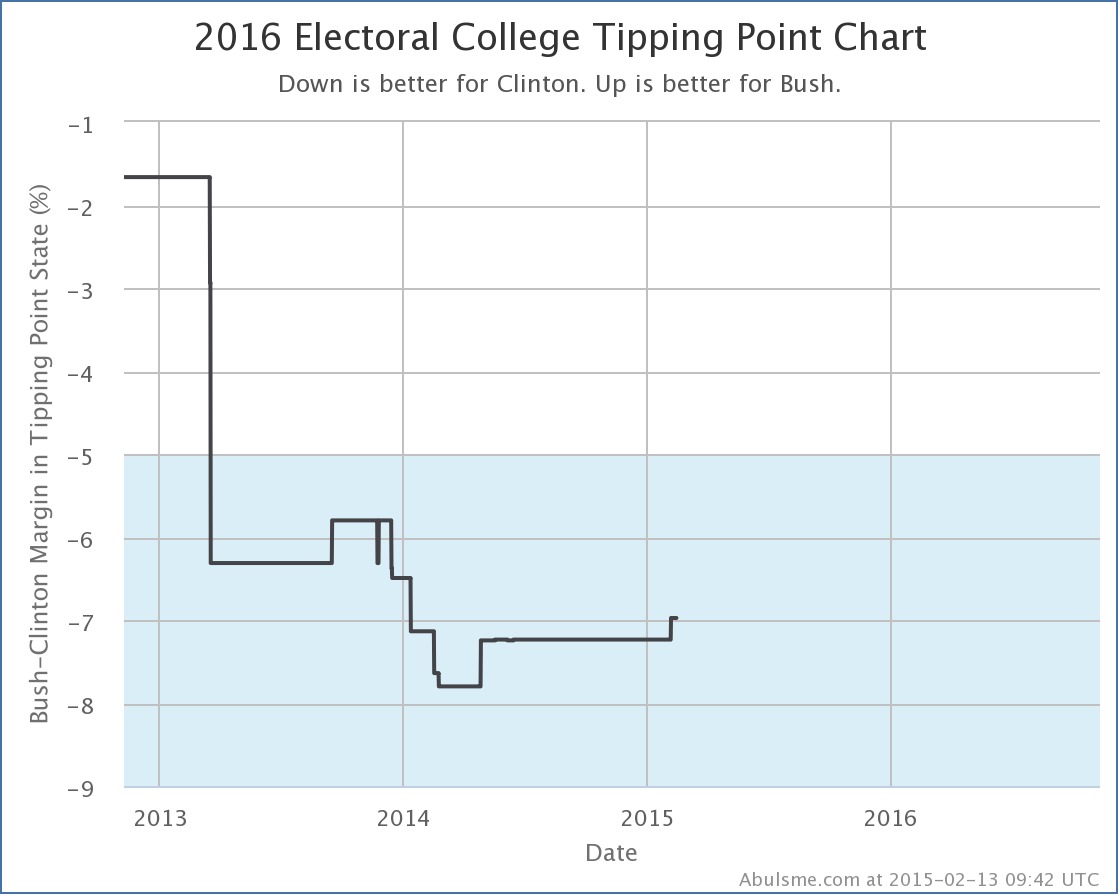
The tipping point here remains Virginia, but Bush moves from being behind 7.2% there, to only being behind by 7.0%.
And that is it for today’s update. Please explore election2016.abulsme.com to find more detail and interesting bits and pieces.
* For now, “Changes worth noting” are when the best, worst, or expected cases for one of the five best polled candidate pairs changes, when the tipping point changes by at least 0.1% for one of those candidate pairs, or if a new candidate pair becomes “best polled” or replaces one of the current five pairs on the list.
Some new polling was added today from PPP in North Carolina. It didn’t change the status of any state for any of the top five “best polled” candidates, nor did it change the tipping points for any of those. However, it did move Clinton vs Bush ahead of Clinton vs Paul in the metric I use to measure how good the polling is for the various candidate combinations. This means that Clinton vs Bush is now the default view when you go to election2016.abulsme.com.
Now, this does NOT necessarily mean that Clinton and Bush are the front runners in their respective primary races… although there is a strong argument that they are… it just means that there is currently better state by state polling data for this particular combination than any of the others.
Given this, I thought a quick overview of the Clinton vs Bush combination was in order.
So, as with all the other “top five” Republicans against Clinton, Bush is behind, even in the “Best Case” where you give him all of Clinton’s weak states.
But, unlike some of the others, Bush’s “best case” has been steadily improving since last spring.
And while it hasn’t happened yet, there are two states right on the verge of flipping and improving his expected case as well…
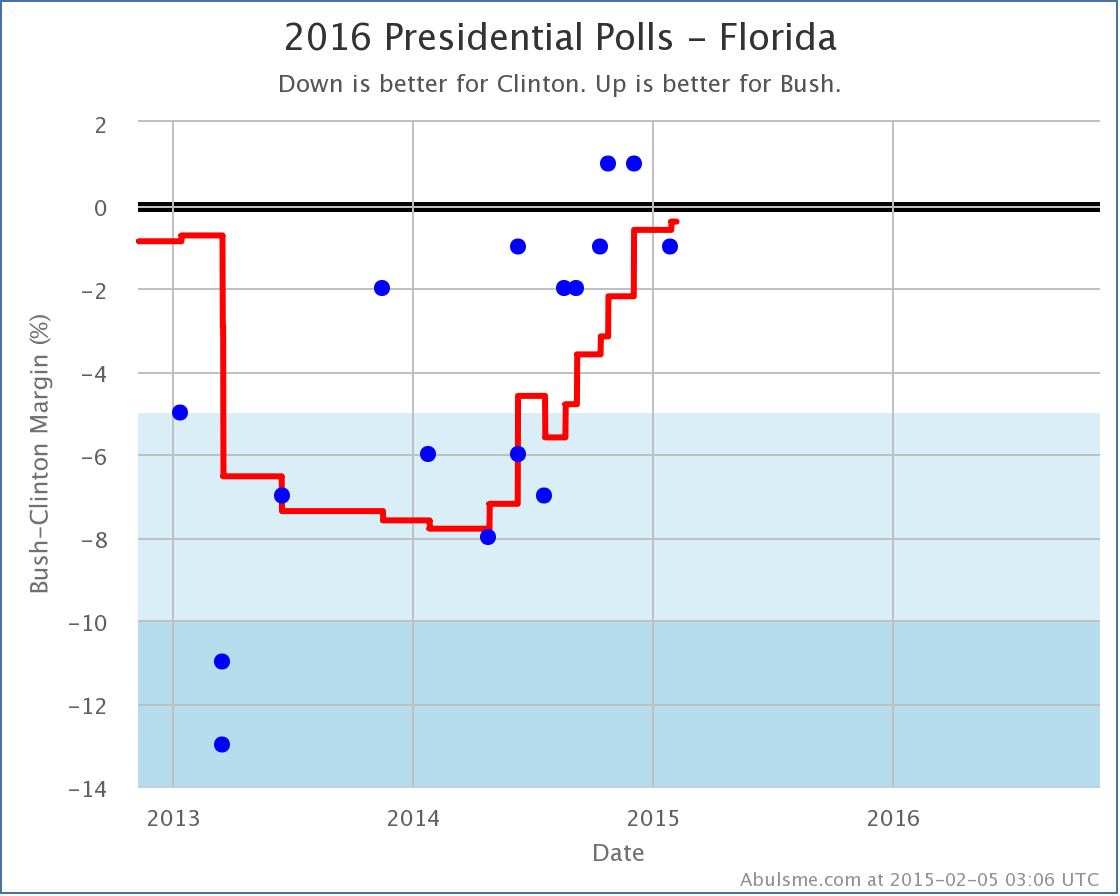
Florida, with 29 electoral votes, considered by many a “must win” for any Republican path to victory, has been trending strongly away from Clinton and toward Bush since bottoming out in the first part of 2014. Currently Clinton’s lead is 0.4% in my average. One more good poll for Bush, and Florida will move into his column.
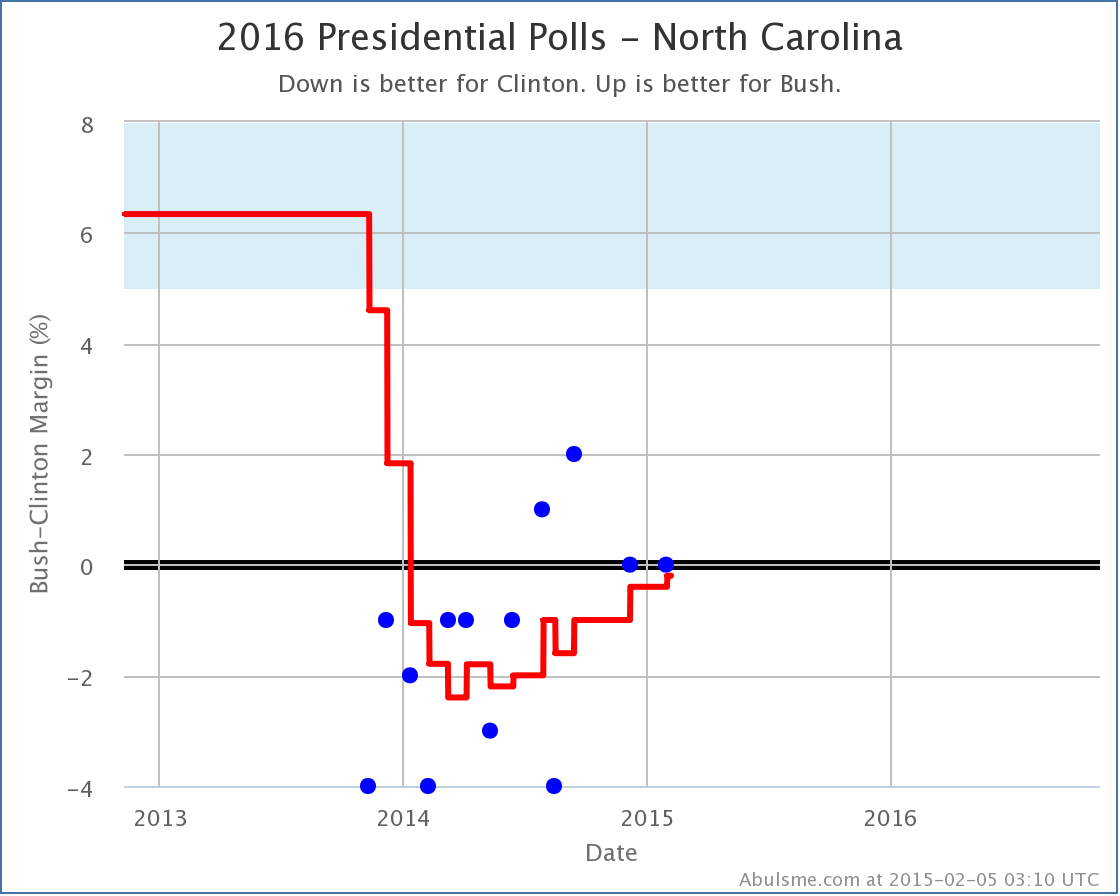
Ditto with North Carolina with 15 electoral votes, where Clinton’s lead is a minuscule 0.2%. Both these states are really neck and neck, but the trend has been in Bush’s direction in both.
Do not be surprised if these flip and Bush’s “expected case” starts moving in his direction soon.
Of course, to actually win, a lot of states need to move. The “tipping point” measures this.
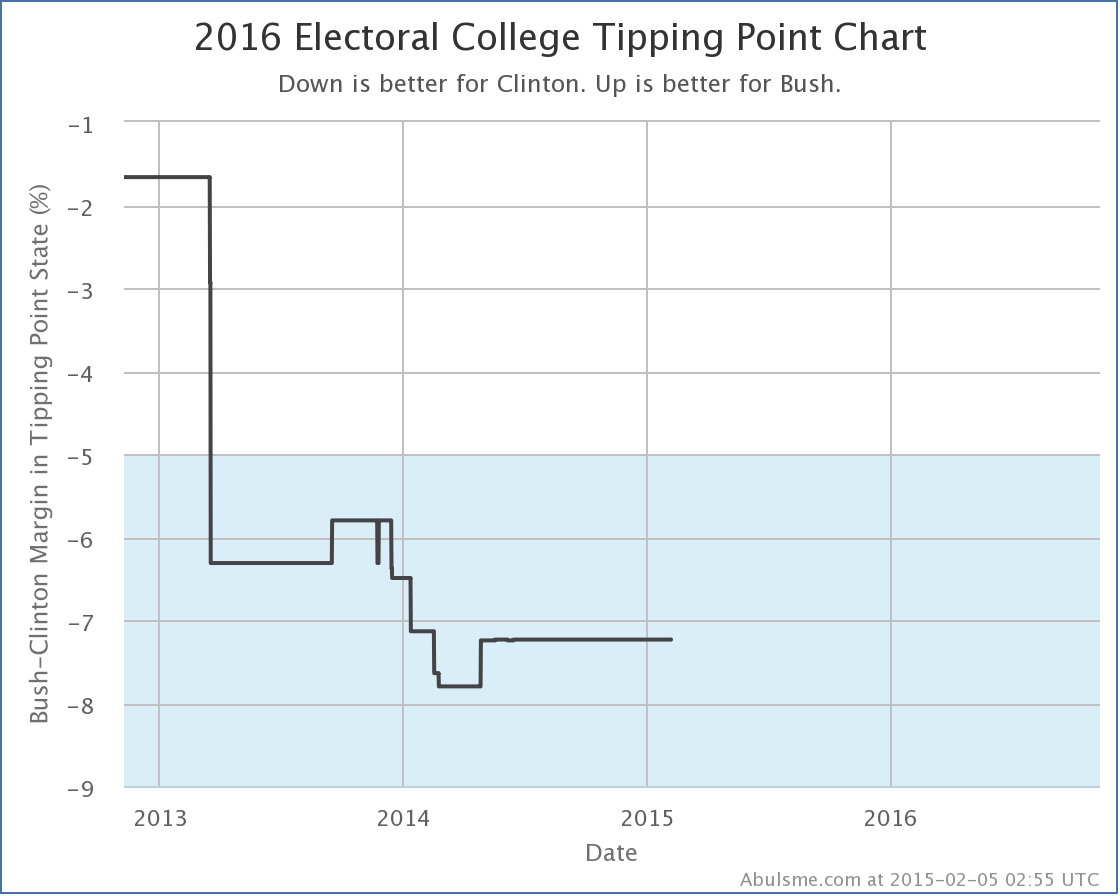
No significant movement here recently. Does this move Bush isn’t moving all the states he needs to? Maybe. But more likely, there just hasn’t been much new polling in the states near Bush’s current tipping point.
To start seeing movement in the tipping point for Clinton vs Bush, we need some new polls in states like New Hampshire (last poll in November), Wisconsin (last poll in April), Virginia (last poll in March), Minnesota (last poll in June) or Colorado (last poll in July).
The age of the polls in these states shows just how far away we still are from having a large enough volume of state level polling to have a good “real time responsive” sort of take on the situation. At this stage, polling is still slow and sparse in most states, and you have to interpret things accordingly.
Now, you can’t give a summary without the traditional map. So here is the current Clinton vs Bush map…
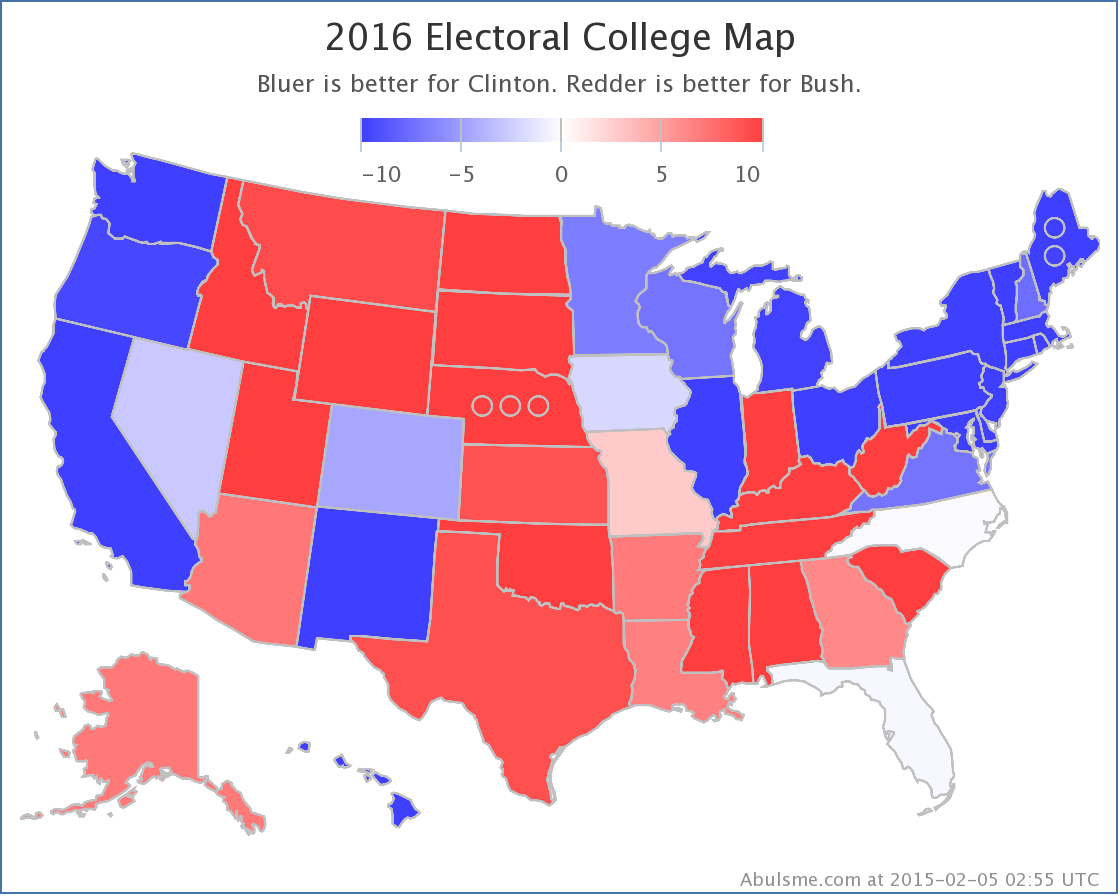
And finally, here is how that looks as a spectrum of the states broken down into the various classifications:
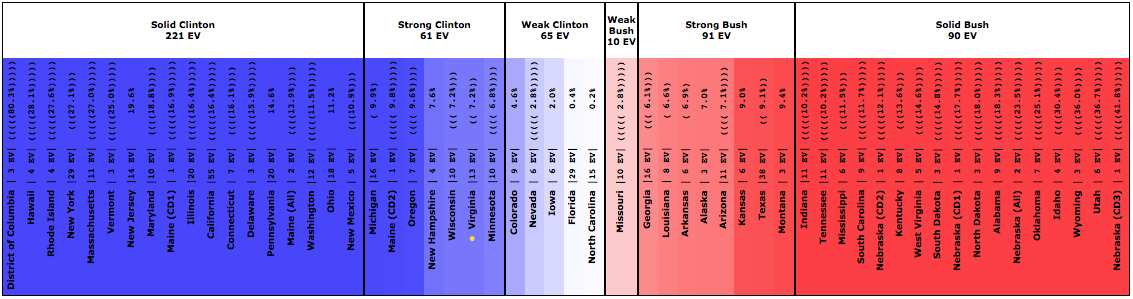
So there is our new “best polled” candidate combination… for the moment…
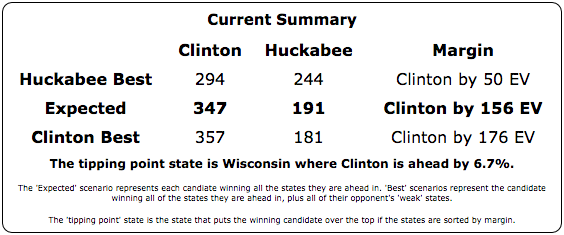
Today’s poll update was the addition of the Quinnipiac Swing State Poll, which included Florida, Ohio and Pennsylvania. Within the five “best polled” candidate combinations, this caused three changes worthy of note here. All three were moves toward Clinton and away from the Republicans.
First up, since it is the only one that actually involves changing the electoral summary for a candidate pair… Clinton vs Huckabee.
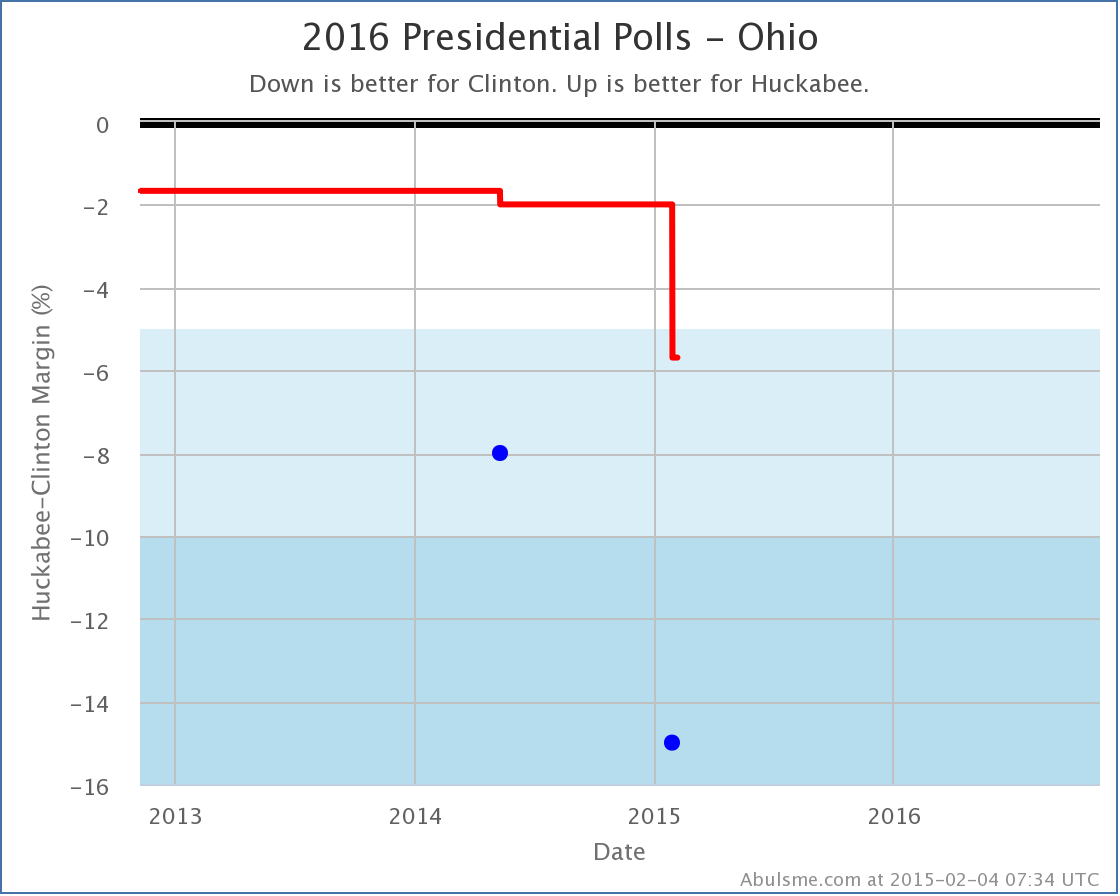
This is only the second time Clinton vs Huckabee in Ohio has been polled, but both new polls pull the state more toward the Democrat than the average of the last five presidential elections (which gave a 1.7% Dem advantage). This latest Ohio poll pulls the five poll average to a 5.7% lead for Clinton, which takes the state out of the “Weak” category which I allow to swing back and forth between the candidates to produce the “Best Case” scenarios for each candidate.
With the loss of Ohio from the list of “Possibles”, Huckabee’s “best case” moves from Clinton by 14 EV, to Clinton by 50 EV.
Of the five “best polled” candidate combinations, Clinton vs Huckabee is still #5 with much less comprehensive polling than Paul, Bush and Christie, so this may still be overstating where Huckabee would really be if more states were more fully polled.
The next two changes don’t actually change the Expected or Best cases for candidates, but rather are just changes to the “Tipping Point”. The tipping point essentially describes how much polls would have to move nationally (assuming an even distribution of movement in all states) to change who has the lead in the electoral college… in other words, how far ahead or behind the candidate is overall.
So next up is Clinton vs Paul:
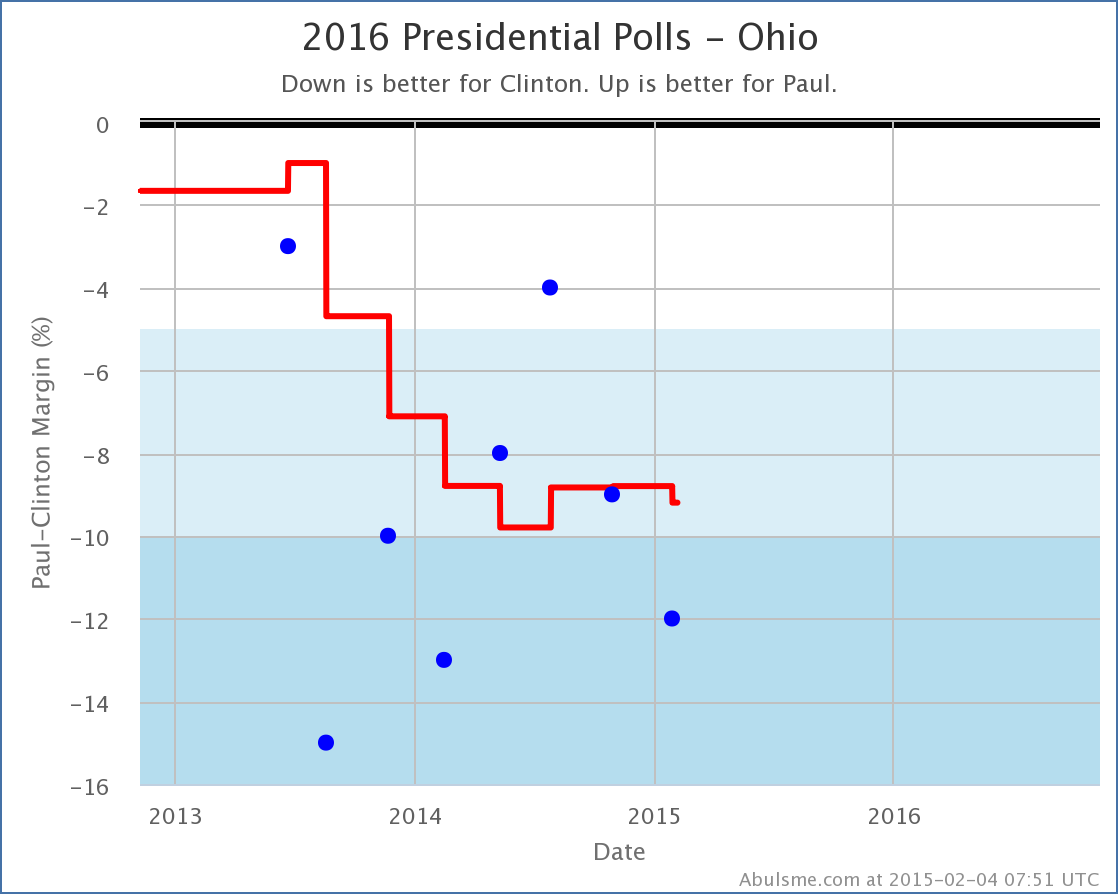
With the new poll, Paul moves from being behind 8.8% in Ohio, to being behind 9.2% in Ohio. Both of these are in the “Strong Clinton” category, so there is no category change here, but Ohio was the tipping point state in this contest, and so any movement in this state will generally mean movement in the tipping point.
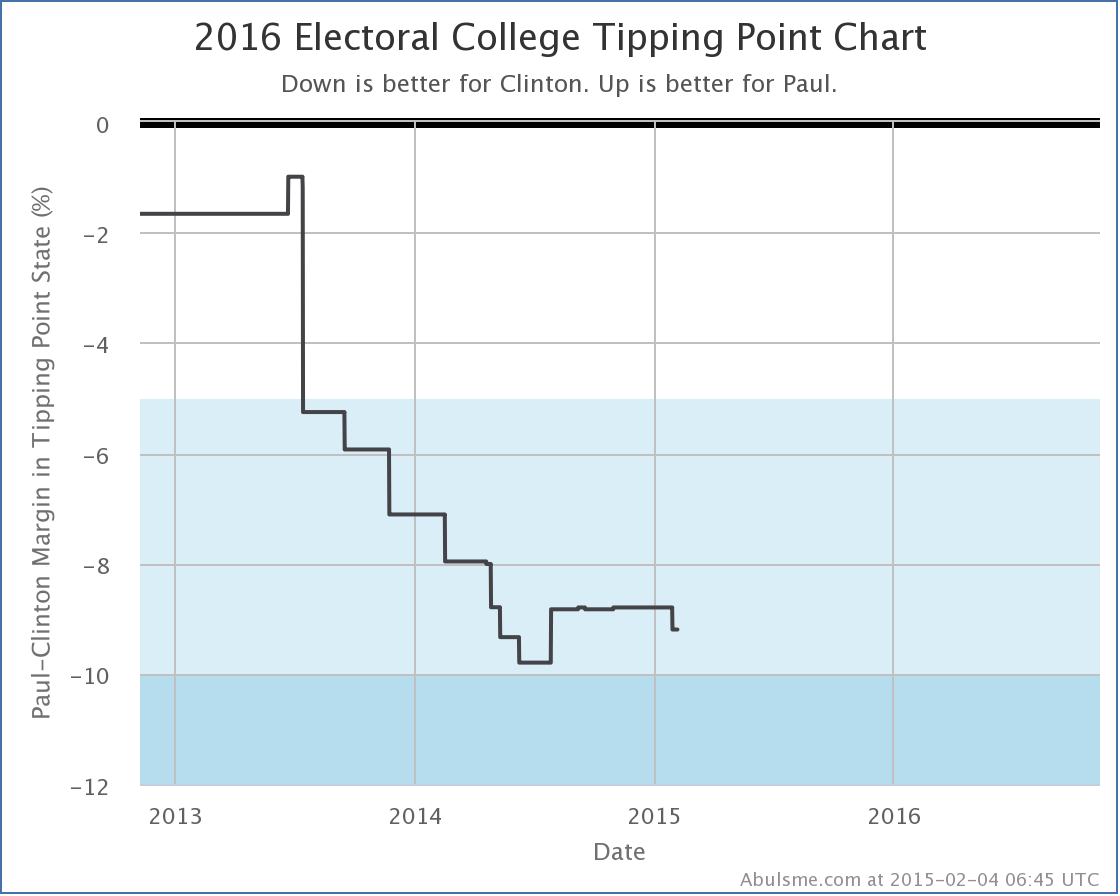
As you can see, the Clinton vs Paul tipping point has been between an 8% and 10% Clinton lead for most of the last year, so this isn’t breaking any new ground. The trend before last summer on this chart was basically just the process of getting enough polls to have a good view of this candidate pair, so things have essentially just been pretty flat since then. The new change doesn’t really change that, although I’m sure Paul would still rather see this line go in the other direction. (Well, if Paul was looking at my charts, which he isn’t. :-) )
Finally, Clinton vs Christie. This time, the changes in two states were relevant:
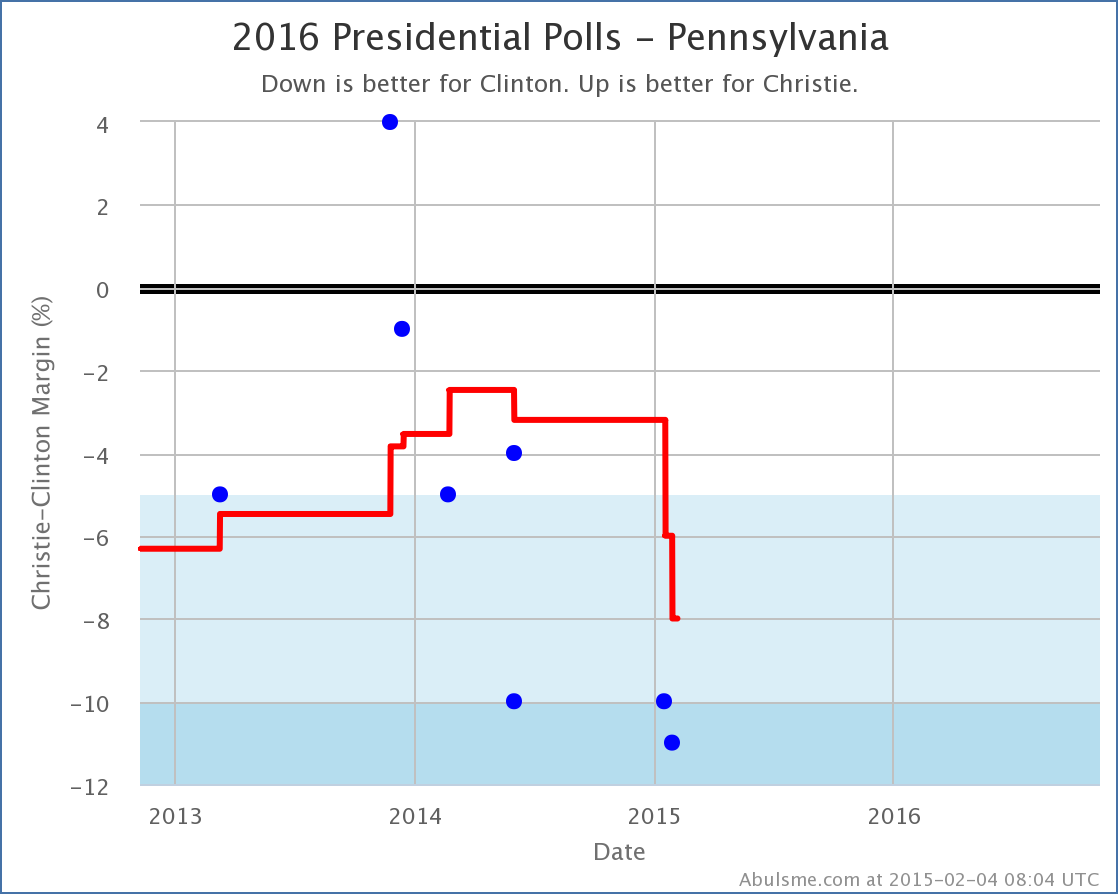
Last week I talked about Christie fading in Pennsylvania. The new polls today reinforce that trend, further worsening Christie’s position in Pennsylvania. It dropped him from being behind by 6.0% to being behind 8.0%, which pushed Pennsylvania past the previous tipping point of 7.5% in Minnesota.
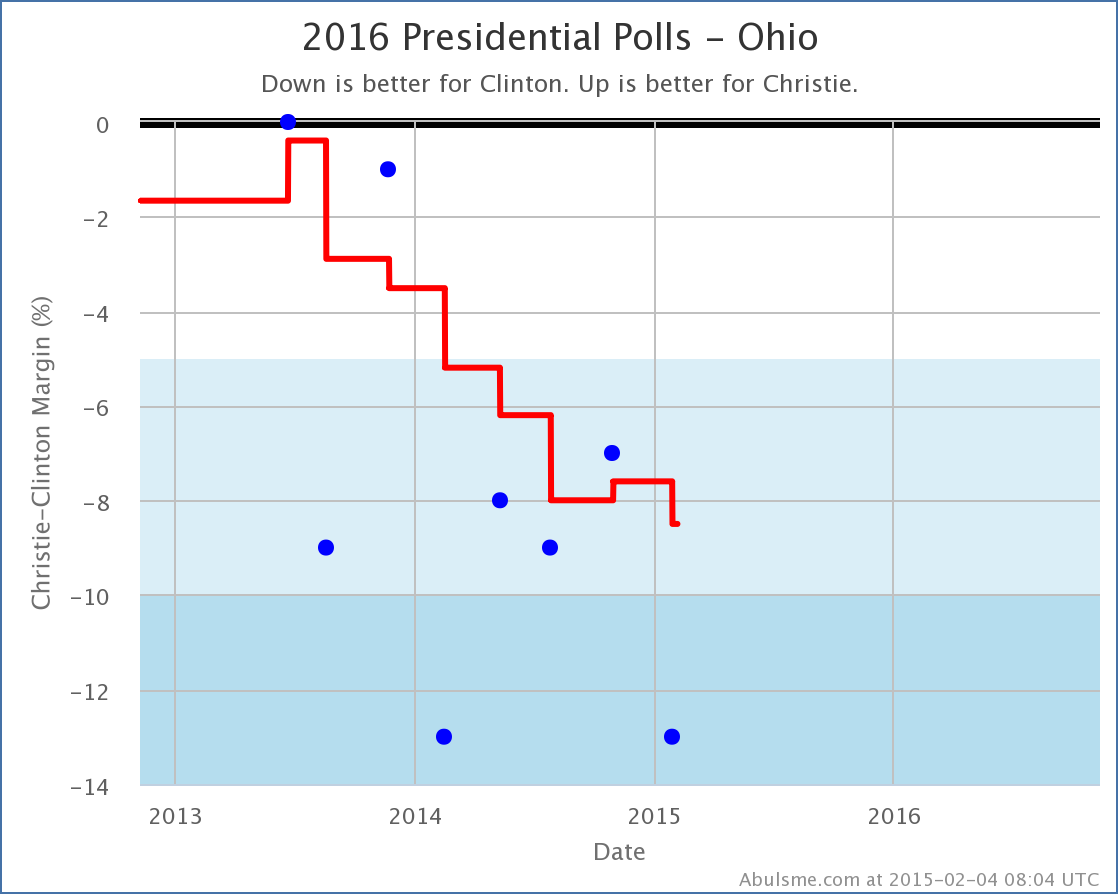
Now, Ohio also moved away from Christie with today’s polls (from Clinton by 7.6% to Clinton by 8.5%). If it hadn’t, Pennsylvania would have pushed past Ohio too, which would have had a different result for the Tipping Point.
In the end, the tipping point for Clinton vs Christie moved from Clinton by 7.5% in Minnesota, to Clinton by 8.0% in Pennsylvania.
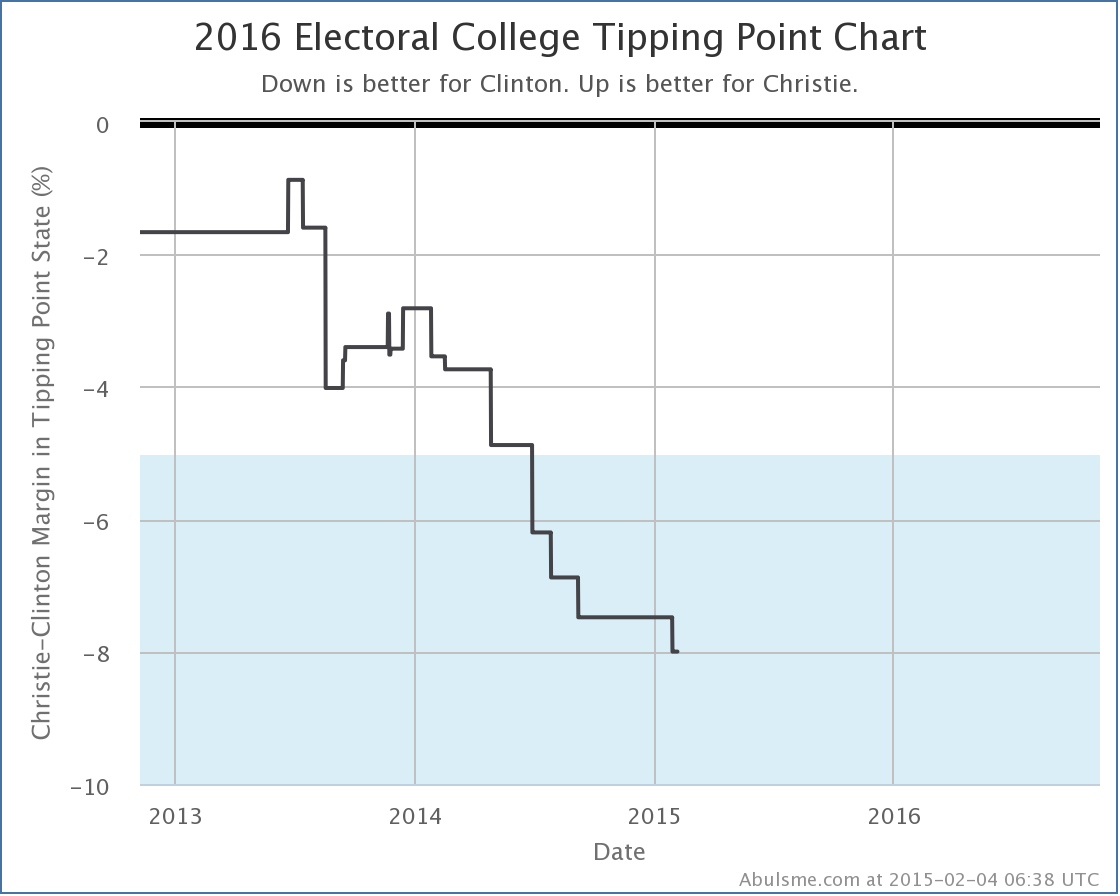
Unlike Clinton vs Paul, with Clinton vs Christie we’ve basically just been seeing a continued trend away from Christie and toward Clinton. Christie has not been faring well lately on this front.
Before closing up, lets look at a couple of the comparison charts between the five best polled candidate pairs.
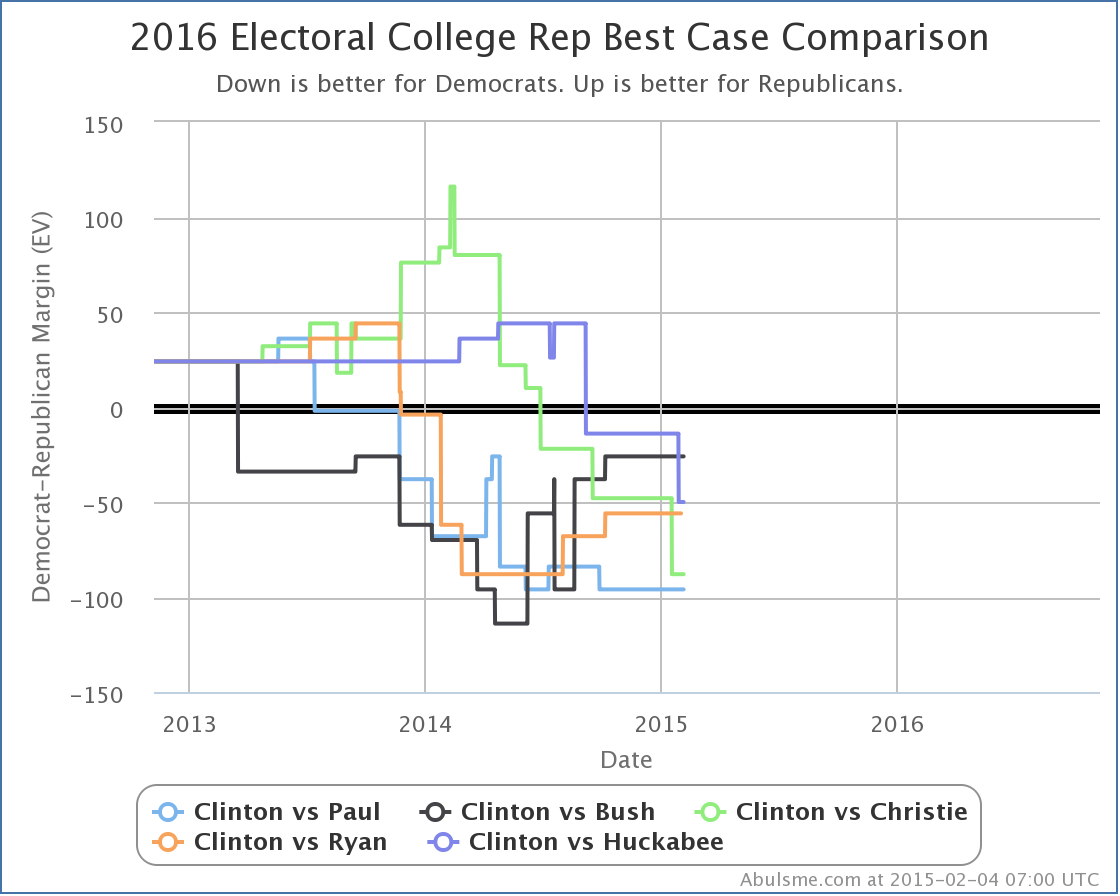
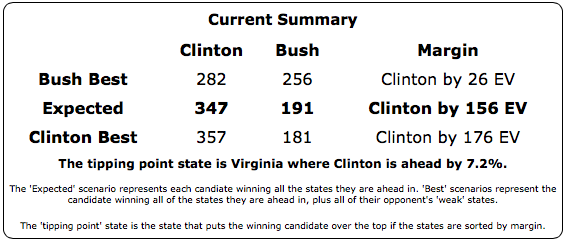
With Huckabee’s decline in best case, the Republican with the best best case against Clinton is now Bush, but that Best case is still losing by 26 electoral votes. (And the expected case if Bush did NOT manage to flip all the Weak Clinton states is Bush losing by 156 electoral votes.)
The worst best case versus Clinton is still Paul, losing by 96 electoral votes even if you give him all the Weak Clinton states. (Paul’s expected case is a bit better than Bush though, only losing by 138 electoral votes.)
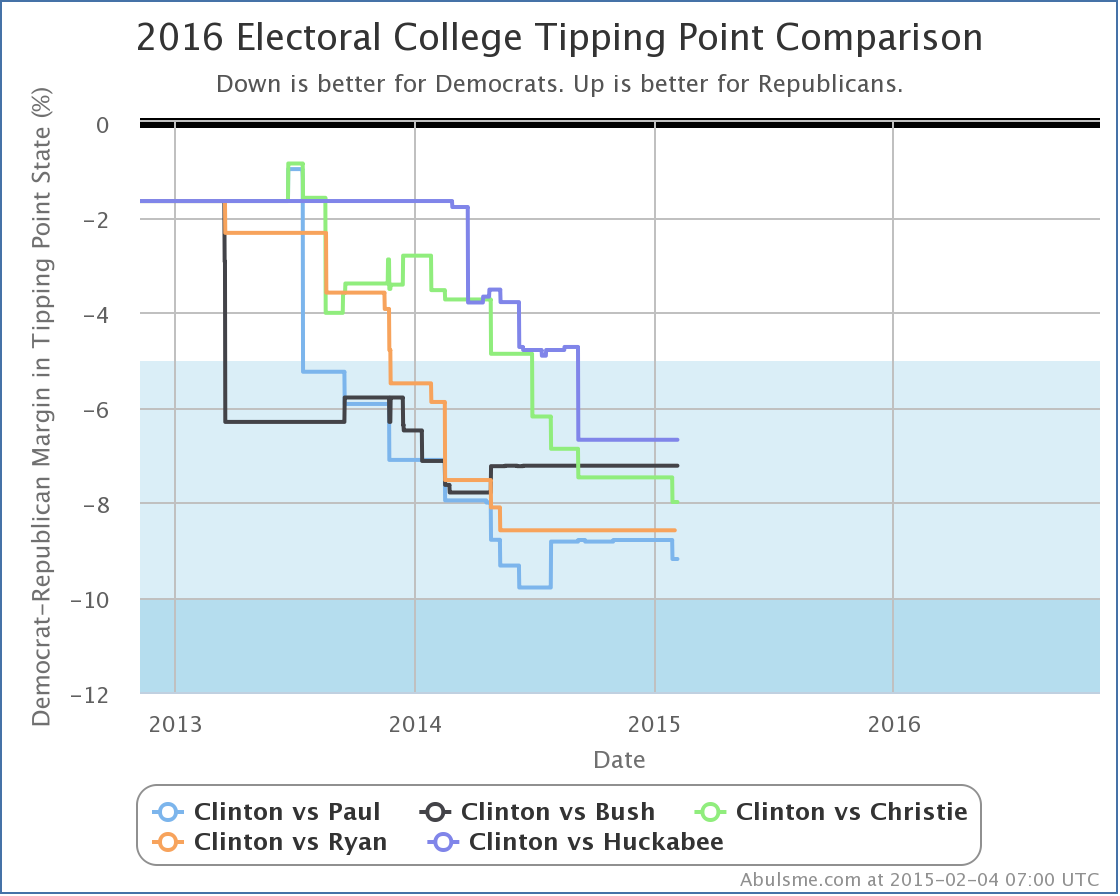
It looks a little different in terms of tipping point, with Huckabee doing best this time (behind by 6.7% in Wisconsin). Paul still in the rear here, behind by 9.2%.
Now, as people keep pointing out, and I will too, polls this far out from the election are NOT PREDICTIVE. All of the charts I’ve shown above say NOTHING about what the actual results in November 2016 will be. NOTHING.
However, that does NOT mean they are meaningless, or that they should be ignored. (Or why am I bothering with all this?) No, polls right now still give you a sense as to where things stand TODAY, which while it won’t tell you who will win 643 days from now, it DOES tell you how much work the candidates who are currently behind have to do in order to flip things. (Alternately, how much wiggle room the candidate in the lead has available as buffer against mistakes they might make.)
So, yes, pay attention to the polls. Even now. Just don’t make the mistake of believing that just because Clinton is way ahead of everybody now that necessarily means that will still be the case in a year and a half, when the polls DO start having some predictive power.
PS: There was also a tipping point change today for Clinton vs Romney but even with today’s new polls, Clinton vs Romney is still only the 20th best polled candidate combination, and with Romney declaring he isn’t going to run after all, he’s no longer as likely to climb the ranks as I thought a few weeks ago. If I had to guess as to the next change in the “Top Five” it would be Clinton vs Rubio (currently #7, but Rubio actively talking about being a candidate) replacing Clinton vs Ryan (currently #4, but Ryan having said he won’t run).
Edit 10:11 UTC – Added “Electoral College” prefix to title for consistency.
[Edit 2012 Aug 31 20:51 UTC to make it just “Sam talks about” instead of “Sam and Ivan”.]


While there are still speeches yet to come, and a few more things my happen at the Republican National Convention, the actual nomination is now complete. The Republicans officially have a nominee. So time to review the final results of the delegate race.
| Stage |
Bachma. |
Gingri. |
Huntsm. |
Paul |
Perry |
Romney |
Santor. |
Roemer |
NV/U |
| Peak |
2 |
159 |
2 |
173 |
6 |
1571 |
268 |
0 |
|
| Final Est |
1 |
142 |
0 |
173 |
0 |
1555 |
247 |
0 |
168 |
| Roll Call |
1 |
0 |
1 |
190 |
0 |
2061 |
9 |
1 |
23 |
| Official |
0 |
0 |
0 |
0 |
0 |
2061 |
0 |
0 |
255 |
Peak represents the highest delegate estimate the candidate had during the primary season (not counting the final convention results).
The final estimates reflect the best estimates used here as of the “end” of the primary season. Specifically these is the estimate on August 22nd 2012, right before Gingrich and Santorum released their delegates. These released delegates were then free to vote for whoever they wanted in the Roll Call.
The roll call represents the count of the votes verbally given by the states at the Roll Call at the convention on August 28th 2012. (There were five votes in Pennsylvania that some reported as going to Paul Ryan, others have said the speaker said “Paul, Ron”. I believe these were intended for Ron Paul, so have counted them as such.)
The official count represents the vote as recorded by the convention. Romney was the only candidate who was officially nominated and seconded at the convention, so therefore was the only candidate who could officially receive votes and have them registered. Officially any votes for anybody else were equivalent to abstentions.
Lots more details on the final results of the full process can be found on the Results of the 2012 Republican Party presidential primaries page on Wikipedia, Green Papers (including totals), and DCW.
Note: Charts from the Abulsme.com 2012 Republican Delegate Count Graphs page. The first and second charts represent the % of remaining delegates the candidates needed in order to reach 1144 and win the nomination. Going above 100% represented being mathematically eliminated, dropping to 0% represented “clinching” the nomination. The first chart shows this by date, while the second shows this by % of the delegates determined so far. The third chart is the % of delegates the candidate has collected. The fourth is the actual number of delegates. These numbers include estimates of the eventual results of multi-stage caucus processes as those estimates were refined over time. The final data point represents the roll call count, not the official results which only counted votes for Romney.
[Edit 2012 Aug 29 14:59 to add two more charts and revise the final note.]
[Edit 2012 Aug 29 15:42 to add links to sources for more info.]


Charts from the Abulsme.com 2012 Republican Delegate Count Graphs page. The first chart is the % of delegates the candidate has collected, the second is the number of delegates. These numbers include estimates of the eventual results of multi-stage caucus processes which will be refined as the later stages occur.
And so, yesterday, on July 14th, Nebraska had their state convention. Nebraska ends up 32 Romney, 2 Paul, 1 TBD.
And with that, the last major scheduled event on the 2012 Primary calendar comes to a close.
We end up with: 1531 Romney, 257 Santorum, 156 Paul, 142 Gingrich, 1 Bachmann… and 199 TBD.
Of course at some point those 199 TBD’s have to make up their minds and vote for somebody at the convention (or abstain). And in all likelihood many of the non-Romney’s will end up voting for Romney after all. Or the convention may just have a motion to declare Romney the winner by acclimation and we may never get a full vote count. In previous years though, in the final roll call vote, the winner has gotten much more than their totals at the end of the primary season would indicate, and everybody else has gotten less.
Not to mention, to be officially nominated at the convention, you need to have won at least five state contests. So a quick look at that total:
- Romney – 41 contests (Most Places) plus 2 ties (Alaska, Mississipi)
- Santorum – 3 contests (Alabama, Kansas, Oklahoma) plus 2 ties (Alaska, Mississipi)
- Paul – 3 contests (Iowa, Maine, Minnesota)
- Gingrich – 2 contests (Georgia, South Carolina)
In Montana and Pennsylvania uncommitted delegates are in the plurality.
There is also Louisiana, where there is a lawsuit between the Romney and Paul people that leaves the final delegate winner still undetermined.
(These add up to more than 50 due to DC, Puerto Rico, Guam, American Samoa, etc.)
In any case, unless there are defections in those two tied states that let Santorum claim them, it looks like Romney is the only one eligible to even be nominated.
There may be additional delegate changes on the margin, but I believe this is the last “event” prior to the convention.
So there we are. I’ll update after the convention if an official final delegate vote count is released.
Edit 2012 Jul 16 16:52: It has been pointed out in several places that technically speaking that unlike the actual vote for the presidential nominee, the votes for the “plurality” needed to nominate are not bound in any state. So therefore even in states where Paul does not have a plurality of the delegates, if a plurality of the delegation wishes to put Paul in nomination they could. This is perhaps most relevant in the cases where the delegate count is bound by primary results, but Paul managed to get his supporters elected to the actual delegate slots. In these cases, those delegates might give their state a plurality in favor of nominating Paul, but then those delegates would still be required to vote for Romney when the actual vote for the nominee came up. This seems like it is unlikely to actually happen unless the Romney folks decide it is in their best interest to let it happen. Also mentioned frequently, is that there is no binding at all on the nominations or voting for Vice President. So, if Paul’s folks wanted to make a show of it and cause trouble, they could nominate Paul for VP, regardless of Romney’s stated preference for that spot, then force a vote on it. Romney’s choice would then win of course, but we’d have a little drama first.


Charts from the Abulsme.com 2012 Republican Delegate Count Graphs page. The first chart is the % of delegates the candidate has collected, the second is the number of delegates. These numbers include estimates of the eventual results of multi-stage caucus processes which will be refined as the later stages occur.
Not that it matters at this point, but as the final results from Iowa came in this weekend, the results for Ron Paul were more favorable than the original estimates, so he gained delegates in my count, and the others lost delegates. The result is that Ron Paul has now passed Newt Gingrich for third place. (I use the Green Papers Soft Count, plus the DCW super delegate count in places where Green Papers hasn’t included them).
This of course doesn’t change the end results here at all. Romney is the nominee. It does however show once again how the final results in caucus states can be dramatically different from the “estimated” results based on the popular vote in caucus states. In the case of Iowa, the initial estimate was Romney 6, Santorum 6, Paul 6, Gingrich 4. As of right now we have Paul 21, TBD 7. Quite a bit different.
There are a lot of people who argue that because of these sorts of things, one should only look at the “hard” count of delegates actually already fully allocated and bound rather than trying to estimate caucus states at all in the early stages or the way some officially uncommitted delegates will go. I still think there is some value in doing those estimates, but one must be very aware of the limits of those estimates.
For reference, my current overall count is this:
Romney 1459, Santorum 257, Paul 152, Gingrich 142, Bachmann 1, TBD 275
Green Papers “Hard” Count has the following:
Romney 1329, Santorum 251, Gingrich 143, Paul 98, Huntsman 2, Bachmann 1, TBD 462
A little different. Either way though, Romney wins. :-)
Update 2012 Jun 17 23:36 UTC: Made my format for delegate counts consistant.
Update 2012 Jun 18 18:38 UTC: Minor wording fix.


Charts from the Abulsme.com 2012 Republican Delegate Count Graphs page. When a candidate gets down to 0%, they have clinched the nomination. If they get above 100%, they have been mathematically eliminated. The first chart is by date, the second is by “% of Delegates Already Allocated”. These numbers include estimates of the eventual results of multi-stage caucus processes which will be refined as the later stages occur.
This is what we have been waiting for seemingly forever. By the beginning of March it was clear that no other candidate than Romney had the ability to get to 1144 absent a miracle. By the beginning of April it was clear that the non-Romney’s also were not going to be able to collectively block Romney absent a miracle. But Romney still needed to actually get to 1144. Slowly but surely he did so through April and May. Today he finally goes over the top. (At least with the count I use, which uses the Green Papers soft count plus the DCW Superdelegate Count. Other counts may differ.)
Since this is “the end” lets include a couple of additional graphs with two other views of the race:


All of these charts show how Romney completely dominated this race from the very beginning. There was NEVER a point in the entire campaign where Romney was not ahead in delegates. It was only even close for a few days after Gingrich won South Carolina. The rest of the time, this whole campaign has just been a story of Romney slowly but surely pulling further and further ahead.
Now lets look specifically at today’s results from Texas.
Prior to today, none of Texas’s 155 delegates had been allocated. As of this update we have Romney 105, Paul 18, Santorum 13, Gingrich 7, Bachmann 2, TBD 10. Yes, that is right, at this late state, Michelle Bachmann mounts a comeback it seems. In any case, an overwhelming Romney win.
Romney also picked up two super delegates from Colorado today.
So net for the day: Romney +107, Paul +18, Santorum +13, Gingrich +7, Bachmann +2. Romney gets 72.8% of the delegates awarded today. This is way more than the 12.9% of the remaining delegates he needed to be on track to get to 1144 before “the end”. This was actually enough to push him over the edge.
My count now has the totals as: Romney 1159, Santorum 268, Gingrich 150, Paul 143, Bachmann 2
Now, by the Green Papers “hard count” that only counts delegates that are officially bound to Romney and theoretically have no discretion or ability to change their mind, we have Romney 1012, Santorum 245, Gingrich 143, Paul 93, Bachman 2, Huntsman 2… so by that count Romney still has a little bit further to go. The soft count also includes estimates for how delegates with discretion will vote and for how the remaining processes that are not yet final will play out. I also add in the super delegates who have publicly stated a preference. This is all reasonable. So I feel confident having using the count we have used all along, and considering Romney to have gotten to the 1144 magic number as of today.
Since we are hitting this major milestone today, I’ll take advantage of this time to highlight the comparisons with the 2008 races. More comparisons with 2008 can be found here.
First, to make comparisons easier, the 2012 race on a full 0%-100% scale:

Then what the equivalent graph looked like in 2008:

Looking at these two, in 2008 McCain had two non-trivial opponents compared to the 3 Romney had this time. In 2008, McCain pulled away from the other candidates starting around the 10% mark. In 2012 Romney was ahead from the very beginning. By the the 5% of delegates awarded mark (after Florida), Romney opened up the gap and none of the others ever came close again. Both Romney and McCain got to the “40% of remaining needed to win” mark at almost exactly the point where 50% of the delegates had been awarded. These two years look pretty similar.
Another view comparing Romney 2012 to McCain 2008 looks at % of total delegates earned by the eventual winner vs % of total delegates allocated. This was originally prompted by a post at Enik Rising. Looking at both candidates on the same chart we see this:

Despite all the talk at various points in time about Romney having problems closing the deal by comparison to 2008, this shows clearly that no such thing was happening. Any perception to that effect was due only to the fact that the calendar was more spread out this year than in 2008. Comparing the two curves, sometimes Romney was ahead, sometimes McCain was ahead, but for the most part these two lines tracked each other closely.
Finally, just for completeness, here is what an actually close race looks like on the “% of remaining delegates needed to win” chart… specifically, the Democrats in 2008:

With that, we wrap up the regular coverage of the Republican delegate race for 2012. There may be additional updates for specific milestones… if Paul manages to pass Gingrich in the delegate count… the final totals once all the state delegate selection processes are actually over… or the final roll call count at the convention… but as for regular updates this is it.
Thanks for everybody who has been reading and enjoying these updates over the last five months.
From here on out, it is all about the Electoral College…
Edit 2012 Jun 5 12:49 UTC: Fixed affect/effect typo.
|
|


