States with new poll data added since the last update: All 50 states, DC, and the Maine congressional districts
Notable changes in: Arizona, Indiana, Maine (CD2), and the tipping point
National Summary
At this point we have many polls that are fully or partially after the “Trump Tape” release on the 7th, but this batch of polls still included many where most of the time in the field was before that. And of course the state averages here are based on at least the last five polls in each state, so reach even further back in time. The close states tend to be based on polls with middates going back 1-3 weeks.
All that is to say that the changes we are seeing now are starting to include the fallout from that event, but haven’t yet fully factored it in.
With that out of the way, the changes for this round:
- The expected result moves from Clinton by 176 EV to Clinton by 154 EV
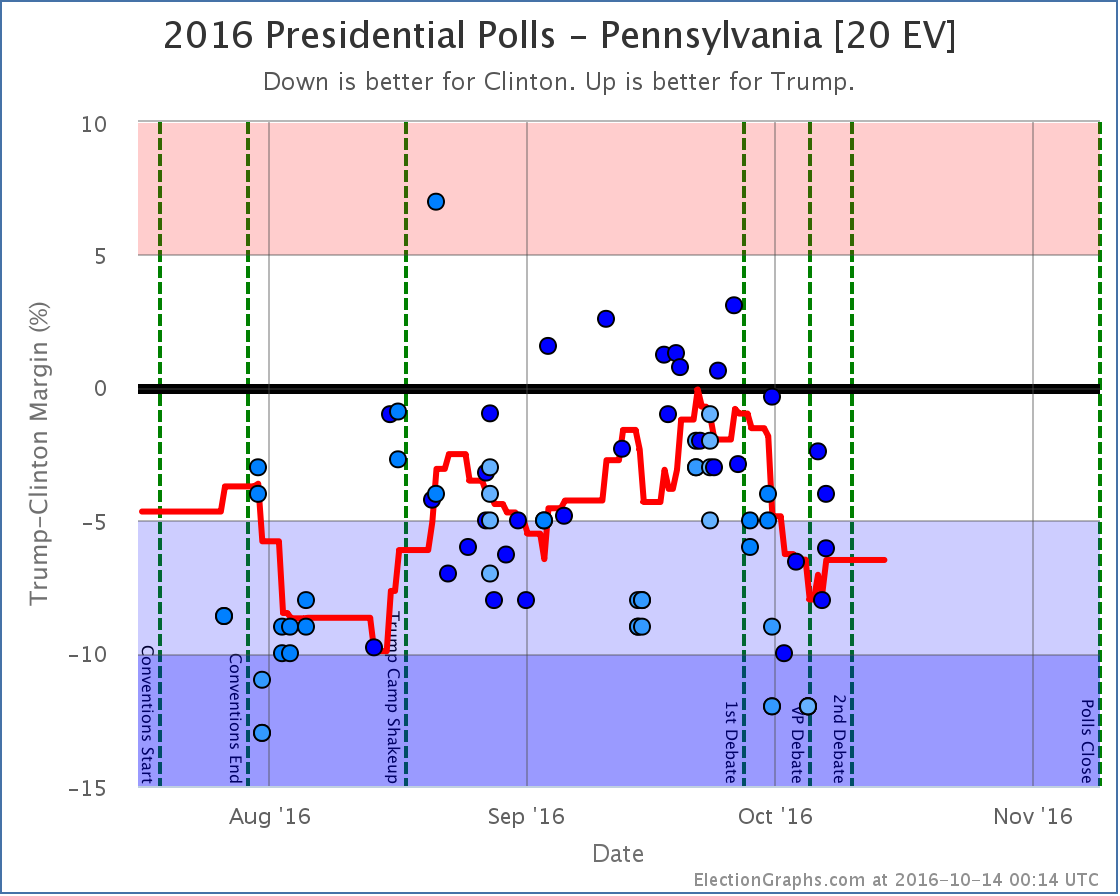
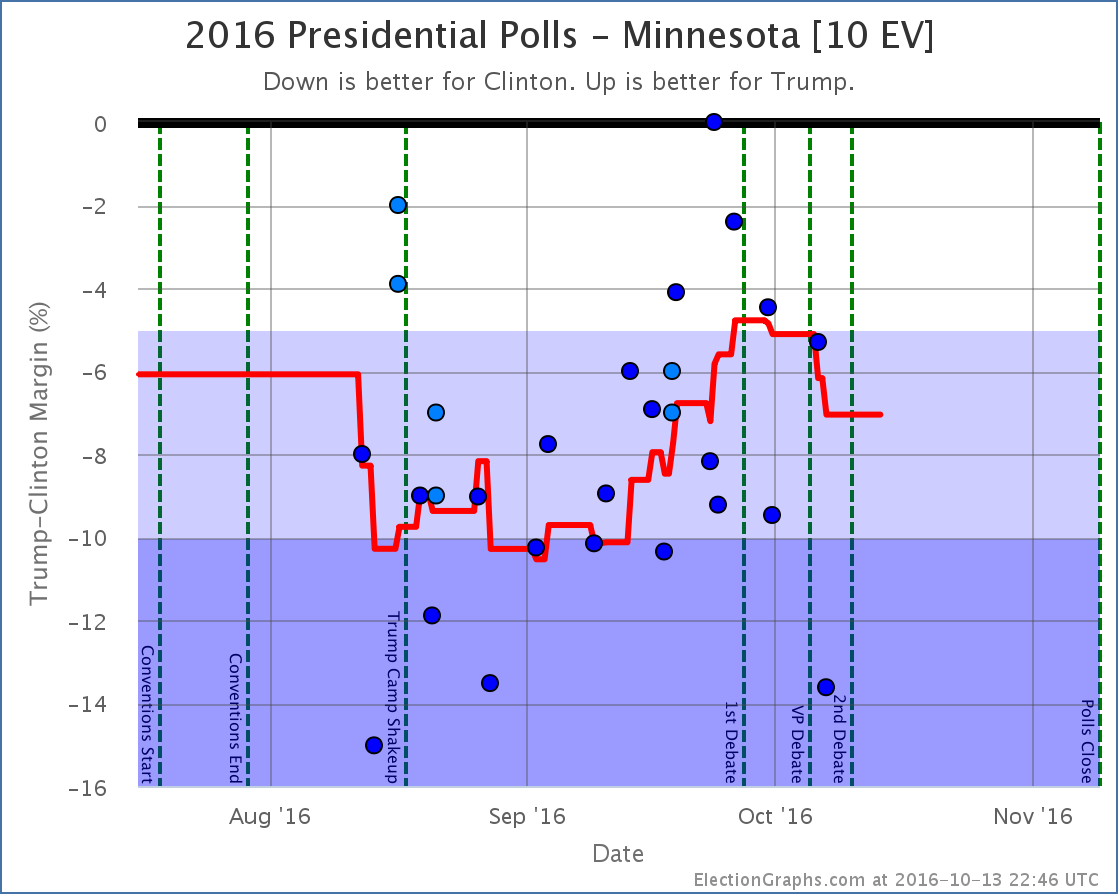
- The tipping point moves from Clinton by 5.9% in MN to Clinton by 6.5% in PA
- Clinton’s best case improves from winning by 202 EV to winning by 226 EV
So wait, the expected result moved toward Trump! Why is the title of this post about Trump’s drop continuing?
Well, basically because the improvement in the expected case is a result of Arizona moving from just barely Clinton, to just barely Trump. Either way it is really too close to call. It may flip back again with the next update. Or maybe it won’t.
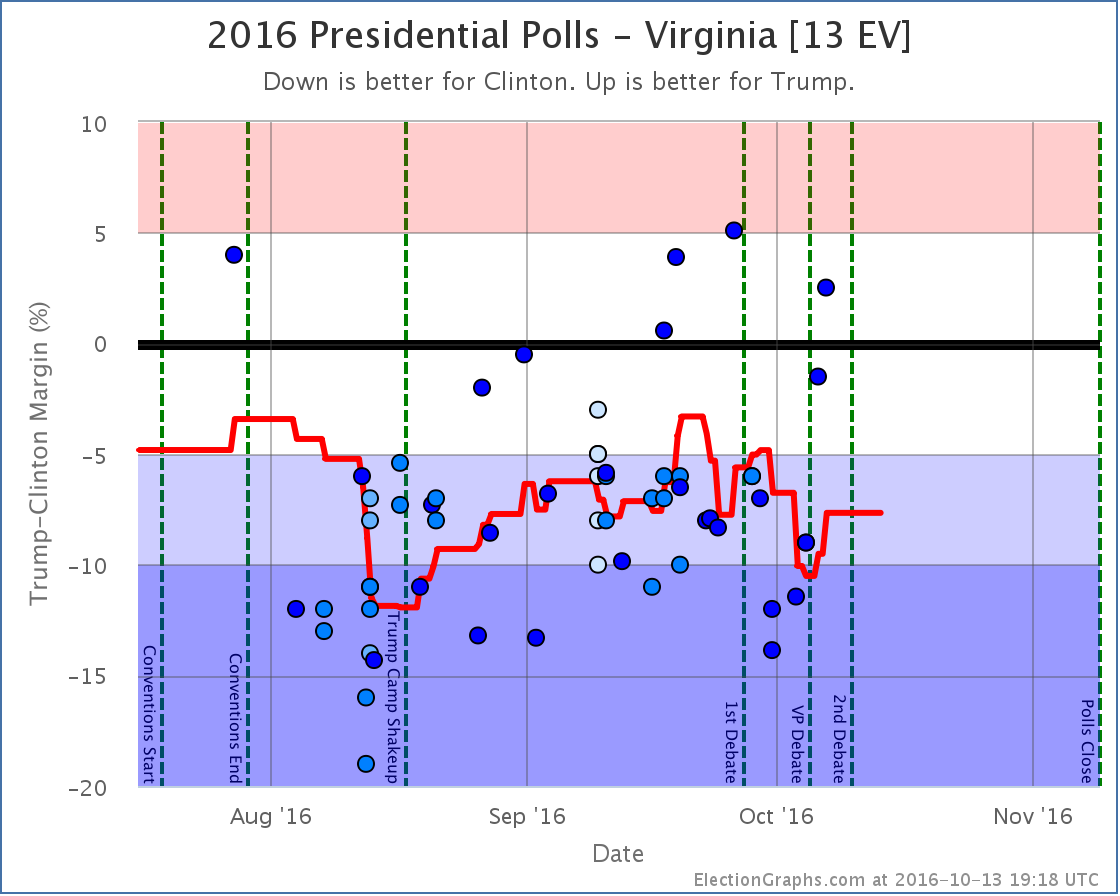
But meanwhile, polling changes in Minnesota, Virginia, and Pennsylvania moved the tipping point further toward Clinton, meaning that overall Trump has to move polls even further in order to actually flip the results of the election.
And Clinton expanded her best case a bit as well.
Here are the charts:
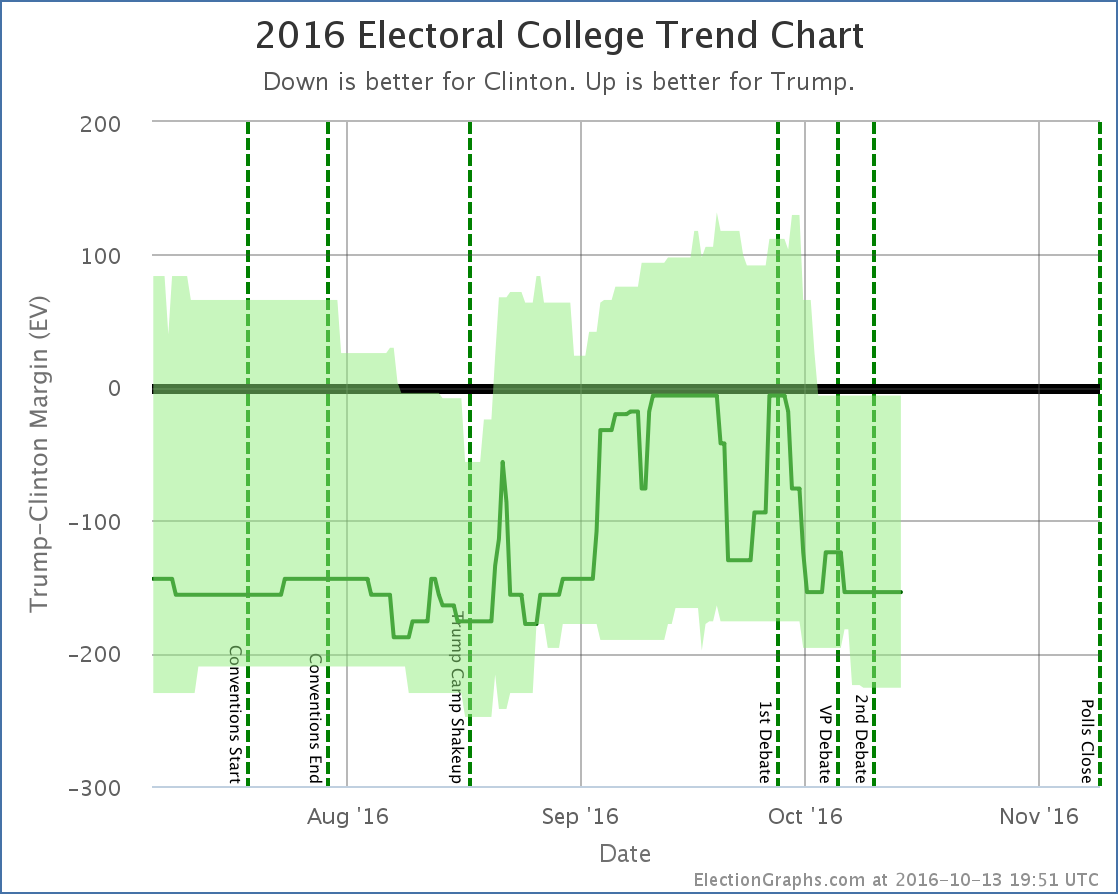
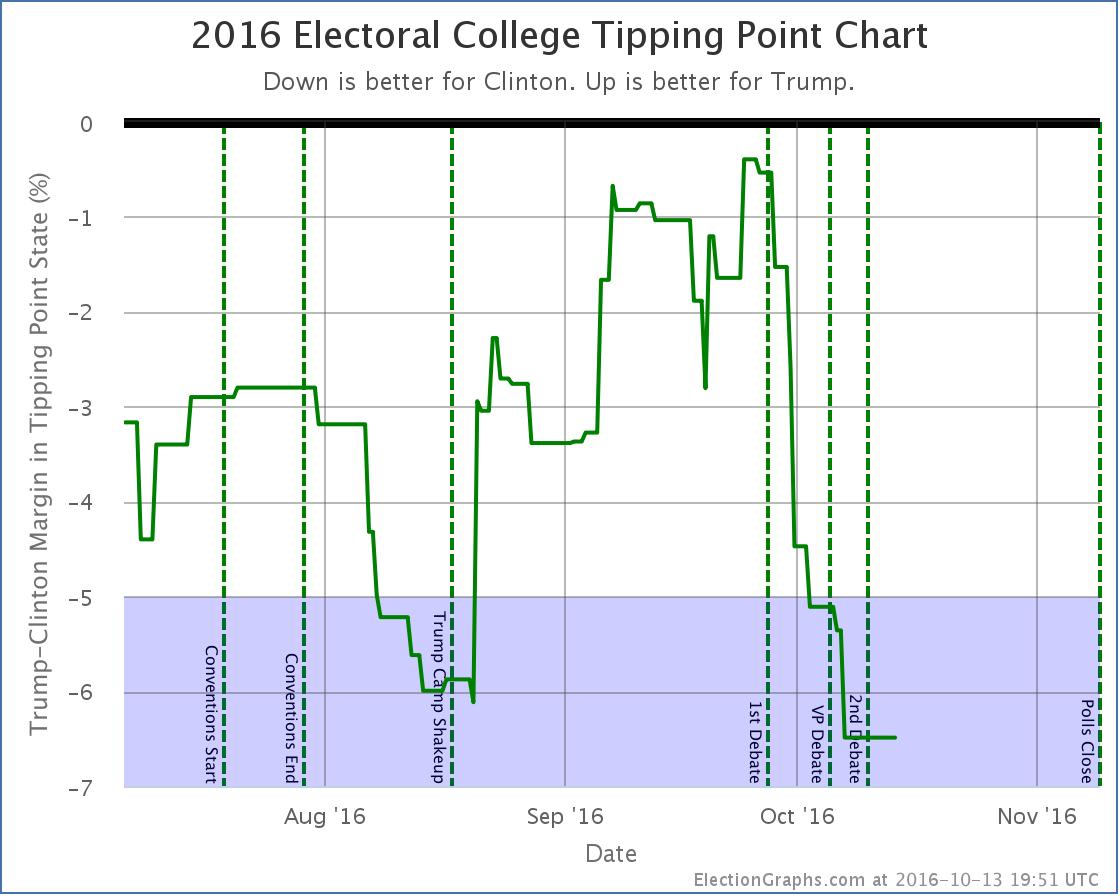
The trend in both charts is clear. After peaking right before the 1st debate Trump has been falling. This is more dramatic in the tipping point chart, but it is clear no matter which way you look at the race.
There is no time left for a Trump comeback from behind win from these levels. It would take something massive that would completely reverse everything we know about this race so far. It would be an unprecedented reversal. Impossible? No. Incredibly unlikely? Yes.
A few weeks ago Trump had managed to make this race close. But it was short-lived. Starting with the debate he has been dropping steadily. We don’t yet have signs that we have hit bottom either. There have been new negative stories about Trump almost every day. Further drops would not be surprising.
We’re no longer really talking about who will win this election. Clinton will win this election. The only question is by how much.
25.8 days left until we have the first actual election results.
State Details
Weak Clinton to Weak Trump
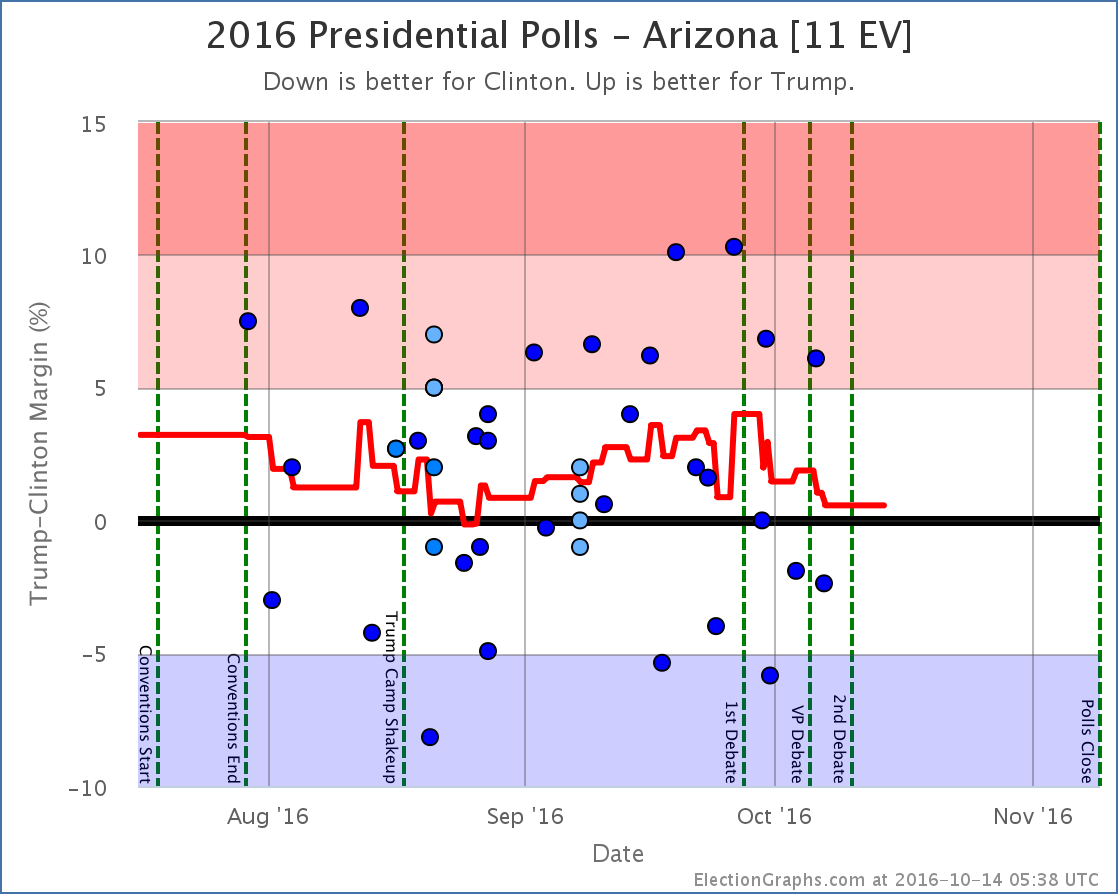
The latest polls not only move Arizona from Weak Clinton to Weak Trump, but since older polls were added, they actually moved the past curve Trumpward, such that we no longer have a recent period with Clinton in the lead at all. The trend has still been away from Trump toward Clinton since the 1st debate, but Clinton hasn’t pulled Arizona over to her side quite yet.
Moving into Clinton’s reach
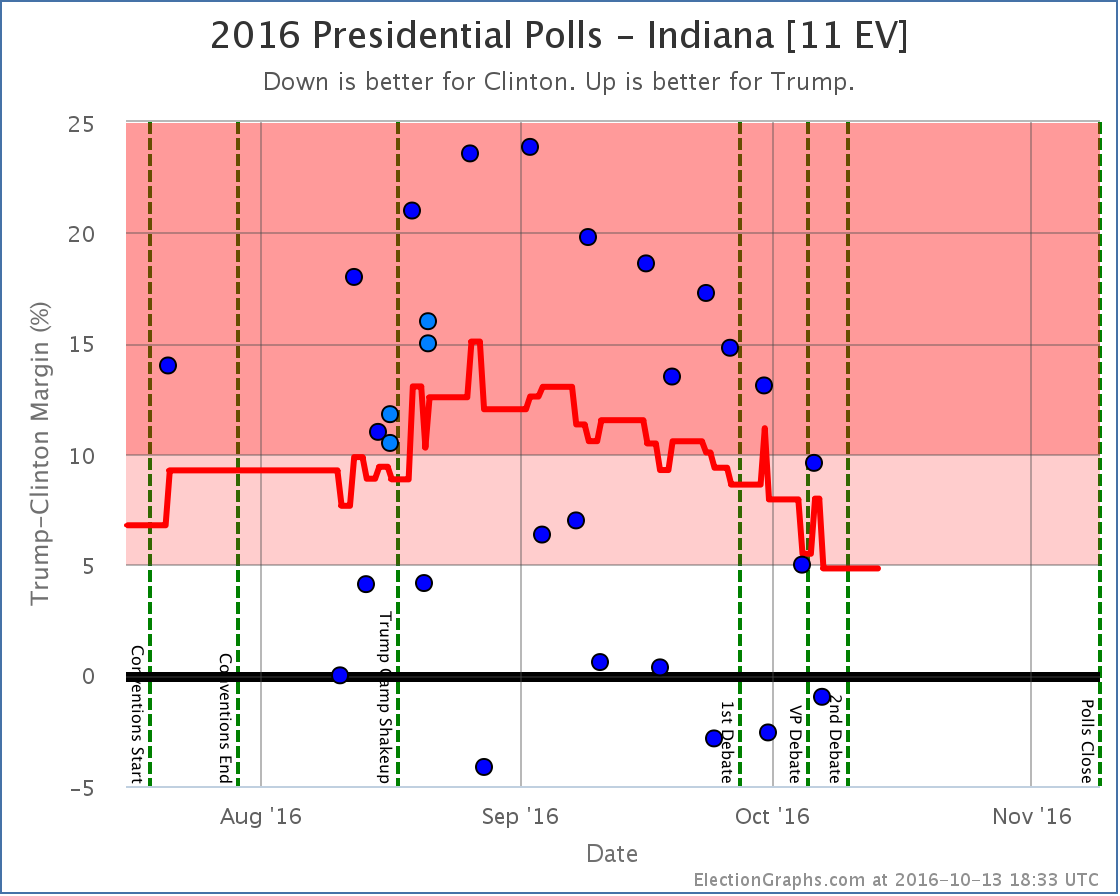
Trump’s lead in Indiana has been diminishing since late August. With the latest updates Trump is up 4.8%. Trump still leads, but it is now close enough that a Clinton win does not seem impossible. Still a stretch to be sure, but no longer unimaginable.
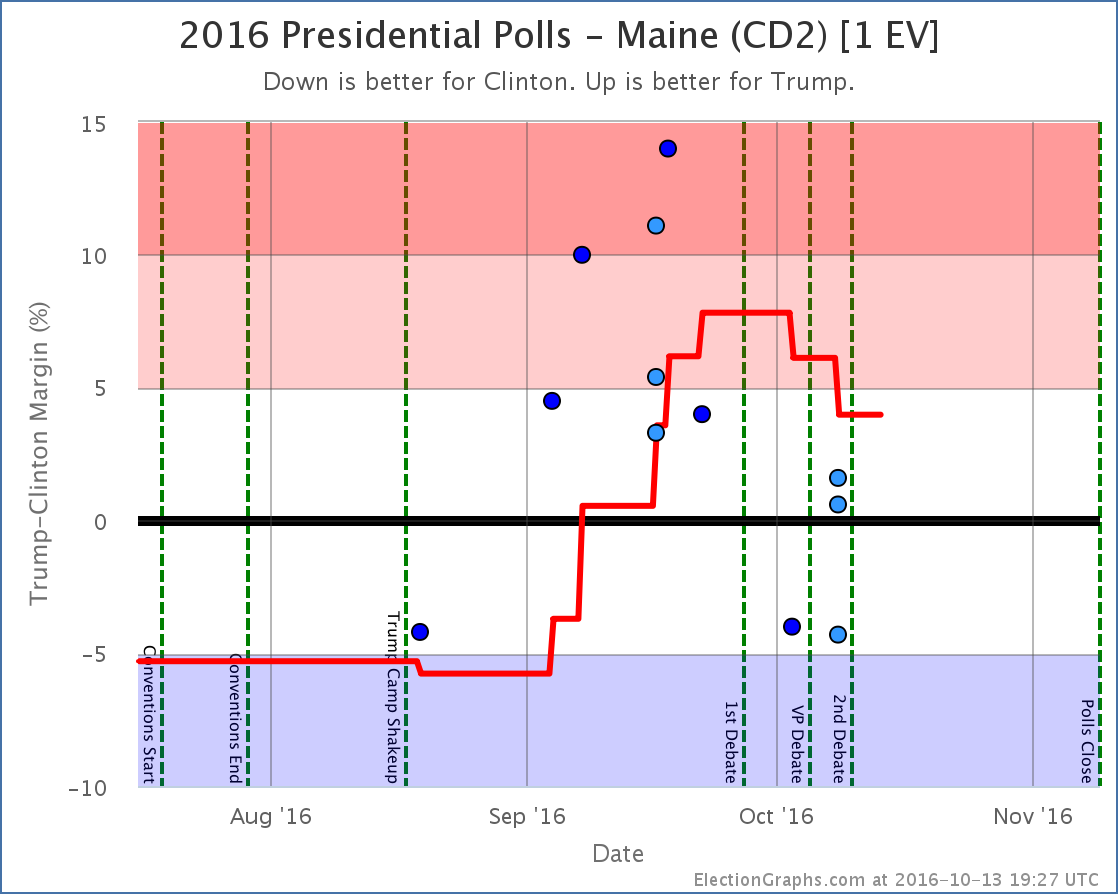
Maine’s 2nd congressional district had looked like it would definitely split from the state this cycle giving Trump a somewhat unusual pickup. With the post-debate polls, Trump still leads, but his lead is slipping, and so it now seems that this single electoral vote is now up for grabs. Clinton could steal it back.
States that moved the tipping point
For more information…
This post is an update based on the data on ElectionGraphs.com. Election Graphs tracks both a poll based estimate of the Electoral College and a numbers based look at the Delegate Races. All of the charts and graphs seen in this post are from that site. Additional graphs, charts and raw data can be found there. Follow @ElectionGraphs on Twitter or like Election Graphs on Facebook to see announcements of updates or to join the conversation. For those interested in individual general election poll updates, follow @ElecCollPolls on Twitter for all the polls as they are added. If you find the information in these posts interesting or useful, please consider visiting the tip jar.
[Blog Post] Electoral College: Trump drop continues (mostly) https://t.co/7UT0M0f9dl
RT @ElectionGraphs: [Blog Post] Electoral College: Trump drop continues (mostly) https://t.co/7UT0M0f9dl
Plummet to come
Seriously, we are already calling the election for Hillary? I’d think with so much volatility, a Trump resurgence would be only a little unlikely.
This makes me think of the recent Brexit and the Brazil peace accord plebiscites. In both, statisticians predicted the result so confidently that the predicted winner’s voters didn’t bother to show up. Some even voted contrary to their true feelings, just to lodge a protest. And thus, due to a poll, the election outcome was changed.
I think polls should be seen as quantum mechanical objects: any attempt to measure a populace also affects the underlying reality.
Rebecca Hersh liked this on Facebook.
Richard Moraille liked this on Facebook.
Ben,
Nobody is calling the result officially, nobody can until votes are counted. However pundits, experts, politics watchers, bookmakers and amateur poll watchers alike are all of a similar opinion…
A DT rebound is not impossible, but it would be completely unprecedented in US elections.
538 has HRC at 90% to win
Sabatos crystal ball has HRC winning
Cook report has HRC winning
Politico has a panel of Dem and Rep activists in a number of states. They believe HRC will win.
And so on…
As for polling predictions meaning winners don’t turn up to vote…
IF and only IF those voters are following polls and are not enthusiastic enough to believe their vote will make a difference.
You can argue that the losers don’t vote because their team is losing as well, or maybe that the losers are more energised by the polls to make an effort.
I can also assure you, the brexit decision was not influenced by one or two polls. A huge combination of factors, including some which DT is using to appeal to his own supporters and may have got him the nomination. Nationwide dissatisfaction with the EU, immigration, financial considerations and a dose of lacklustre campaigning all contributed to brexit.
Personally I don’t see how DT can win. Internal party squabbling, VAT returns, open mic tapes, accusations, bad debates, lack of fundraising, lack of adverts, appealing to the base only, public spats with vet families/miss worlds/judges and others, outrageous lies, lamentable ground game and whatever else….
Maybe, just maybe, he can pull enough discipline to have a good final debate and stay on message for the final few weeks. Enough to pull a close result, but I doubt a win.
On the other hand, a complete collapse in support and double digit DEM win which hands over the Senate and House is not beyond the realm of possibility.
My prediction?
At the moment Madame President is likely, I wouldn’t be surprised if she hit 400+ EV as well. Dem Senate by a couple of seats at most, but the House is currently looking a bridge too far. If DT makes a mess of the final debate though, that will very likely change!
As an aside..
http://www.electproject.org/early_2016
Has currently tracked returns (not results, no votes counted yet) of absentee and early votes.
Now I know you can’t add these in place of a poll, because they only show returns by affiliation or other demographics, but is there any way you can show a map to give an impression of these indicators?
Couple things, first on Brexit. Actually, the polls on Brexit pretty consistently showed that it was too close to call for the last few weeks before that election. The polls were RIGHT. There is a myth that they were not. The problem was that the pundits and commentators so completely and totally believed a Brexit win was impossible that they IGNORED the polling showing it was actually a very close race and kept talking about all the reasons why the polling had to be wrong. The lesson from Brexit is not that polls can be wrong, it is actually the opposite… when polls tell you something you don’t like, perk up your ears and actually pay attention! They may know something you don’t!
In terms of “calling the race”… basically what Richard said. :-) While the kind of swing needed for Trump to catch up and win is not impossible, it is very unlikely. The sites that give actual odds seem to vary from a 13% chance of a Trump win at the high side, down to a 0.2% chance at the low side. I think the ones that are under 1% are closer to right here.
He is just running out of time, and the recent news cycles he’s had have been devastatingly bad. And he has NEVER been ahead in this race by most measures. (RCP had him ahead for a couple days once, my site showed him ahead for a few hours while I was in the middle of a round of poll updates, but it was erased as I added more polls.)
To win at this point Trump would have to turn things around completely, and start having really good weeks while Clinton had really bad weeks all the way from now until the election, and then the Clinton news would have to be so bad that it wasn’t just undecideds sloshing back and forth, but actual real Clinton supporters deciding not to support her any more.
Trump would have to rally everybody who had ever supported him back to him again, plus start reaching new people. And he just doesn’t even seem interested in doing that at the moment.
I would not be surprised if the race tightens a bit between now and election day. (I also would not be surprised if Trump falls further.) I’m half way through a round of poll updates right now, and at the moment it looks like an improvement for Trump off his lows (that may still change though).
But it is one thing to say things will improve a bit for him, it is another to think he can actually catch up and win. I think at this point it would take an absolutely huge event that fundamentally “changed everything” to make that happen.
Nothing is impossible. This just seems unlikely enough that I felt confident making my statement that “We’re no longer really talking about who will win this election. Clinton will win this election. The only question is by how much.”.
Oh, and Richard… I’m not sure you can really translate early vote results DIRECTLY as a poll substitute, although it may tell you something. I don’t think I have seen anybody do maps based on it yet, but elect project.org is the go to place for tracking early vote, so if anybody makes one, it is probably going to be Michael McDonald (who runs that site).
Unfortunately he only has the spreadsheet that I can find. I don’t know how to translate that into a visual myself, and being on a iPad instead of a PC doesn’t help.
I know early returns are not compatible with polling in any way. This isn’t actual votes, just voters. I was more curious as to who, in terms of party identification, is ahead as far as early and absentee votes. It is reasonable to say that if self identified or registered Dems have a lead in early votes, it’s more likely HRC is leading and the opposite is reasonable for Reps.
It doesn’t mean it’s true or accurate, but it’s still more information that can be seen when weighing the state of play.
That’s very interesting about the Brexit polling affecting the outcome being a myth. Do you have a source I could read up on that? It sounds like there was still a popular *opinion* that Brexit would fail, regardless of the actual polls. (See Predict Wise which had an astonishing graph of the Brexit results where the odds suddenly invert as the actual results start coming in.) And there certainly were a lot of anecdotes on the tele of UK voters wanting a “do over” since they had only voted for Brexit because they were sure it would lose. My hunch is, popular opinion of the outcome affected the vote, even if the polls didn’t back up that opinion. But I’d love to see any evidence one way or the other.
I completely understand wanting to be able to say that, “Clinton will win this election. The only question is by how much.” I’m not complaining. Heck, I’ve said the same to calm some nervous relatives. But it seems, given that much of your audience likely has a good grasp of statistics, you could say something more nuanced, like,
“It is overwhelmingly likely that Clinton will win as a shift of more than 5% of the population in under a month (or, whatever fact it is we’re basing the prediction on) is unprecedented. {\footnote Caveat, this entire season has been a series of unprecedented events.} Other sites are giving Trumps odds below 13%, which is like flipping three pennies and seeing them all come up tails — unlikely, but not impossible.”
…Yeah, okay, reading my suggested wording over, it is a little garrulous, while “Clinton will win,” has a better ring to it. :-) If I was certain that such confident statements did not affect elections, I’d probably not mention it at all.
In terms of how I word things, I’ve given longer elocutions like you suggest, talking about the fact that a change from this point would be unprecedented, the odds given by other sites, etc. I’ve also linked to the 538 explanation of that. But it seemed plainer language is useful at some point. I’ve given all the caveats before. :-)
In terms of Brexit, it is not that the polls did not affect the outcome. There is always a feedback loop with people paying attention to the polls and that potentially changing their behavior. The myth though is that the polls were wrong for Brexit. People keep insisting that the polls said Brexit would lose, and so it was a shock when it won.
The reality though is that the polls consistently showed Brexit was too close to call. You can see that in the pollster average: https://elections.huffingtonpost.com/pollster/uk-european-union-referendum
You are right that the betting markets did not show this. And the pundits did not say that. Coverage was full of people explaining why the polls were clearly wrong, and the undecideds would break toward Stay, and all sorts of other reasons why the polling should be ignored because of course the vote was going to be for Stay. These pundits and betting markets were wrong. The polls were not. They said that it was a super close race that could go either way. And it was.
Thanks for the Brexit link. Curiously, it looks like “remain” was indeed up in the polls right before the vote, but by only the slightest of hairs. I take your point, though, and note that “leave” had consistently polled better for the three weeks immediately prior.
The LA Times just released an article exactly about this topic, “Could we be headed for another ‘Brexit'”: http://www.latimes.com/politics/la-pol-essential-politics-20161021-snap-story.html . (Summary: Albusme is completely right. This is not a “Brexit” situation.)
Unfortunately, the LA Times didn’t answer my most burning question: regardless of the actual polls, did popular opinion of a forgone result affect the outcome on Brexit?
And, in general, if people are told that the lesser of two evils is inevitable, are they more inclined to vote for the greater evil? There was certainly anecdotal evidence for that in Brexit. (https://www.youtube.com/watch?v=he9FQ2xTD9o) Likewise, the Brazilian peace accord was portrayed as “fait accompli” (the president was slated for the Nobel Peace Prize) before the plebiscite. The current wisdom is that, given that it was a done deal, hardly anyone turned out to vote… except the people who saw the accord as imperfect and wanted to throw in their two-centavos.
Brexit was not seen as a foregone conclusion either way by the average guy on the street.
As in any election anywhere, some people (a mix of experts, pundits, activists and others who weigh in on such things) were convinced that their side would win.. no matter what!
Have a look at this..
http://www.bbc.co.uk/news/uk-politics-36616028
And this
http://www.ukpolitical.info/Turnout45.htm
Note that turnout for the referendum was HIGHER than for a general election in a number of years.
There was no real popular opinion with the man on the street as I said. There were just theories and opinions of what would happen if some demographic groups didn’t vote – but the consensus seems to be that no demographic really dominated turnout, or failed to show up, and contrary to some reports the youth vote didn’t collapse.
Finally, have a look at this
https://www.ft.com/content/3236e982-5fb6-11e6-ae3f-77baadeb1c93
And note that media (broadcasters) gave pretty much neutral coverage to the whole thing. Electoral law is a little different in the U.K. when it comes to television. Newspapers can support and report as they wish, but ‘Auntie Beeb’ is supposed to cover in an unbiased manner as far as its news reports go.
Ben,
I think someone has put this together just for you ;-)
http://www.bbc.co.uk/news/magazine-37736161
The key on Brexit is that no matter which result was nominally ahead in either individual polls or even in the averages, the margin was narrow enough that the only right answer was “too close to call” for almost the last month before that election. The people who were convincing themselves that was not the case were the ones deluding themselves by ignoring the poll result. People saying “polls got it wrong” are misreading the polling history.
Now, is it true that because so many people were saying that remain was almost certainly going to win that some remain voters didn’t bother to turn out and therefore pushed a very close race to leave? Quite possibly. But with a close race, pretty much anything you can imagine makes a difference in the results. That’s why it is a close race. :-)