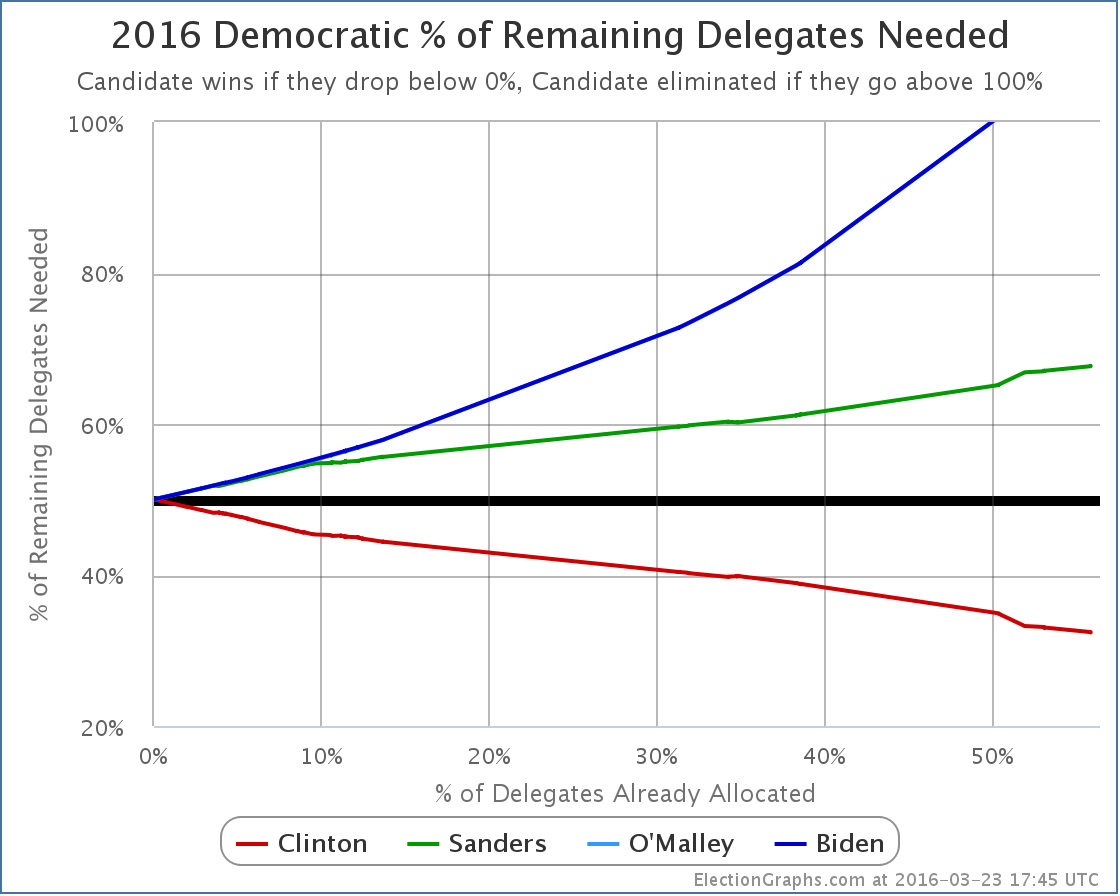
Chart from the Abulsme.com 2012 Republican Delegate Count Graphs page. When a candidate gets down to 0%, they have cinched the nomination. If they get up past 100%, they have been mathematically eliminated. Rather than the date on the x-axis, we show the “% of Delegates Already Allocated” as this better represents the progress through the race. Note that these numbers include estimates of the eventual results of multi-stage caucus processes which will be refined as the later stages occur.
So, Super Tuesday happened. As of this update, Green Papers has “called” 385 of the 419 delegates available from the Super Tuesday contests. There are 34 delegates that haven’t been determined yet that will result in updates later, but of the ones we do know, the estimates for Super Tuesday contests are: Romney 208, Santorum 84, Gingrich 72, Paul 21. Romney also picked up a Superdelegate, bringing the total for the day to Romney 209, Santorum 84, Gingrich 72, Paul 21.
Compared to the Sabato Crystal Ball projections which we used to game out Super Tuesday over the weekend, Romney performed better than expectations, as did Gingrich. Santorum and Paul underperformed compared to those predictions. In any case, where does this put us…
Bottom line, Romney is the big winner today, and this may be the start of him actually pulling away and heading toward the nomination, but he is still not out of the woods in terms of the danger of being blocked from 1144. Lets look at the details.
The situation for Santorum, Gingrich and Paul is essentially what I mapped out in the gaming Super Tuesday post. To paraphrase what I said there, it is now absolutely undeniably clear (although the trend was obvious even before today) that none of these three guys are on a path to the nomination. Of the three, Santorum is doing the best, but with today’s numbers, to be on a path to win, he would need to now get 64.5% of the remaining delegates, compared to the 21.1% he has gotten so far. For this to even come into the realm of possibility, Gingrich and Paul would both have to stop getting delegates, Santorum would have to pick up all of their support, AND something would need to happen to cause support for Romney to plummet. This is a very unlikely sequence of events. It isn’t going to happen.
Oh, I guess I should also note that Gingrich pulled back ahead of Paul for 3rd place.
The remaining question is: “Are the non-Romney’s collectively still in a position to potentially block Romney from getting to 1144?” If after today, Romney was under 50% of the total delegates, and his “% of remaining needed to win” was heading upward or flat, this is a possibility that would be looking like it was still very much in play. But Romney exceeded the 49.7% of delegates he needed in order to be on track toward 1144, and did it by a decent margin. Of the delegates in today’s total, he picked up 209 of 386, or 54.1%. This reduced his “% of remaining needed to win” from 49.7% to 48.5%. That means to block, the non-Romney’s collectively need to be getting 51.5% of the delegates, compared to the 46.9% they have managed so far. So they have to do better than they have been so far, and by a non-trivial margin. And they have do do this even though it is obvious none of them can win outright. It has to be about stopping Romney.
Now, the rest of March has a bunch of states that are supposed to be relatively good for the non-Romneys. So the non-Romney’s managing to get 51.5% in the next few state is very much within the realm of possibility. After that we hit more Romney friendly states in April. The thing to watch for in the upcoming states is not who wins the popular vote, or even the delegate count. The question will be: “Is Romney continuing to get enough delegates to avoid being blocked?” Right now, that magic number is 48.2%. As long as he is getting 48.2% of the delegates (or more) then he is marching his way toward the nomination. If he gets less than that, then blocking will remain possible a little bit longer. If the rest of March really is friendly to the non-Romneys, we may see that Romney’s “% needed to win” starts heading back up a bit before Romney hits friendly states again and starts fully pulling away. As long as we see that happening, blocking Romney is still a possibility. And indeed, if Romney is damaged by the contests in March and his April states start looking not so good after all, then blocking starts looking more real again.
But Romney’s “% of remaining needed to win” is the smallest it has been so far, and none of the other candidates have realistic shots at winning, only a shot at blocking that relies on them continuing to win delegates even though it is obvious they can’t win, so Romney is in a pretty good position right now. Watch that line though. Until it starts heading downward decisively, Romney hasn’t got it wrapped up just yet.
So what is next? Well, first, the last 34 delegates from Super Tuesday (they are from Georgia, Ohio and Tennessee). Then on Sunday we have Kansas (40), Guam (9), Northern Marianas (9), Virgin Islands (9). Then Tuesday we have Alabama (50), Mississippi (40), Hawaii (20), American Samoa (9). And then it goes on and on…