This is the website of Abulsme Noibatno Itramne (also known as Sam Minter).
Posts here are rare these days. For current stuff, follow me on Mastodon
|
Trump clinched the nomination a week and a half ago but there were a few more contests left. CA/NJ/SD/MT/NM have now weighed in with their 303 delegates. Trump got all 303. As an unopposed candidate at this point, this is not unexpected.
And while the Democrats still have DC left, this is the end of the primary process on the Republican side. There are still 18 uncommitted delegates whose preferences are unknown, but their decisions at this point won’t change much.
Lets look quickly at the updated graphs:
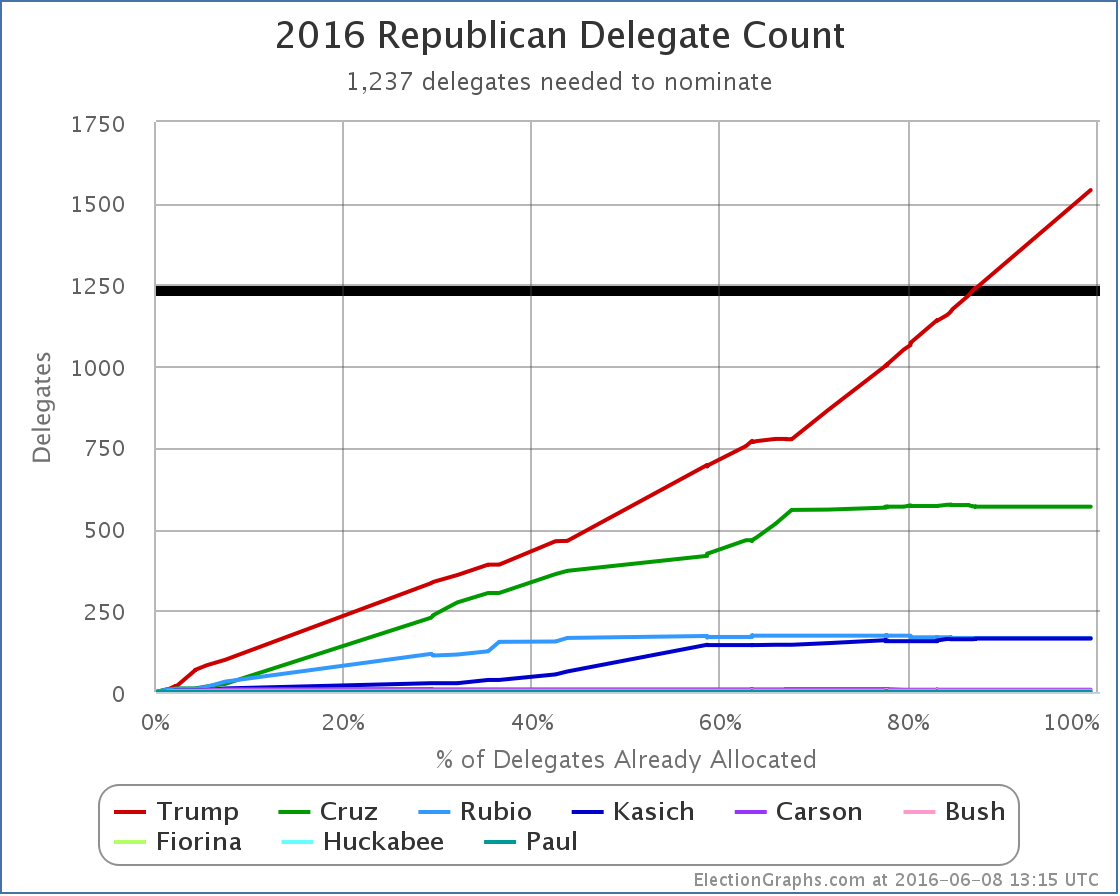
With this update Trump moves from just barely over the “magic number” to well over it with plenty of room to spare. The delegate count is now: Trump 1541, Cruz 569, Rubio 166, Kasich 164, Carson 7, Bush 4, Fiorina 1, Huckabee 1, Paul 1.
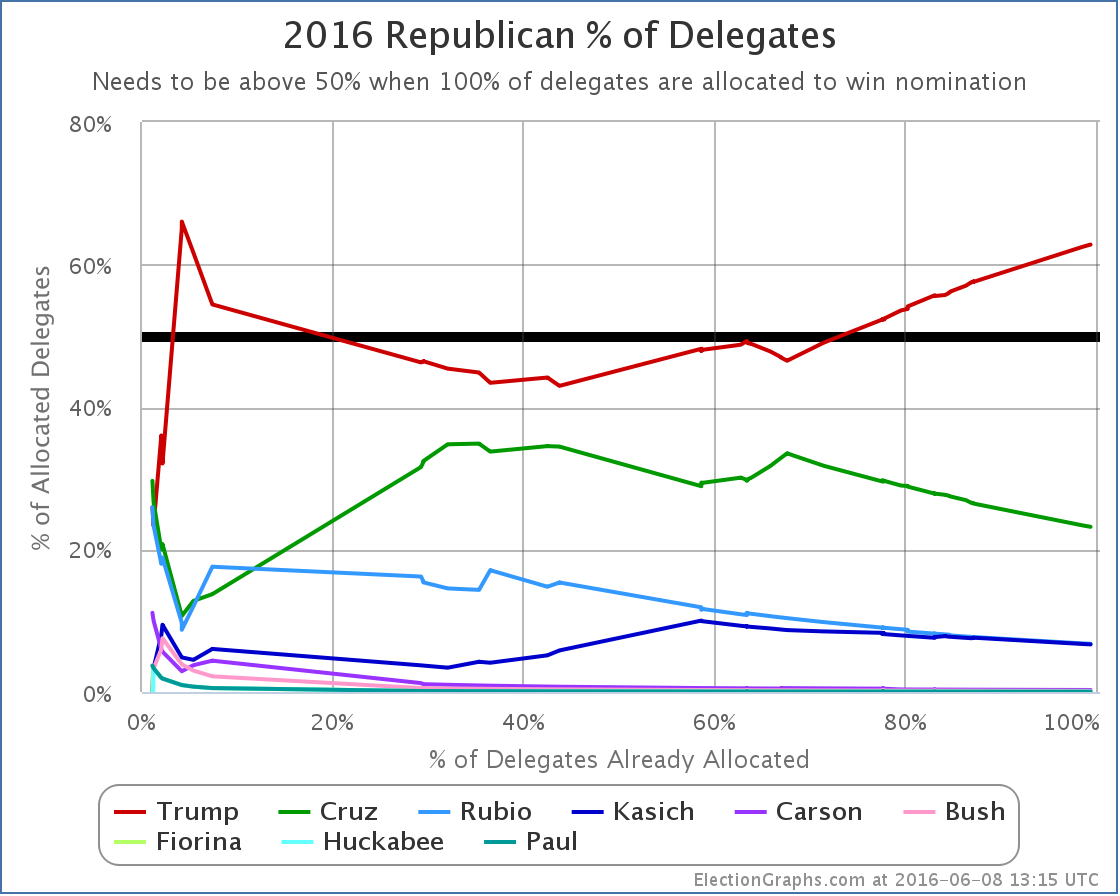
Trump now has 62.80% of the delegates allocated so far.
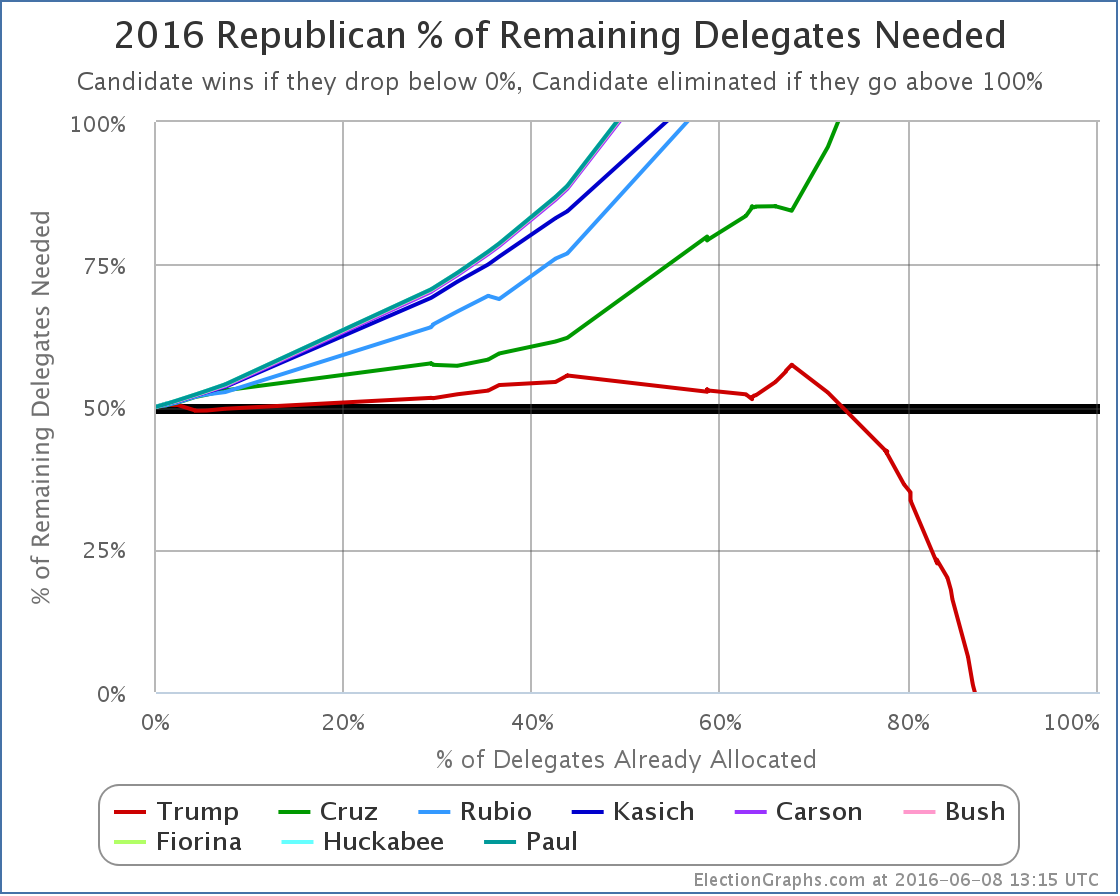
And just for reference, the “% needed to win” in final form.
There isn’t much more to say since this race is over minus any unexpected craziness. If there are any additional developments of note, we’ll update accordingly, but none is expected at the moment.
Time to concentrate on the general election.
Update 2016-06-30 06:00 UTC – Update from Vermont. Net change Kasich -1, Paul +1. (A Kasich delegate who considered themselves free after Kasich dropped out pledged his support to Paul.)
Update 2016-07-20 07:19 UTC: Final Election Graphs estimate was Trump 1541, Cruz 569, Rubio 166, Kasich 163, Carson 7, Bush 4, Paul 2, Fiorina 1, Huckabee 1, TBD 18. We now have the official roll call from the Republican National Convention: Trump 1725, Cruz 484, Kasich 125, Rubio 123, Carson 7, Bush 3, Paul 2, DNV 3. Differences were due to the application of rules in some states requiring all votes to go to candidates that were actually nominated (only Trump was officially nominated at the convention) and movement of additional uncommitted delegates to Trump.
Note: This post is an update based on the data on ElectionGraphs.com. Election Graphs tracks both a poll based estimate of the Electoral College and a numbers based look at the Delegate Races. All of the charts and graphs seen in this post are from that site. Additional graphs, charts and raw data can be found there. Follow @ElectionGraphs on Twitter or like Election Graphs on Facebook to see announcements of updates or to join the conversation. For those interested in individual general election poll updates, follow @ElecCollPolls on Twitter for all the polls as they are added. If you find the information in these posts interesting or useful, please consider visiting the tip jar.
By the Election Graphs count, Clinton now has 2745 delegates, which puts her well over the 2383 require to clinch the nomination.
As they did with the Republicans, AP went out and called many still publicly uncommitted superdelegates and was able to get the winning candidate to the magic number in their count a little earlier than those of us only using public commitments. In this case AP made their announcement Monday. The count here went over the magic number within minutes of the polls closing in New Jersey Tuesday night.
As of the writing of this post, all but 4 straggling delegates from New Jersey out of the 694 delegates up for grabs last night seem to be reasonably determined, so lets run down then numbers.
After Puerto Rico, Clinton only needed 5.05% of the remaining delegates to win. Sanders needed 95.19% of the remaining delegates. Clinton needed 43 delegates, Sanders needed 811.
In CA/NJ/NM/MT/SD/ND Clinton got 391 delegates while Sanders got 299. (As mentioned, there are still 4 TBD from NJ as of this writing.)
In the days between Puerto Rico and the June 7th results coming in, superdelegate changes yielded a net change of: Clinton +14, Sanders +1, O’Malley -1. Yes, that lone O’Malley superdelegate finally flipped… to Clinton.
Total change since Puerto Rico: Clinton +405, Sanders +300, O’Malley -1
That is Clinton 57.53%, Sanders 42.61%. (Adds to more than 100% because Clinton took the one delegate from O’Malley.)
So Clinton met her target, Sanders did not.
405 delegates is significantly more than the 43 delegates Clinton needed to go over the top.
She clinches. She is the presumptive nominee.
Lets check out the updated graphs:
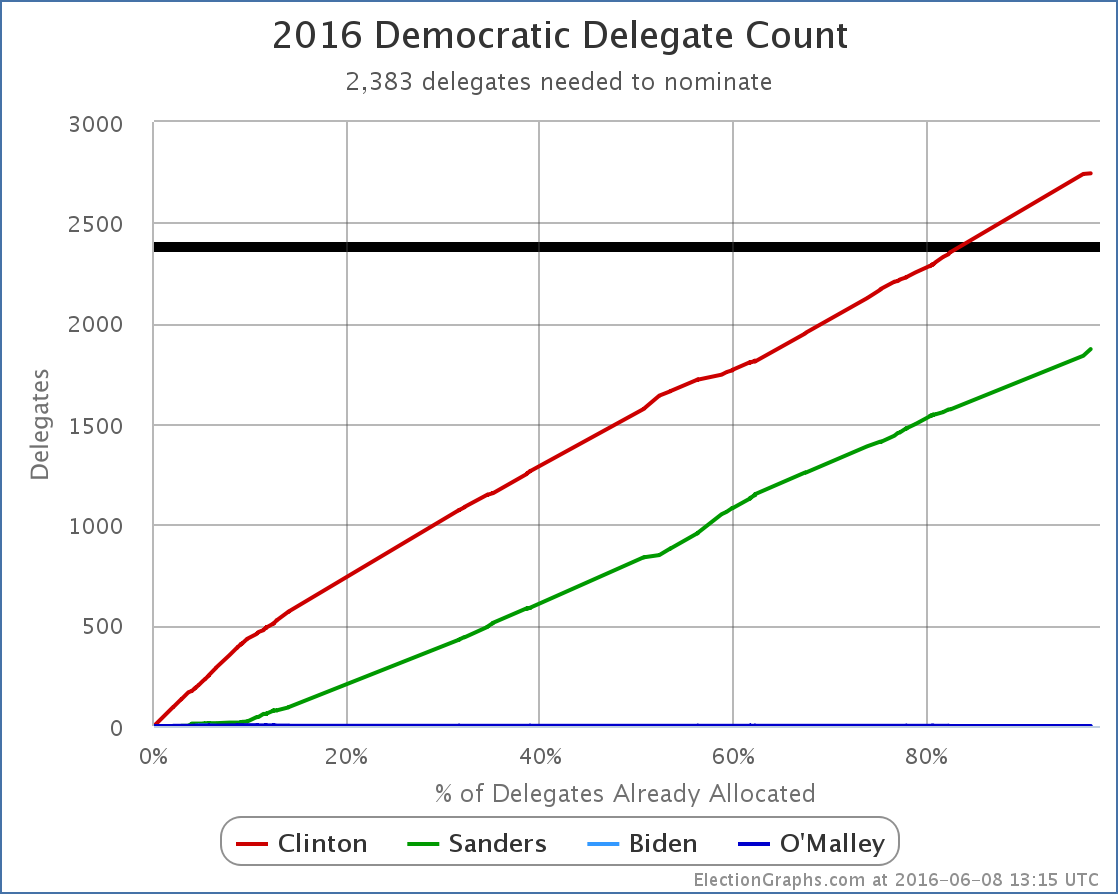
New delegate totals: Clinton 2745, Sanders 1872. Clinton blows past 2383 and is now well beyond where she needed to get.
There are 148 delegates left. Washington DC has 20 up for grabs next week. There are those 4 from New Jersey too. The other 124 are superdelegates who have not yet stated a preference. Clinton needs none of these delegates. Sanders could get every single one of these delegates, and would still lose decisively.
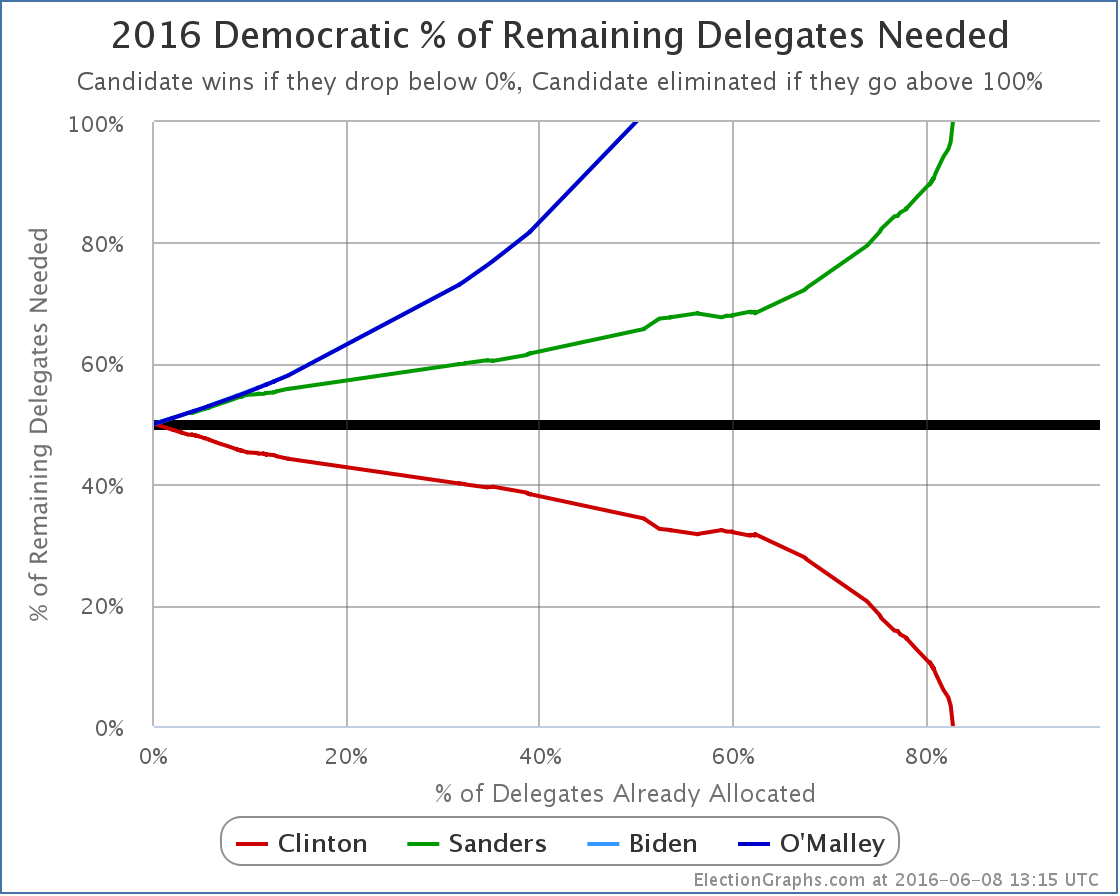
The “% of delegates needed to win” chart is complete. Clinton dropped below 0%, Sanders went above 100%.
One more graph:
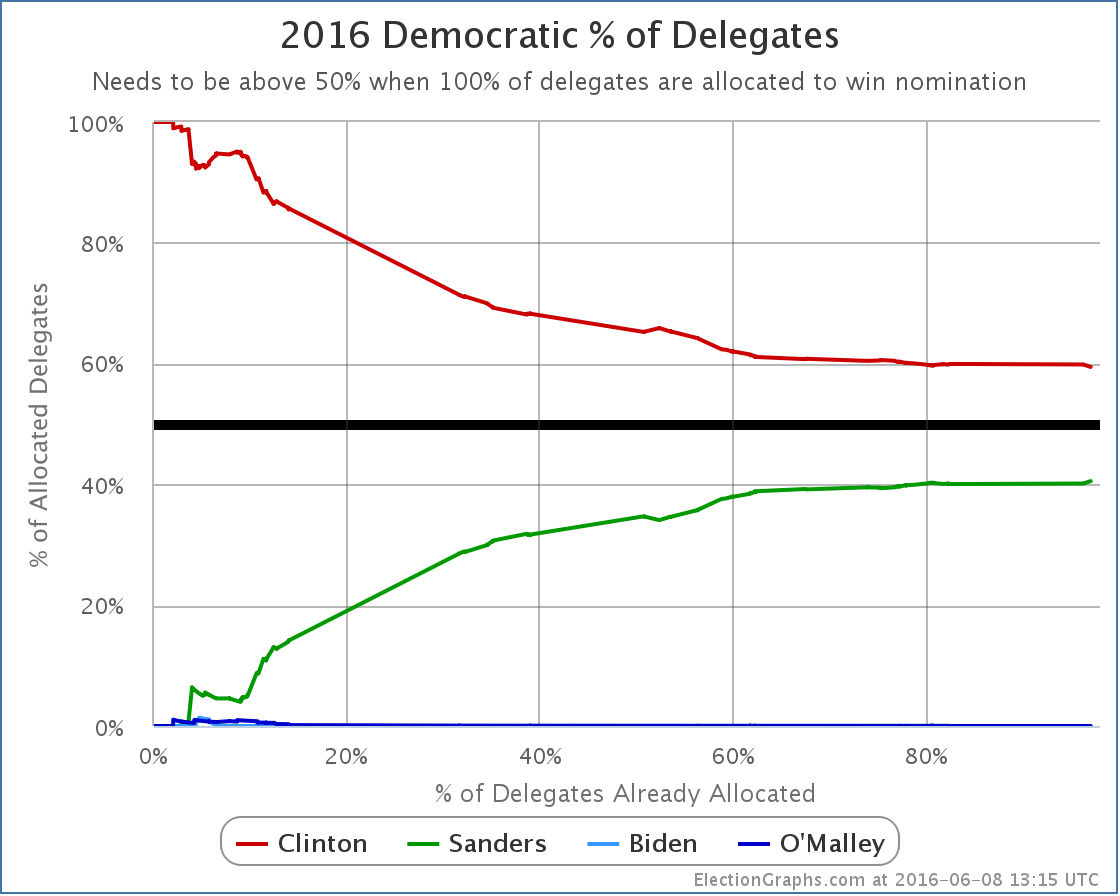
Since she started at 100% of the delegates by getting superdelegates before the first primaries or caucuses even happened, Clinton’s “% of delegates” number of course trended downward through most of the cycle. But for quite some time now the delegate race has stuck pretty close to being a 60% to 40% split in Clinton’s favor. As of now, it sits at Clinton 59.45%, Sanders 40.55%.
OK, now to step back a little…
Clinton dominated this race from the beginning. There were only a handful of moments where Sanders even managed to close the gap a little bit. Sanders was never even close. It was clear since the beginning of March… at the latest… that is being generous… it was fairly clear even before that… that Sanders catching up would take a miracle. The one thing that has been amazing throughout the primary process is the ability of many Sanders supporters to be in complete denial about this in the face of overwhelming evidence. It is one thing to be enthusiastic about your candidate and even to hope for that miracle, but it is another thing to not even recognize that you are losing and that it would indeed take that miracle to win.
And yes, some of those Sanders folks are still in denial even now. Because superdelegates. So a quick look. Right now we have Clinton 2745, Sanders 1872. There are 124 remaining superdelegates. Lets give them all to Sanders. For fun give Sanders all 20 DC delegates and the 4 from New Jersey too. Now we have Clinton 2745, Sanders 2020. All delegates are now allocated. Sanders is still short. To get to 2382 he would need at least 182 delegates who have committed to Clinton to change their minds and vote for Sanders instead. Clinton has 532 superdelegates by the latest count. So that means 34.2% of the superdelegates currently committed to Clinton would have to flip.
They would have to do that flip in the face of Clinton having won the popular vote (even if you include estimated popular vote for caucus states), Clinton having won the pledged delegate count, and Clinton having won the most states. Not to mention significant numbers of the superdelegates not simply being lukewarm Clinton supporters, but being people who she has actively cultivated for many years, a good number of which have actually been active in her campaign.
Is it mathematically possible? Yes. Of course it is. Is it going to happen absent something catastrophic happening to Clinton? No.
Some Sanders folks are still holding out the “What if Clinton is indicted?” scenario. My guess is most superdelegates would consider it an unfair and unjust indictment and stick by their candidate. It probably wouldn’t be enough. Perhaps I suppose. It is a stretch though. More realistically it would take a debilitating health issue or some brand new scandal so serious it dwarfs everything that has come up so far. Can you imagine these sorts of things? Of course. But they are all unforeseen unpredictable types of event, not things you decide to continue a campaign based on. After all, there are ways Martin O’Malley can still win the nomination too!
You can conjure similar scenarios on the other side too of course, but absent that kind of craziness, we now have our nominees in both parties.
So we have Clinton vs Trump. Time to start focusing on the general election analysis!
153.4 days until polls start to close on election day!
Update 2016-06-12 17:16 UTC – Superdelegate update. Net Change: Clinton +11
Update 2016-06-12 17:43 UTC – Missed one change in the superdelegate update above. Additional Change: Clinton -1. (So Clinton +10 for this day’s scan.)
Update 2016-06-12 18:02 UTC – Updates from California, New Jersey, and South Dakota (including the remaining 4 TBD delegates from New Jersey). Net change: Sanders +4.
Update 2016-06-15 01:40 UTC – Superdelegate update. Net Change: Clinton -3, Sanders +1.
Note: This post is an update based on the data on ElectionGraphs.com. Election Graphs tracks both a poll based estimate of the Electoral College and a numbers based look at the Delegate Races. All of the charts and graphs seen in this post are from that site. Additional graphs, charts and raw data can be found there. Follow @ElectionGraphs on Twitter or like Election Graphs on Facebook to see announcements of updates or to join the conversation. For those interested in individual general election poll updates, follow @ElecCollPolls on Twitter for all the polls as they are added. If you find the information in these posts interesting or useful, please consider visiting the tip jar.
Edit 15:19 UTC to mention the 4 delegates from New Jersey in the list of remaining delegates and the calculations for superdelegates flipping.


|
Romney |
Obama |
| Romney Best Case |
264 |
274 |
| Current Status |
206 |
332 |
| Obama Best Case |
205 |
333 |
A bunch of states were called between 04:00 UTC and 04:15 UTC:
- Obama: CA, HA, WA, WI, IA NM
- Romney: ID, MT, NC
Only one of these mattered. Iowa. Iowa was a close state. Romney needed every close state he had left in order to win. Without Iowa, even if Romney swept every other close state (and Maine’s 2nd) he would only get to 264.
When CNN called Iowa at 04:09 UTC, I called the race on twitter in these two tweets. Nine minutes later when some more states came in, CNN called the election for Obama. They were slow. More on those next states in the next update.
Anyway, Obama wins reelection!

Three states change category today, but before I get to those, let me highlight changes to the chart showing the trend over time. I’ve zoomed in to show only the time period since August and have annotated some of the notable events of the campaign in these last few months. So a few thoughts on what you can see here…
First of all, you can easily see that the two events that seem to have the most visible impact are the 47% video and the 1st debate. But it is also clear that Obama’s peak was quite a bit before the first debate. I searched for specific news events around the date of that peak, but I didn’t find anything particularly memorable. So one interpretation is simply that folks who had moved based on the 47% video started to bake that in and think maybe the whole thing was overblown, so movement back toward Romney began.
Second, it is pretty clear that Romney peaked between the VP debate and the 2nd presidential debate. Obama began to recover slightly before the 2nd debate. The overall trend has been toward Obama since then. (Even with today’s movement toward Romney on the “Current” line.) Romney’s October peak was beyond his beginning of September high, and therefore higher than I thought it would be. But at this point Romney has still NEVER taken the lead in my analysis. The “Current Poll” line has always shown an Obama lead. Romney has never been ahead in this race. Never.
Third, for all but a few short periods of time, Romney’s best case, if he were to win all the swing states, includes winning. Romney can indeed win. It is not out of the realm of reasonable possibility. It is close enough that either campaign events that move things in the last week and a half or just Romney over-performing the polls by a few percent on election day could result in a Romney win.
But Obama’s lead is real and persistent, and has been in place all year. If we just have a ho hum continuation of the campaign as it has been straight through election day, then Obama wins. Something has to happen to push Romney into the lead.
Obama has to make a big mistake, or Romney has to do something outstanding that is unexpected, or some news event has to make Obama look bad on the eve of the election. Something. With the status quo, Obama wins the electoral college. (As we mentioned Wednesday, the popular vote is another story.)
OK, now lets review the states changing categories today:

Not much to say here. The five poll average had briefly topped 10% in Montana. Now it drops below that line again. This puts Montana back into the category it has “normally” been in. Romney has a 9.0% lead in Montana. Romney will win Montana. This state is not in contention.

Same kind of thing here. Romney’s lead in the five poll average goes over 10% in Indiana. This is a big move compared to 2008, when Obama won the state by 1.0%, but Indiana has never been close in 2012. It is just an even bigger lead for Romney now. Romney is ahead by 11.0% in Indiana. Romney will win Indiana. Indiana is not in contention.

Unlike the others, Florida actually is moving from one candidate’s column to the others. And it is a big state. So this is significant, right?
No.
Prior to today’s update the five poll average had Obama up by 0.6%. With today’s new data, the five poll average has Romney up by 0.8%. These numbers both reflect the same thing… Florida is too close to call.
Florida has moved back and forth across the line many times this year. There has been no significant movement in either direction to indicate that Florida is moving definitively toward one candidate or another.
It is close. We’ll know which way Florida goes on election day.
So, this gives us a new map and summary:

|
Romney |
Obama |
| Romney Best Case |
301 |
237 |
| Current Status |
235 |
303 |
| Obama Best Case |
191 |
347 |
Once again, since the best cases include both candidates winning, we need to look at the specifics of the close states:
- North Carolina (15): 2.4% Romney lead – 2/5 polls after last debate
- Florida (29): 0.8% Romney lead – 5/5 polls after last debate
- Virginia (13): 0.2% Obama lead – 5/5 polls after last debate
- Iowa (6): 1.2% Obama lead – 2/5 polls after last debate
- New Hampshire (4): 2.2% Obama lead – 2/5 polls after last debate
- Nevada (6): 2.4% Obama lead – 5/5 polls after last debate
- Ohio (18): 2.5% Obama lead – 4/5 polls after last debate
- Colorado (9): 2.6% Obama lead – 5/5 polls after last debate
- Wisconsin (10): 3.2% Obama lead – 2/5 polls after last debate
Once again Romney starts at 191 electoral votes with no close states. Add in North Carolina and Florida where he is ahead and he is up to 235. That leaves him 34 electoral votes short.
Going in order by how easy it should be for Romney to pull ahead, add in Virginia, Iowa, New Hampshire and Nevada… all of which Romney is behind in at the moment… and you get to 264. Still five electoral votes short.
And that brings us once again to Ohio. To win Romney has to get most of the states mentioned previously, but then also win Ohio. (If he wins Ohio, he could afford to lose some combinations of Virginia, Iowa and New Hampshire, but generally speaking if Romney wins Ohio, he will probably win those other states too.) Obama’s lead in Ohio has been increasing. On Tuesday Obama’s lead in Ohio was 1.2%. It is now up to 2.5%. Will that hold? Who knows.
But as we get closer to the election, 2.5% starts to morph from looking like a small number, to looking like a large number. In the last year Romney has NEVER been ahead in the five poll average in Ohio. It has usually been close. But Romney has never been ahead. Never. Ohio is indeed looking like a firewall.
A uniform move in the polls of any more than 2.5% toward Romney across the close states would give Romney the election. But Romney is running out of time, and most people have made up their minds.
This is once again looking like a steep uphill climb for Romney. Not impossible. It could happen.
But it is not looking good for Romney.
Note: Chart and map from the Abulsme.com 2012 Electoral College Prediction page. Both assume Obama vs Romney with no strong third party candidate and show polling as it currently exists. Things will change before election day. On the map red is Romney, blue is Obama, gold states are too close to call. Lines on the chart represent how many more electoral votes a candidate would have than is needed to tie under several different scenarios. Up is good for Obama, Down is good for Romney.
[Edited 2012 Oct 26 23:58 to correct chart of Florida polls over time. While my text was correct, I inadvertently included a chart missing some recent polls. Fixed. I also slightly adjusted some of the arrows on the electoral college trend chart.]


Only one change today, Montana moving toward Romney:

So, although there was some speculation about Obama contesting Montana in 2008… and he did end up making it close, losing the state by only 2.3%… this time around nobody has been talking about Obama trying to win Montana. Although there was one individual poll in April showing Obama only behind by 2%, the five poll average has never shown Obama closer than 6% behind Romney. For most of the year Montana has been in the “Weak Romney” category, meaning Romney is relatively safe, but if something major happened… perhaps a mirror image of the Obama decline after the first debate… then the state might become competitive.
Instead, we see Romney’s lead on an increasing trend over the past few months, and with today’s update, Romney’s lead is now at 10.7% over Obama. So Montana moves to “Strong Romney”… essentially meaning that even if Romney completely implodes, he’d probably still win Montana.
Since Montana isn’t even close to the competitive zone, this does not affect our models:
|
Romney |
Obama |
| Romney Best Case |
301 |
237 |
| Current Status |
248 |
290 |
| Obama Best Case |
191 |
347 |
The race remains close. Obama is ahead. Obama has always been ahead. Romney still has NEVER taken the lead in my model.
But if Romney wins all the states he is ahead in, he is only 21 electoral votes short of a 269-269 tie. He can get those 21 electoral votes in a variety of ways. Assuming Romney holds his current leads in Florida (29 ev, 0.4% lead), North Carolina (15 ev, 2.8% lead) and Virginia (13 ev, 4.0% lead), probably the easiest way to a victory right now is to win Ohio (18 ev) where he is only behind by 2.8% in the five poll average today, and then win any one of New Hamphire (4 ev, behind by 0.6%), Colorado (9 ev, behind by 1.3%) or Iowa (6 ev, behind by 2.5%). Of course, if he is winning Ohio, he will probably be close in Wisconsin (10 ev, 2.8% behind) and Nevada (6 ev, 3.9% behind) as well, and either of them would do the trick too.
As of my sweep of polls a few hours ago, we only had TWO state level polls that finished after the second presidential debate. One in North Carolina and one in Ohio. The North Carolina one slightly improved Romney’s position but not enough to recategorize North Carolina, while the Ohio one had no affect on the five poll average at all, as it matched the margin of the poll it replaced in the average. Bottom line, no where near enough data to judge the effects of the second debate. Maybe in the next few days.
Note: Chart and map from the Abulsme.com 2012 Electoral College Prediction page. Both assume Obama vs Romney with no strong third party candidate and show polling as it currently exists. Things will change before election day. On the map red is Romney, blue is Obama, gold states are too close to call. Lines on the chart represent how many more electoral votes a candidate would have than is needed to tie under several different scenarios. Up is good for Obama, Down is good for Romney.


Chart and map from the Abulsme.com 2012 Electoral College Prediction page. Both assume Obama vs Romney with no strong third party candidate. Both show polling as it currently exists. Things will change before election day. On the map red is Romney, blue is Obama, gold states are too close to call. Lines on the chart represent how many more electoral votes a candidate would have than is needed to tie under several different scenarios. Up is good for Obama, Down is good for Romney.
There are two states changing category today. In order by number of electoral votes:

Nevada moves from a “Lean Obama” swing state into “Weak Obama” territory as Obama’s lead in the five poll average goes above 5% to 5.6%. This is still close enough to 5% that a poll or two in Romney’s direction could easily move this back into swing state territory. For the moment though, this means I no longer consider this one of the states Romney could win in his “best case” scenario. So that best case scenario gets slightly worse for Romney, now with Romney winning by just 278 to 260.

Next, Montana moves from “Strong Romney” to “Weak Romney” as Romney’s lead in the five poll average drops below 10% to a 9.6% lead. Now, make no mistake, a 9.6% lead is still very substantial. Montana is a long way from being a swing state. But with a lead under 10% and a trend moving in Obama’s direction, Romney may want to deploy some resources to defend the state even if Obama’s odds of actually flipping the state are very slim (and they are). Now, Montana is only 3 electoral votes… so maybe Romney won’t bother. But with all of Romney’s paths to victory currently being very narrow ones, every electoral vote counts, so Montana will probably get some attention. Because Montana was not and is not a swing state, this does not however change anything in our summary.
|
Romney |
Obama |
| Romney Best Case |
278 |
260 |
| Current Status |
191 |
347 |
| Obama Best Case |
159 |
379 |
With this new status Romney’s path to victory is holding all of his current Strong and Weak states, then from the swing states winning all of: Florida (29 ev), Pennsylvania (20 ev), North Carolina (15 ev), Virginia (13 ev), Arizona (11 ev), Tennessee (11 ev) and Missouri (10 ev). If he lost ANY of those states, he would lose the election overall. Of the current swing states, he can only afford to lose Iowa (6 ev) or New Hampshire (4 ev)… but not both.
If this was the polling in late October, the chances of Romney pulling off a victory would be pretty slim. (Not zero, a Romney win would still be possible, the odds would just be very strongly against it since it would require a near sweep of the swing states, including many where he is behind.)
It is of course not late October though. Romney has plenty of time to campaign and plenty of time to move critical states toward him.
Edit 2012 May 4 14:05 – Adding in my boilerplate intro paragraph, which I had forgotten.

Map from the Abulsme.com 2012 Electoral College Prediction page. This map reflects Obama vs Romney. If any other candidate takes the lead in the Republican delegate race we’ll switch to making maps for them.
For a short time Romney’s last five poll average had dropped to less than a 10% lead in Montana, but the latest poll pushes that average back over 10%, so we color the state bright red again. Since either way Montana is not close to being a swing state (although the margin was only 2.3% in the 2008 election!) this does’t effect the overall summary of the race.
|
Romney |
Obama |
| Romney Best Case |
291 |
247 |
| Current Status |
210 |
328 |
| Obama Best Case |
159 |
379 |
This does represent the first state to move in Romney’s direction in a couple of weeks, which can be seen in our trend chart:

Chart from the Abulsme.com 2012 Electoral College Prediction page.
|
|


