This is the website of Abulsme Noibatno Itramne (also known as Sam Minter).
Posts here are rare these days. For current stuff, follow me on Mastodon
|
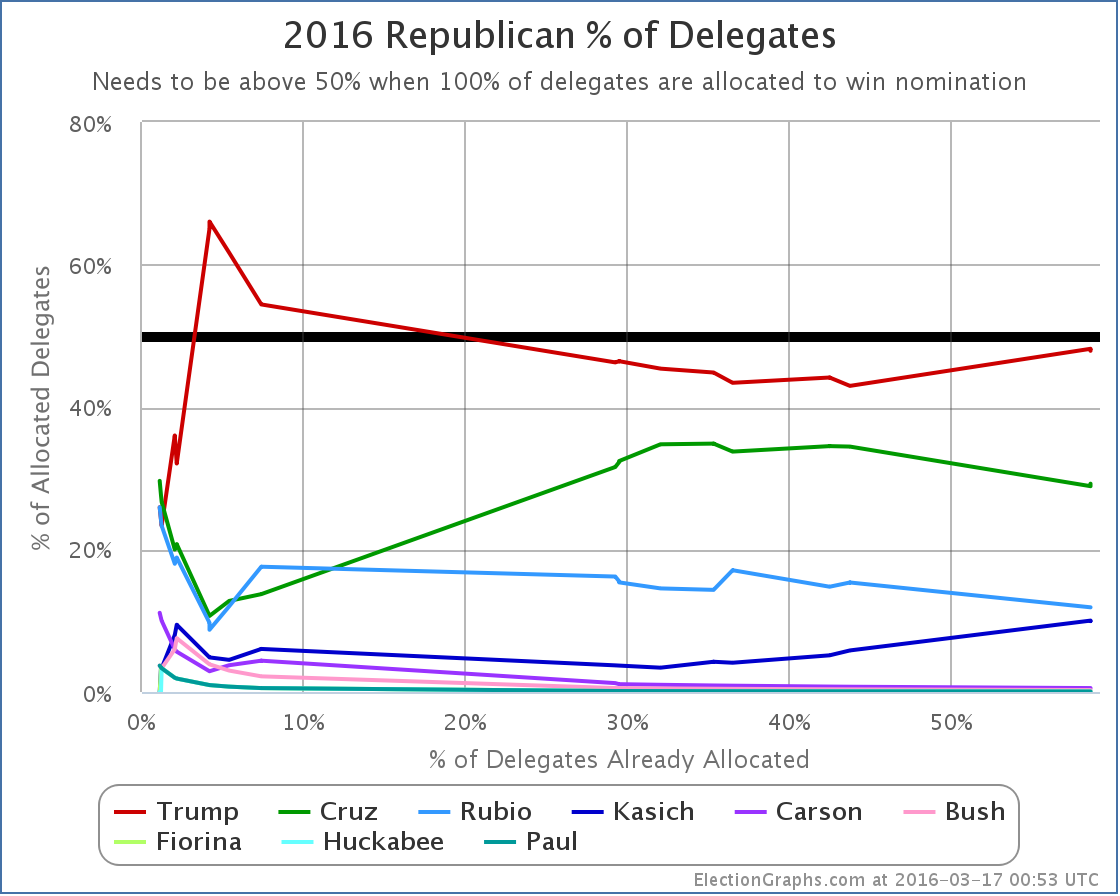
Cruz won Wisconsin decisively with 36 delegates to Trump’s 6. That’s 85.71% of the delegates.
Adding in other updates and delegate adjustments in Alaska, Colorado, American Samoa, Louisiana, and North Dakota that happened since my last post and you end up with a net change of Cruz +50, Trump +6, Rubio+4, Kasich +1. That’s 81.97% of the delegates for Cruz, which is pretty overwhelming.
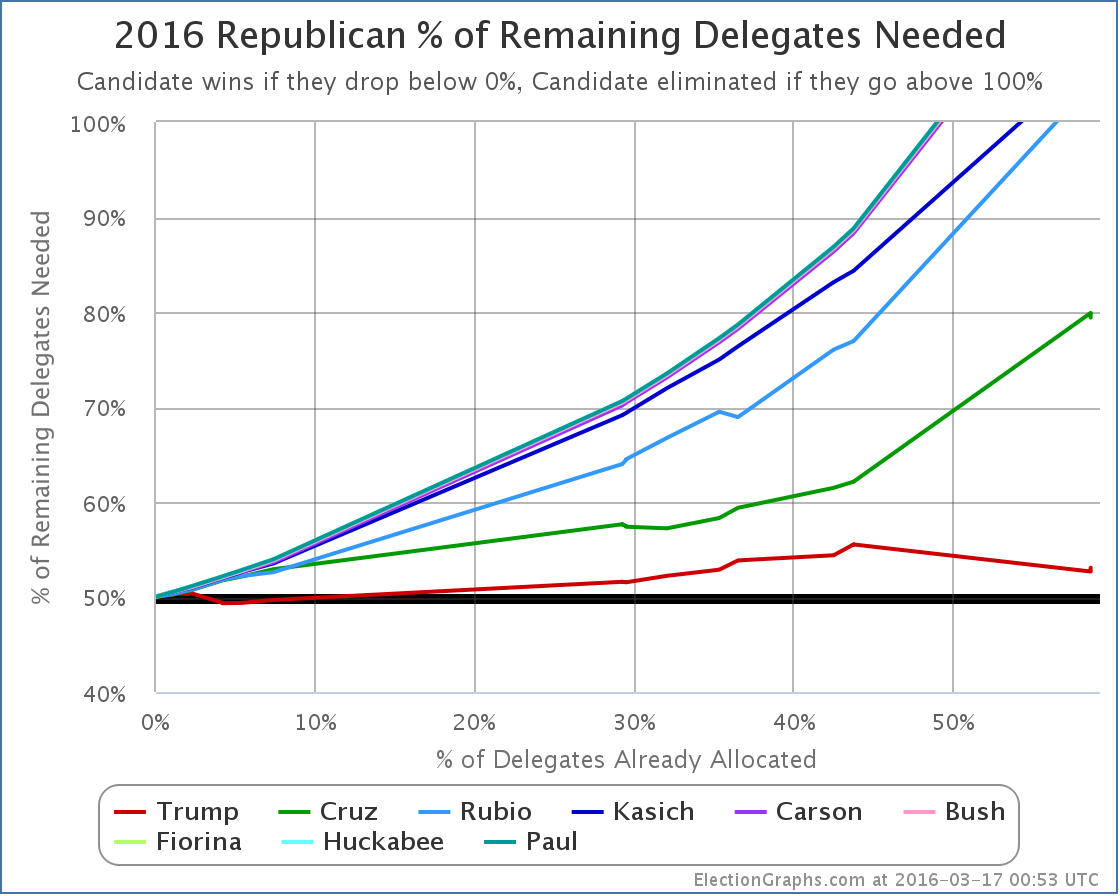
But Cruz needed 83% and change to actually be on pace to win the nomination outright. He did that in Wisconsin, but when you factor in all of the other things since Arizona and Utah he falls a little bit short. The net result is he holds steady. Cruz now needs 83.64% of the remaining delegates to actually win outright.
Nobody expects Cruz to win delegates at that pace. The scenario where Cruz actually gets to 1,237 delegates before the convention is outrageously unlikely.
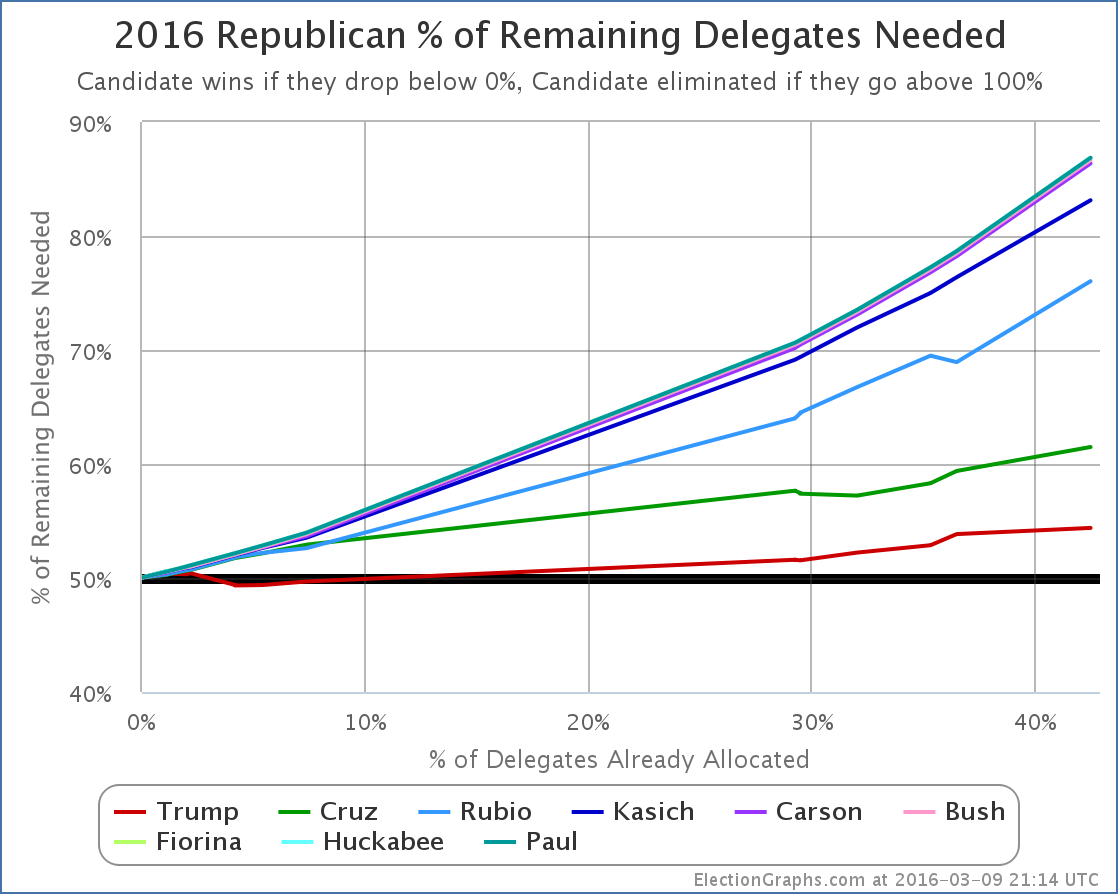
So lets look at the more relevant question. Does this stop Trump from getting to 1,237?
Well, it certainly makes it harder:
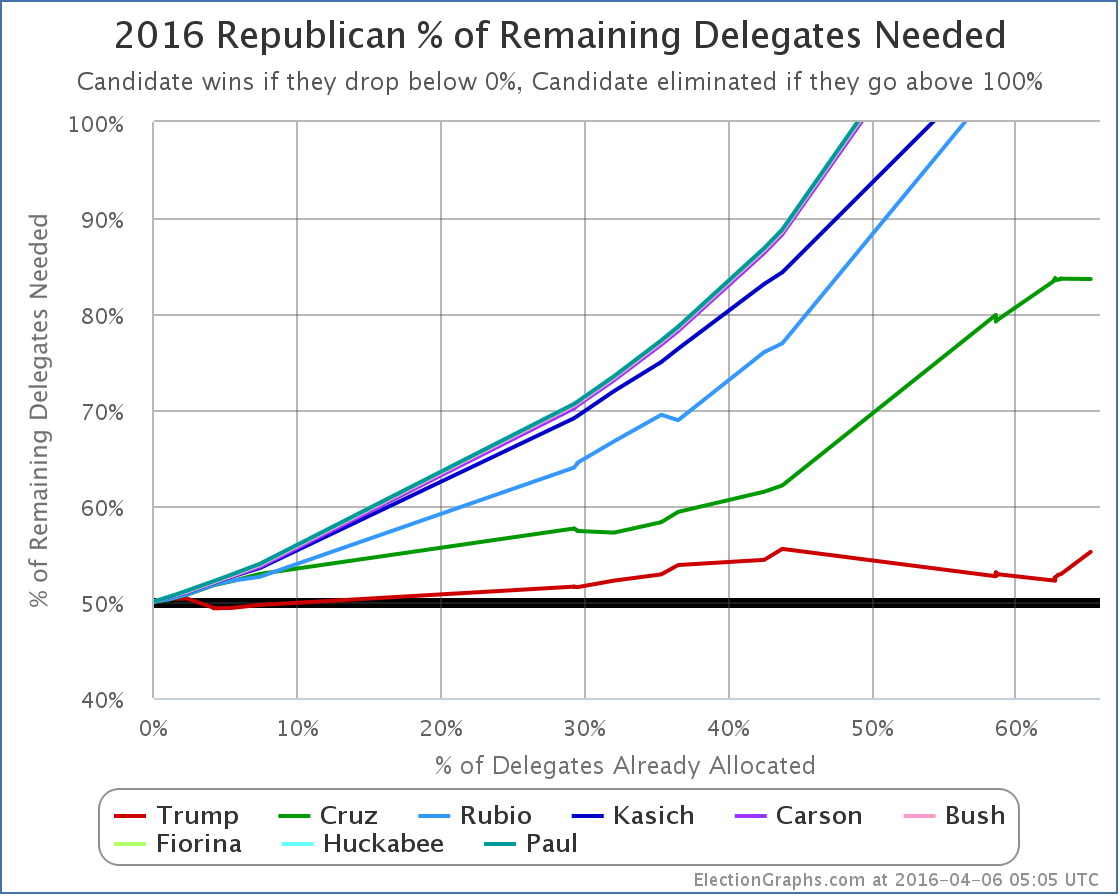
Between all of the things happening recently mentioned above, Trump goes from needing 52.22% of the remaining delegates to win outright, to needing 55.22%. Given that so far he has only managed 47.27%, this will clearly be a bit of a lift. If we had all proportional contests from here on out, it would probably be time to say it just wasn’t going to happen and buckle up for the contested convention.
Because of the craziness of winner take all and winner take most states though, we’re probably not quite there yet. But we’re a lot closer than we were before Wisconsin. But even that is complicated.
Taking Wisconsin into account, if you use 528’s “Can you get Trump to 1,237” calculator and follow the expert consensus projections, Trump falls about 55 delegates short. Now, they are giving Trump none of the uncommitted delegates. I agree that Trump won’t do well in this group, but zero seems a bit light.
The general picture though remains, which is that if all the remaining states go “as expected” Trump will fall slightly short of a majority of the delegates, and we’ll have a multi-ballot Republican convention for the first time since 1948. (The last time for the Democrats was 1952.)
To avoid this, Trump has to not just meet expectations in all of the coming states, but exceed them by just a little bit. With the drumbeat of perceived problems and missteps Trump has had in the last few weeks, this may seem unlikely. It may seem that Trump coming in below the current expectations is more likely. There has even been some talk that Trump has peaked and the long anticipated Trump collapse has now started.
A few weeks ago FiveThirtyEight projected Trump to get 25 of the 42 delegates in Wisconsin. The six Trump actually got is a long way from 25. That certainly seems to indicate we might be seeing a Trump collapse.
But wait… in the New York Times Nate Cohn gave Trump’s “expected” popular vote result in Wisconsin based on demographics and previous history as 35%. What was the actual result? 35.1%. That means that compared to where he was before, Trump’s performance didn’t actually constitute any sort of collapse. Trump is not in freefall. Instead, Trump came in pretty much where he was expected to in the popular vote.
So why the shellacking in delegates? It seems like this is due more to Cruz doing better than expected than to Trump doing worse than expected. The way this lined up in Wisconsin, it gave Cruz the overwhelming delegate win.
But this may or may not translate into other states. New York is not Wisconsin.
We will have some more information from Colorado this weekend and Wyoming next weekend. Trump is not expected to do very well in either, but we can look for clues in terms of if he meets or exceeds the projections there. But the next big bunch of delegates is April 19th in New York where Trump is expected to do very well. Then a lot of East coast states where Trump is also favored. But the question is not just “does Trump win” it is “does Trump win by enough”.
Right now, we are still in the zone where an outright Trump win is possible. But it requires Trump to improve on his performance so far, at a time where it seems like he is holding steady, but not really gaining ground. And despite not really taking aim at him until way later than many people thought they should have, the anti-Trump forces are now in full force, throwing everything they have at Trump. Improving his performance to the 55.22% of delegates average he needs to win outright may be a very tall order.
It may be slightly too soon to say that we are definitely going to have a multi-ballot contested convention… but the odds seem to be getting better by the day. And the chances that we will have some sort of craziness… the result of the first ballot determined by uncommitted delegates… or convention floor fights on rules changes or delegate credentialing that might impact the voting… seems to be very likely indeed.
So if you are a political junkie, go ahead and book July 18th to July 21st as days off from work, because there will almost certainly be fireworks of some sort, and you’ll want to be at home keeping up with the craziness minute by minute.
Right?
Or is that just me? :-)
[Update 2016-04-08 18:09 UTC – Results from Colorado’s 7th Congressional district in. Cruz +3. This doesn’t substantially change the analysis above.]
[Update 2016-04-09 16:24 UTC – Results from Colorado’s 2nd, 3rd, 4th and 5th Congressional districts: Cruz +12. Cruz has completely shut out Trump in Colorado’s 7 congressional districts. The statewide delegates will be determined later today. With the changes so far in Colorado, Trump now needs 56.20% of the remaining delegates to win.]
Note: This post is an update based on the data on ElectionGraphs.com. Election Graphs tracks both a poll based estimate of the Electoral College and a numbers based look at the Delegate Races. All of the charts and graphs seen in this post are from that site. Additional graphs, charts and raw data can be found there. All charts above are clickable to go to the current version of the detail page the chart is from, which may contain more up to date information than the snapshots on this page, which were current as of the time of this post. Follow @ElectionGraphs on Twitter or like Election Graphs on Facebook to see announcements of updates or to join the conversation. For those interested in individual general election poll updates, follow @ElecCollPolls on Twitter for all the polls as they are added.
When I did my last update there hadn’t been any recent polls in either Arizona or Utah, but the results there ended up matching pretty well with the results of the few polls that came out since then. Namely, Trump won Arizona which was straight up winner take all, and Cruz got over 50% in Utah, so he got all of the delegates there.
So the net for the night was Trump +58, Cruz +40.
Adding in other delegate adjustments since the March 15th results we have a net change of:
Trump +62, Cruz +43, Rubio -3
So effectively, Trump got 60.78% of the delegates since the last update. He only needed 53.07% to improve his position.
So what does this look like?
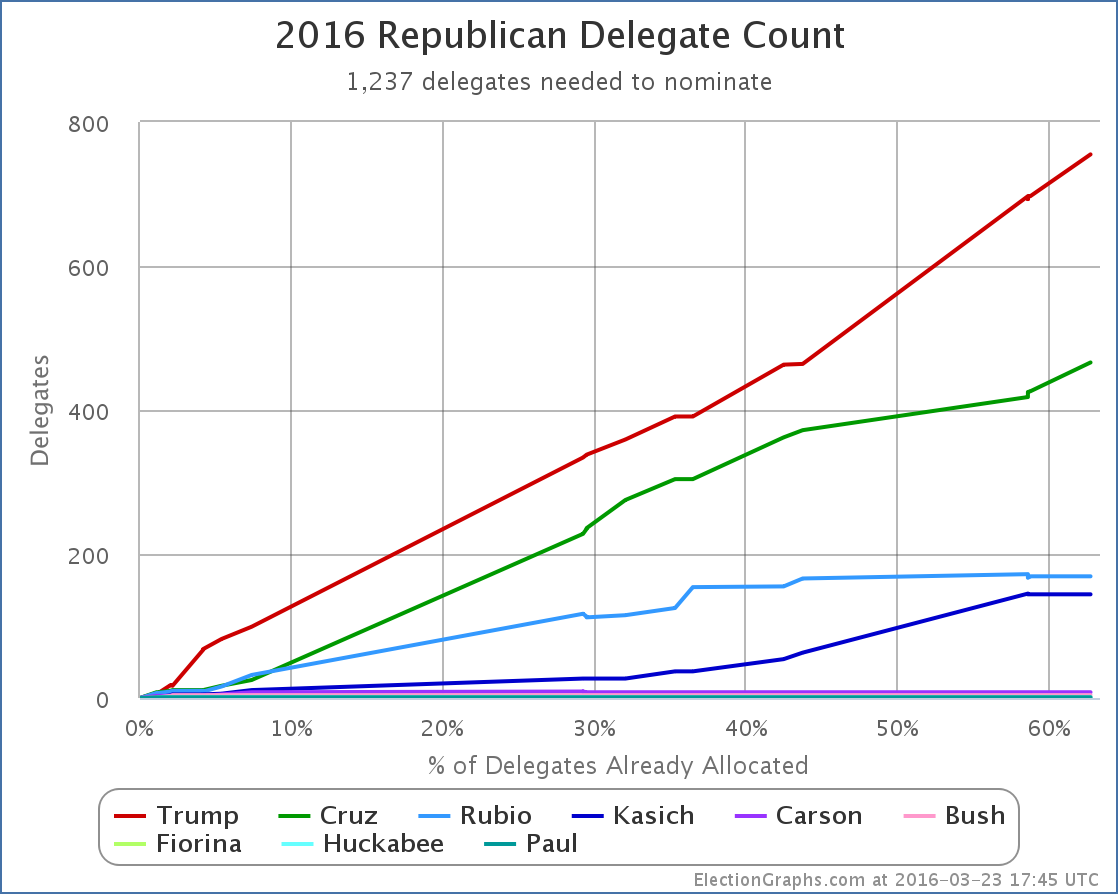
The raw delegate count is now Trump 755, Cruz 466, Rubio 169, Kasich 144, Carson 8, Bush 4, Fiorina 1, Huckabee 1, Paul 1
Trump’s pace of delegate accumulation actually looks like it has accelerated, while everybody else has slowed down.
But the raw delegate counts are not the right thing to look at.

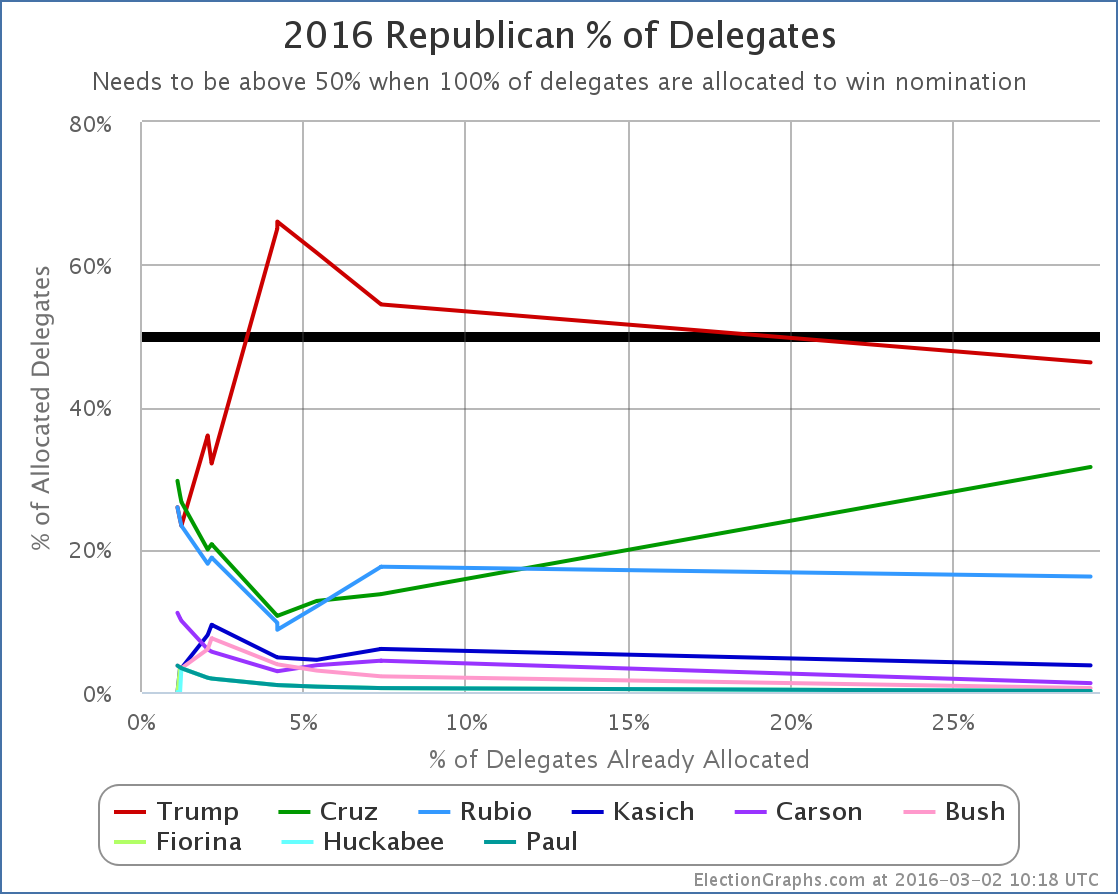
In percentages of the delegates so far, both Trump and Cruz improved. But of course Cruz is nowhere near the 50% line. Trump meanwhile is now at 48.74%. He doesn’t have a majority. Close. Very close. But not quite.
But % of delegates so far isn’t the right thing to look at either.
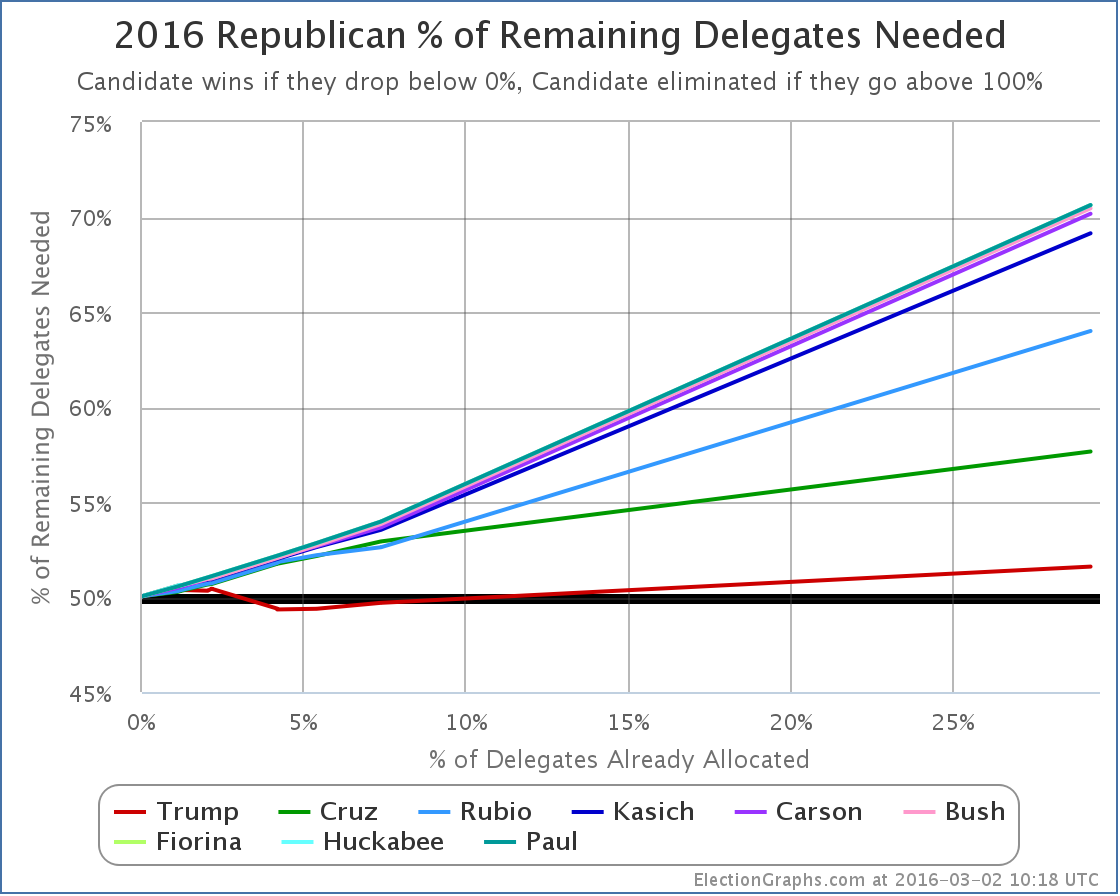
This is the real graph to watch. The percentage of the remaining delegates that Trump needs to win in order to get to the convention with a majority of delegates. This has been dropping in the last couple of contests.
Trump now needs 52.22% of the remaining delegates to win the nomination outright.
Now, some of those “remaining delegates” are 18 delegates who have already been selected as officially “uncommitted” delegates, and there will be more uncommitted delegates coming out of some of the states that have yet to vote. Probably a few dozen to as many as 100. These delegates are essentially like the Democratic superdelegates in that they can vote however they feel like and are not bound to the results of any primaries or caucuses.
If you wanted to calculate the percentage Trump would need without uncommitted delegates, it would be higher. But just like superdelegates are part of the process on the Democratic side, uncommitted delegates are part of the process on the Republican side, and to get a fair picture you need to include them.
You just have to realize that winning not only includes earning pledged delegates, but also convincing uncommitted delegates to vote for you.
It is a real possibility that we could get to the end of the primaries and caucuses in June without knowing if Trump has an outright win, or if he’ll come up short on the first ballot at the convention. It might end up depending on what those uncommitted delegates decide to do.
We are still right on the edge between a Trump win and a convention where nobody wins on the First ballot. And which way that goes may end up depending on the uncommitted delegates. What percentage of the uncommitted delegates Trump would need… if he even needs them at all… will depend on how he continues to do in getting pledged delegates between now and June.
But meanwhile, the pace of primaries and caucuses now slows down quite a bit. So there will be a lot of waiting before we know.
[Update 2016-04-01 17:15 UTC – Alaska gave back Rubio’s delegates after he asked, and Oklahoma finalized their results. Net change: Rubio +4, Cruz -2, Trump -3. This does not substantially change the analysis above.]
[Update 2016-04-04 05:43 UTC – Most of Colorado’s delegates will be determined next weekend, but the 6 representing the 1st and 6th congressional districts were determined this weekend, and all 6 went to Cruz. With this and the change above, Trump’s percentage of remaining needed to win is up to 52.83%. Adding this note here rather than doing a full post on those six delegates.]
[Update 2016-04-04 14:15 UTC – As of April 4th there were 28 “unbound” Republican delegates, with more to come soon. These are free agents like the Democratic superdelegates. I have started to track them individually when there is evidence of a known preference. So far, adding them in nets: Cruz +3, Trump+2.]
[Update 2016-04-06 02:01 UTC – Added in tentative evaluations of the uncommitted delegates from North Dakota. Net: Cruz +7, Trump +1, Kasich +1.]
Note: This post is an update based on the data on ElectionGraphs.com. Election Graphs tracks both a poll based estimate of the Electoral College and a numbers based look at the Delegate Races. All of the charts and graphs seen in this post are from that site. Additional graphs, charts and raw data can be found there. All charts above are clickable to go to the current version of the detail page the chart is from, which may contain more up to date information than the snapshots on this page, which were current as of the time of this post. Follow @ElectionGraphs on Twitter or like Election Graphs on Facebook to see announcements of updates or to join the conversation. For those interested in individual general election poll updates, follow @ElecCollPolls on Twitter for all the polls as they are added.
In my last post on the Republicans I used current polls to try to guess the March 15th results. This was my guess:
Trump +226, Kasich +86, Cruz +36, Rubio +19
Results are not yet final in Missouri, and because it is winner take all in each congressional district as well as statewide, and it is close in most congressional districts, things could still swing there quite a bit. But for the moment, with the best estimates I had from Green Papers, the actual results from the 15th were:
Trump +229, Kasich +81, Cruz +51, Rubio +6
Cruz got a bit more than my predictions, Rubio a bit less. But basically using the polls a couple days out got things pretty spot on. So minus any big changes from Missouri or minor adjustments elsewhere, this was the expected scenario.
So time to look at some graphs, including some I don’t usually bother with…
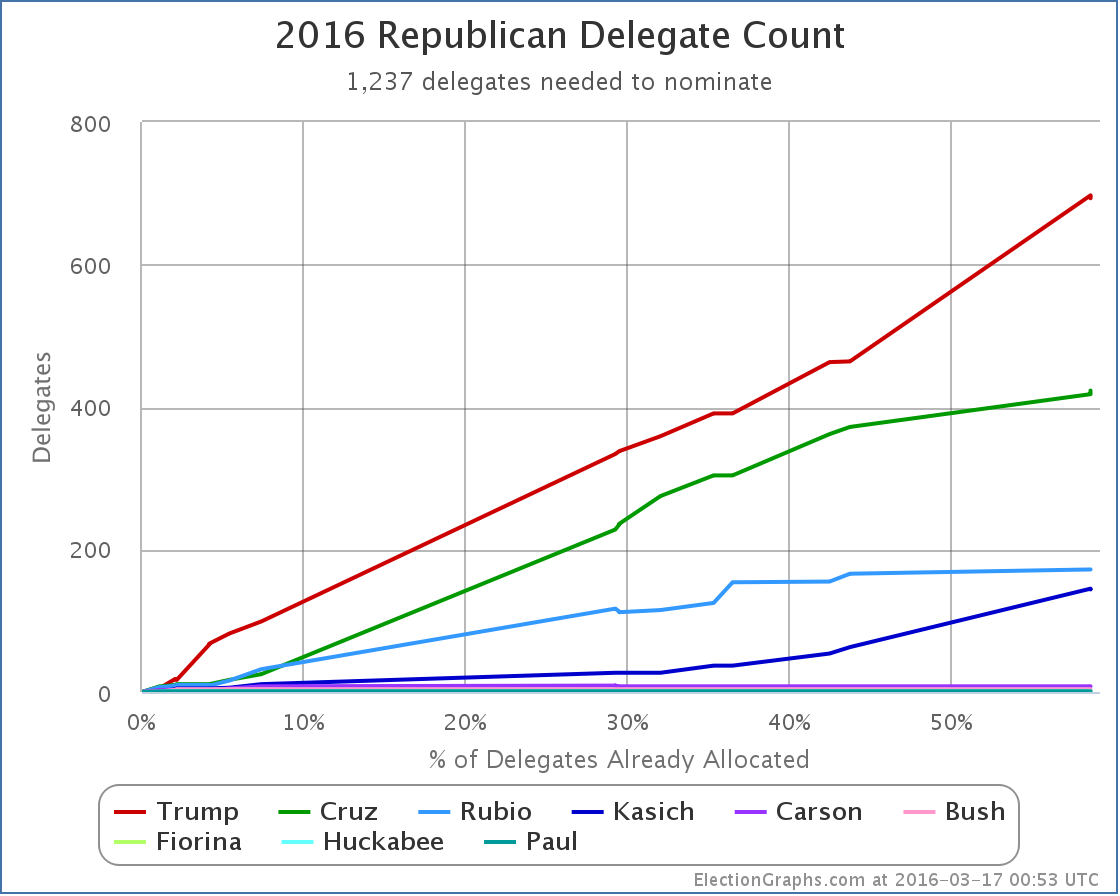
In raw delegate counts we now have:
Trump 693, Cruz 423, Rubio 172, Kasich 144, Carson 8, Bush 4, Fiorina 1, Huckabee 1, Paul 1
Trump, Cruz and Kasich both look like they made significant improvements, but…
This is the percentage of delegates allocated so far to each candidate. Trump is just BARELY under the 50% mark. Only Trump and Kasich improved on this metric with the March 15th results.
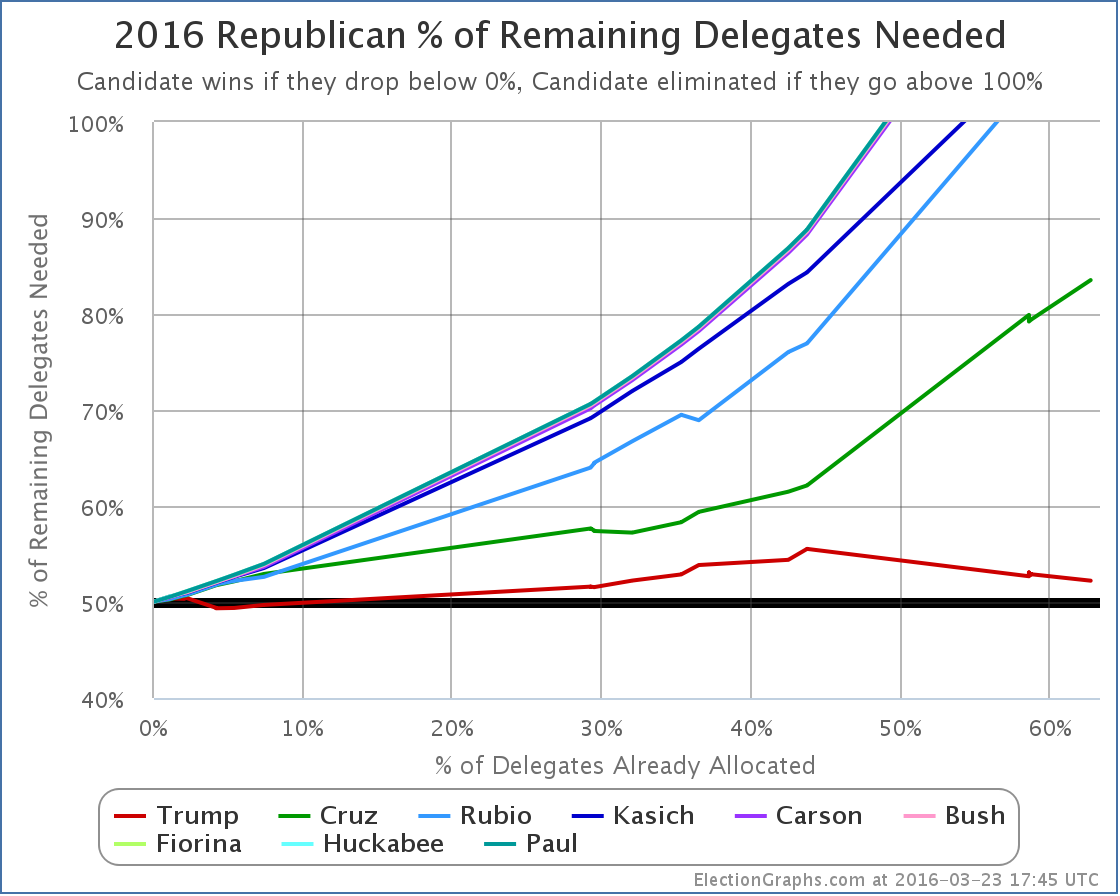
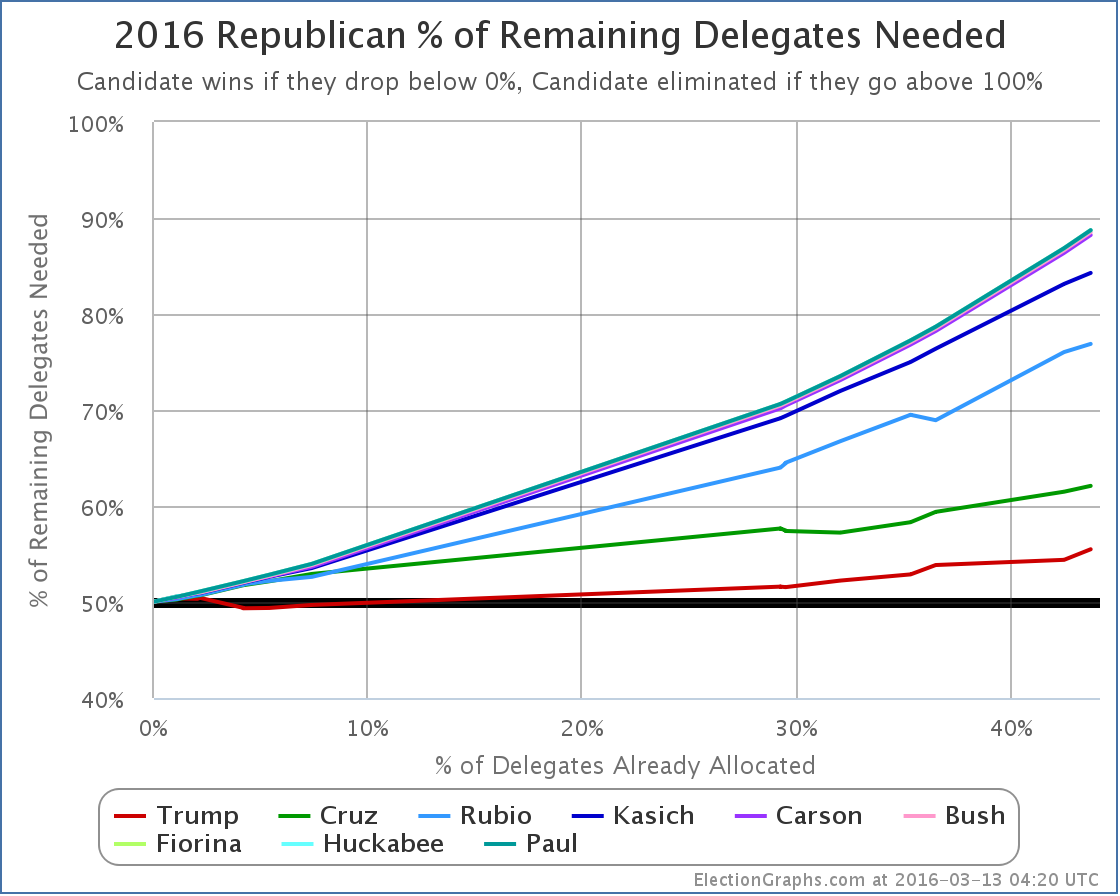
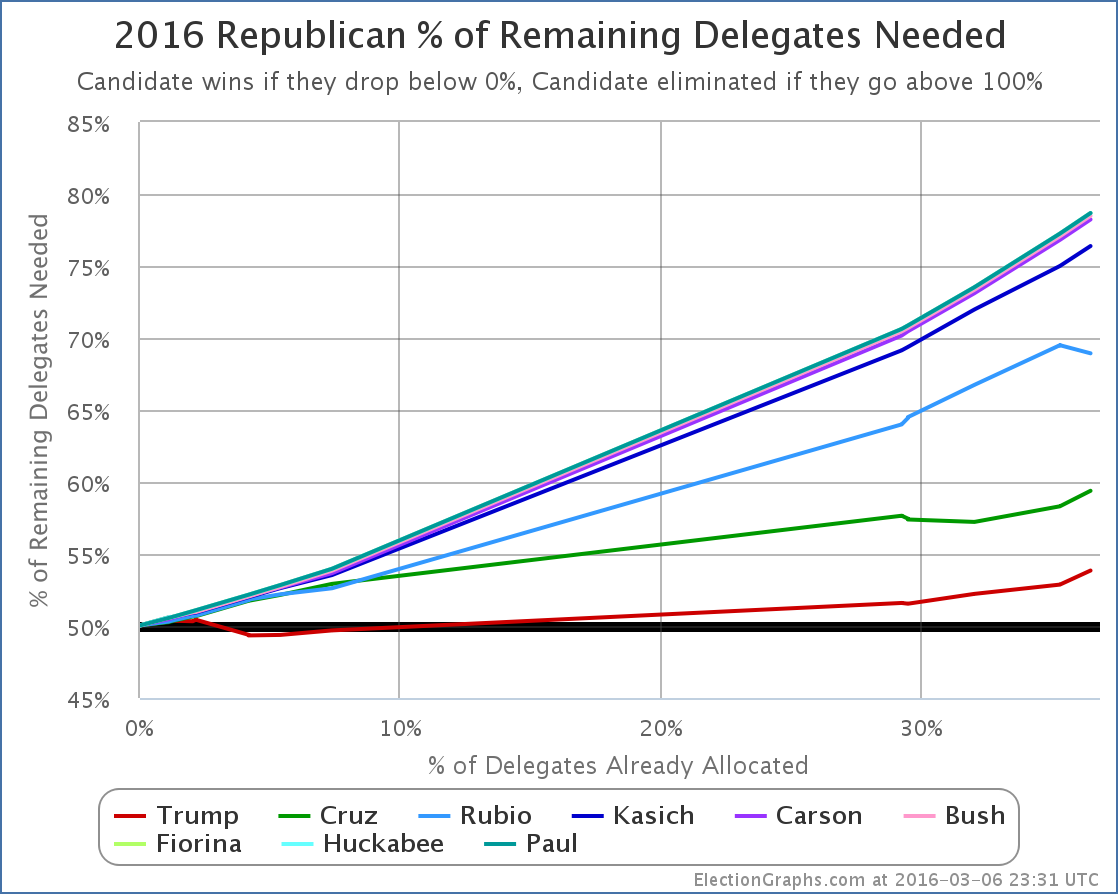
But… looking at the much more useful “% of remaining delegates needed to win” graph…
Everybody except Trump got further away from the nomination after March 15th. In fact, all of them got a LOT farther from the nomination. In fact, almost all the candidates have now been mathematically eliminated from a first round convention win. We knew for a long time that Paul, Huckabee, Fiorina, Bush and Carson were headed there. But it is now official. But Rubio was also eliminated. And despite his “big win” in Ohio, so was Kasich. All of these candidates could get every delegate still outstanding… and still not end up with enough delegates to win.
Only Trump and Cruz still have the possibility of collecting a majority of the delegates before the convention. And Cruz just went from needing 62.14% of the remaining delegates, to needing 79.41%. This is a completely unrealistic number, even if it was a two person race between him and Trump. (For the moment, despite it being impossible for him to get enough delegates, Kasich is staying in, so we still have a three way split, which favors Trump.)
Trump needs 53.07% of the remaining delegates to win outright. Less than that will get us to a contested convention and all kind of chaos. But how likely is Trump to get those sorts of margins? So far of course he has only gotten 47.89% of the delegates. So he does have to improve on his previous performance by about 11%.
This sounds like a lot, but it is probably quite reachable. First, Trump will undoubtedly pick up some of Rubio’s supporters, they won’t all go to Cruz and Kasich. Second, there are a number of winner take all states coming up. Third, a lot of the states that are not winner take all are still winner take most.
Basically, the structure of the primary calendar is DESIGNED to help the front running candidate wrap things up. It is not unreasonable to think Trump will be able to do that. To stop it, Cruz and Kasich between them need to be getting more than a majority of the delegates despite the fact that neither of them has a realistic shot at an outright win. The only plan for those two is to force the contested convention, then win there.
Some places have tried to game out all of the remaining primaries and caucuses, and they conclude that we may in fact not know if we have an outright Trump win or a contested convention until the very last contests on on June 7th. That would be California, Montana, New Jersey, New Mexico and South Dakota. And there is a possibility we won’t even know until after that, because although their numbers are small, some states and territories have actually elected uncommitted delegates, who like superdelegates on the Democratic side are free agents able to vote however they see fit. There is a posisbility (a small one, but non-zero) that these uncommitted delegates may be in a position to determine if there will indeed be a contested convention.
I won’t try to game out the rest of the season, but I will look at next Tuesday… Arizona, Utah, and American Samoa. As usual, looking at RCP for polls, and Green Papers for delegate rules. But guess what? As of today, there has been NO recent polling on any of these three. So we’ll use national polling, but eliminating candidates who have dropped out. So Trump 36.0%, Cruz 21.8%, Kasich 12.0%. Normalized to 100%, that is Trump 51.6%, Cruz 31.2%, Kasich 17.2%..
- Arizona is winner take all. Unless Cruz or Kasich are doing much better there than nationally, Trump gets all 58 delegates.
- Utah is winner take most. If anybody gets over 50%, they get all the delegates. If the estimates above based on national polling are right, Trump gets all 40 delegates. If he doesn’t hit 50%, but still gets a plurality, he is likely to still get almost all the delegates. We’ll estimate 40 to Trump.
- American Samoa might end up electing someone with a commitment, but the expectation given their rules is that all delegates will be uncommitted, so they will just stay TBD in my counts.
Now, either Arizona or Utah COULD go in a completely different direction. As I said, there has been no recent polling. So who really knows? But if Trump ends up winning both, he will likely get something close to 98 delegates out of the two states.
If that happened, that would put the total delegate count at:
Trump 791, Cruz 423, Rubio 172, Kasich 144, Carson 8, Bush 4, Fiorina 1, Huckabee 1, Paul 1
That would give Trump 51.20% of the delegates. He would once again have a majority of the delegates. Trump would then need 446 delegates to win outright. There would be 927 delegates left undetermined at that point. So Trump would only need 48.11% of the remaining delegates to win. Which given his history at that point seems quite reachable.
But continuing to block him might still be within reach. Cruz + Kasich would only need to manage about 52% of the delegates. Which might be possible if they could build on anti-Trump sentiment even in the face of Trump winning. If they can do that is a big open question though. The “I can’t win, and you might not even like me, but vote for me to block the other guy and cause a contested convention where the outcome is completely unknown” case may not be the easiest one to make.
But if Cruz and Kasich can make that case, then it is not over yet.
So then we start looking at North Dakota, Wisconsin, Colorado… and beyond.
Of course, if Trump loses Arizona or Utah, that all changes.
So we will have to wait and see… but if I had to put odds on it, I’m still thinking about an 80% chance that Trump just wins this outright. The structure of the contests themselves are designed to help the front runner, and that is Trump.
[Update 2016-03-18 06:21 UTC – As per Alaska’s rules, after Rubio dropped out they reassigned his delegates to the remaining candidates. Result: Trump +3, Cruz +2, Rubio -5.]
[Update 2016-03-23 01:43 UTC – The Virgin Islands updated their delegate results because the original slate of delegates (all uncommitted) did not end up qualifying under the rules (see here). The original delegates were replaced by alternates. The result for the counts was Rubio +2, Cruz +1, Trump +1.]
Note: This post is an update based on the data on ElectionGraphs.com. Election Graphs tracks both a poll based estimate of the Electoral College and a numbers based look at the Delegate Races. All of the charts and graphs seen in this post are from that site. Additional graphs, charts and raw data can be found there. All charts above are clickable to go to the current version of the detail page the chart is from, which may contain more up to date information than the snapshots on this page, which were current as of the time of this post. Follow @ElectionGraphs on Twitter or like Election Graphs on Facebook to see announcements of updates or to join the conversation. For those interested in individual general election poll updates, follow @ElecCollPolls on Twitter for all the polls as they are added.
[Edit 02:27 UTC to add final bit about odds.]
Saturday brought Republican results for DC, Guam and Wyoming. The number of delegates coming out of this was small, turnout was tiny, and there had been no polling. But the results were surprisingly bad for Trump. Between these three we ended up with:
Rubio +11, Cruz +10, Kasich +9, Trump +1
This by the way is much worse for Trump than the model in my last post predicted, since it used national polls in the absence of actual polls for these three places.
There were also 9 “uncommitted” delegates selected yesterday. These people essentially become like the Democratic superdelegates, in that they are free agents at the convention. If I find out their preferences, I’ll assign them to the candidate they support, but for now they remain TBD. With all the contests so far there are actually 22 of these now. It will be interesting to see if they make a difference.
In any case, with only 1 of 30 delegates from Saturday, or 3.33%, Trump fell very far short of the 54.39% of the delegates he needed to be on the path to an outright win instead of a contested convention.
Trump now needs 55.49% of the remaining delegates to win outright. This number is getting high. And the gap between what Trump has done so far (42.96% of delegates) is getting larger. Nobody else got what they needed either of course, so everybody’s numbers got worse, not just Trump’s.
Of course, we still have some big winner take all and winner take most states coming up, so time to refresh the poll based predictions for Tuesday and see what they look like now. As usual, using RCP poll averages and delegate distribution rules from Green Papers.
Florida – 99 delegates – March 15th:
- Poll averages: Trump 41.4%, Rubio 23.3%, Cruz 19.7%, Kasich 9.6%
- Delegate estimate: Trump 99
North Carolina – 72 delegates – March 15th:
- Poll averages: Trump 35.6%, Cruz 23.8%, Rubio 13.0%, Kasich 10.4%
- Delegate estimate: Trump 31, Cruz 21, Rubio 11, Kasich 9
Illinois – 69 delegates – March 15th:
- Poll averages: Trump 34.3%, Cruz 25.3%, Kasich 18.3%, Rubio 14.8%
- Delegate estimate: Trump 35, Cruz 15, Kasich 11, Rubio 8
Ohio – 66 delegates – March 15th:
- Poll averages: Kasich 35.3%, Trump 33.3%, Cruz 20.0%, Rubio 5.8%
- Delegate estimate: Kasich 66
Missouri – 52 delegates – March 15th:
- Using only recent poll: Trump 36.0%, Cruz 29.0%, Rubio 9.0%, Kasich 8.0%
- Delegate estimate: Trump 52
Northern Marianas – 9 delegates – March 15th:
- No polls, using national avg: Trump 36.0%, Cruz 21.8%, Rubio 18.0%, Kasich 12.0%
- Delegate estimate: Trump 9
The main difference from the estimate a few days ago is that now Kasich is ahead in Ohio, and wins the 66 delegates there. This makes a big difference.
Adding these up:
Trump +226, Kasich +86, Cruz +36, Rubio +19
Trump would get 61.6% of the delegates on Tuesday. Which even without Ohio would be above the 55.49% he needs to be tracking toward a clean win.
The new totals would be:
Trump 690, Cruz 408, Rubio 185, Kasich 149, Others 15
Trump would have 47.7% of the delegates. Still not a majority.
When you do all the math at the end of all that, Trump would need 53.37% of the remaining delegates to cleanly win a majority of the delegates. That would still be a substantial improvement from what he had been doing so far.
But there would be more winner take all states coming up. And Cruz, Rubio and Kasich would be so far behind that the scenarios where they would catch up would be extremely far fetched. None of them can win outright. At best they can block Trump. Do all three of them stay in? Do their donors continue to support them in a bid where the only real goal is a contested convention? Can they really keep blocking him from getting a majority of the delegates through a long slog from now until June 7th?
The “Trump wins Florida, but loses Ohio” scenario is the one where it would be premature to say either “Trump will win this outright”, or “Contested Convention”. Instead, we’ll still be hovering between those possibilities, waiting for more states to weigh in.
This might go on awhile.
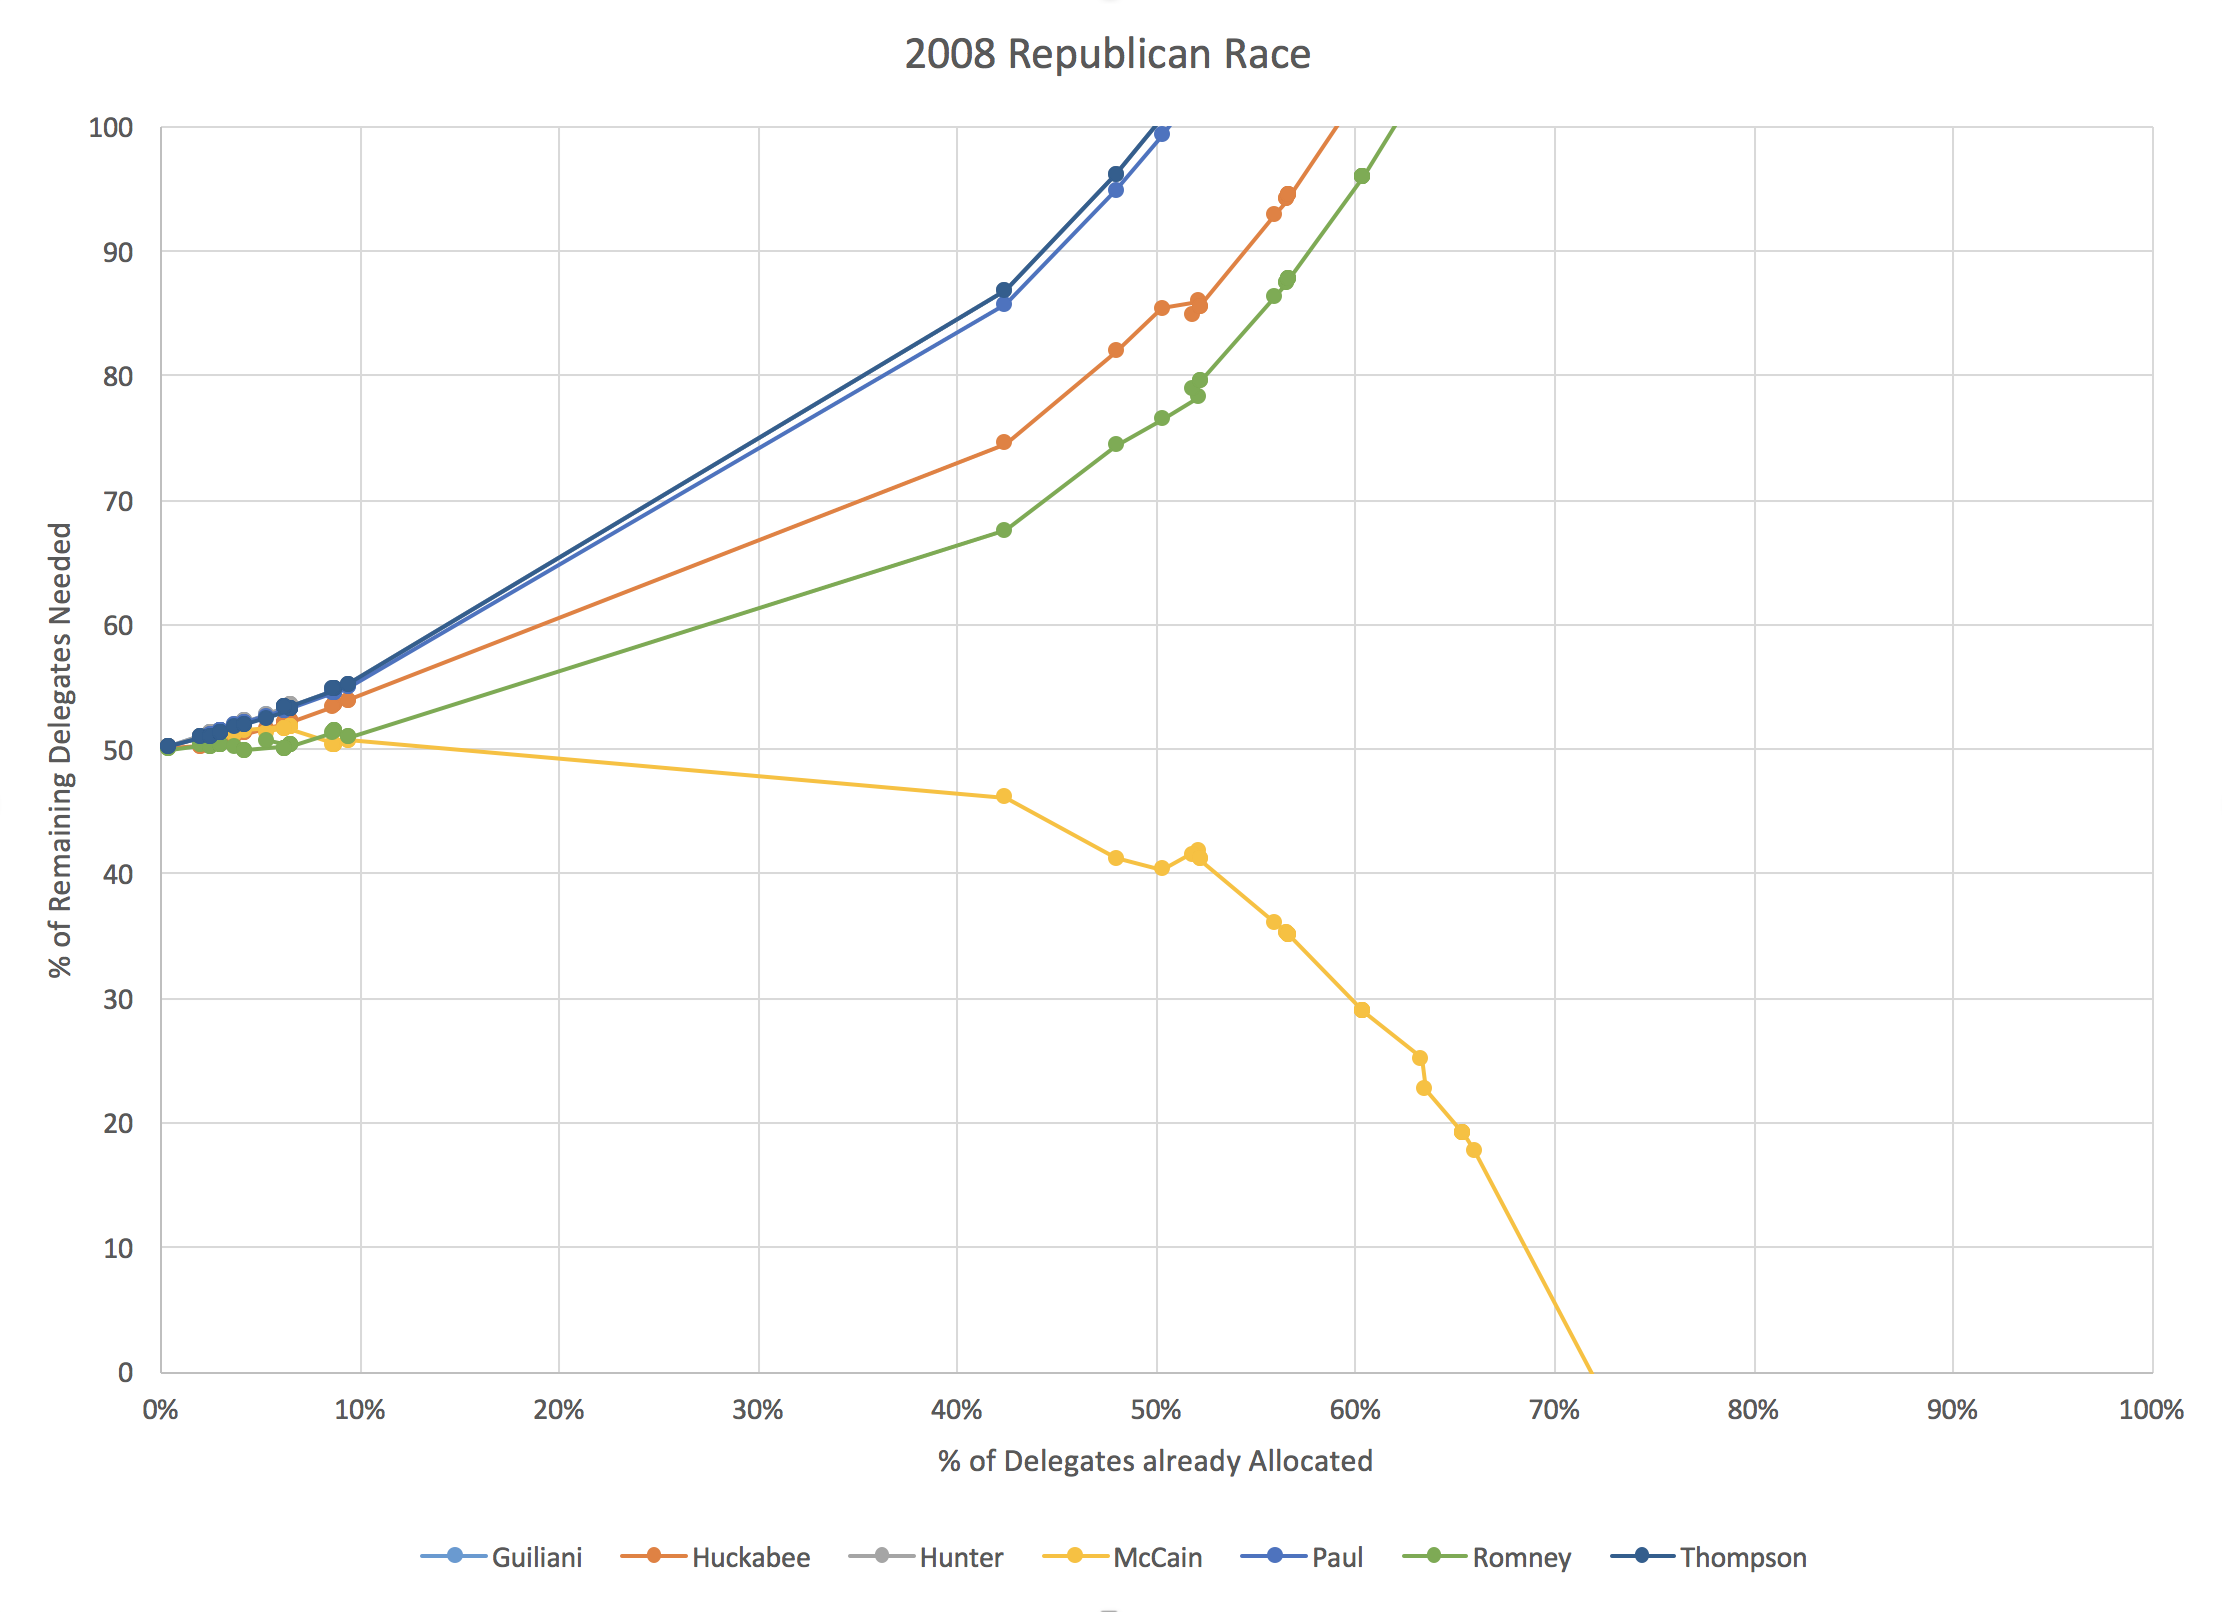
Finally, as I did with the Democrats earlier, a quick look back, comparing Trump today with Romney in 2012 and McCain in 2008.
First, just looking at the percent of delegates they had as the race progressed:
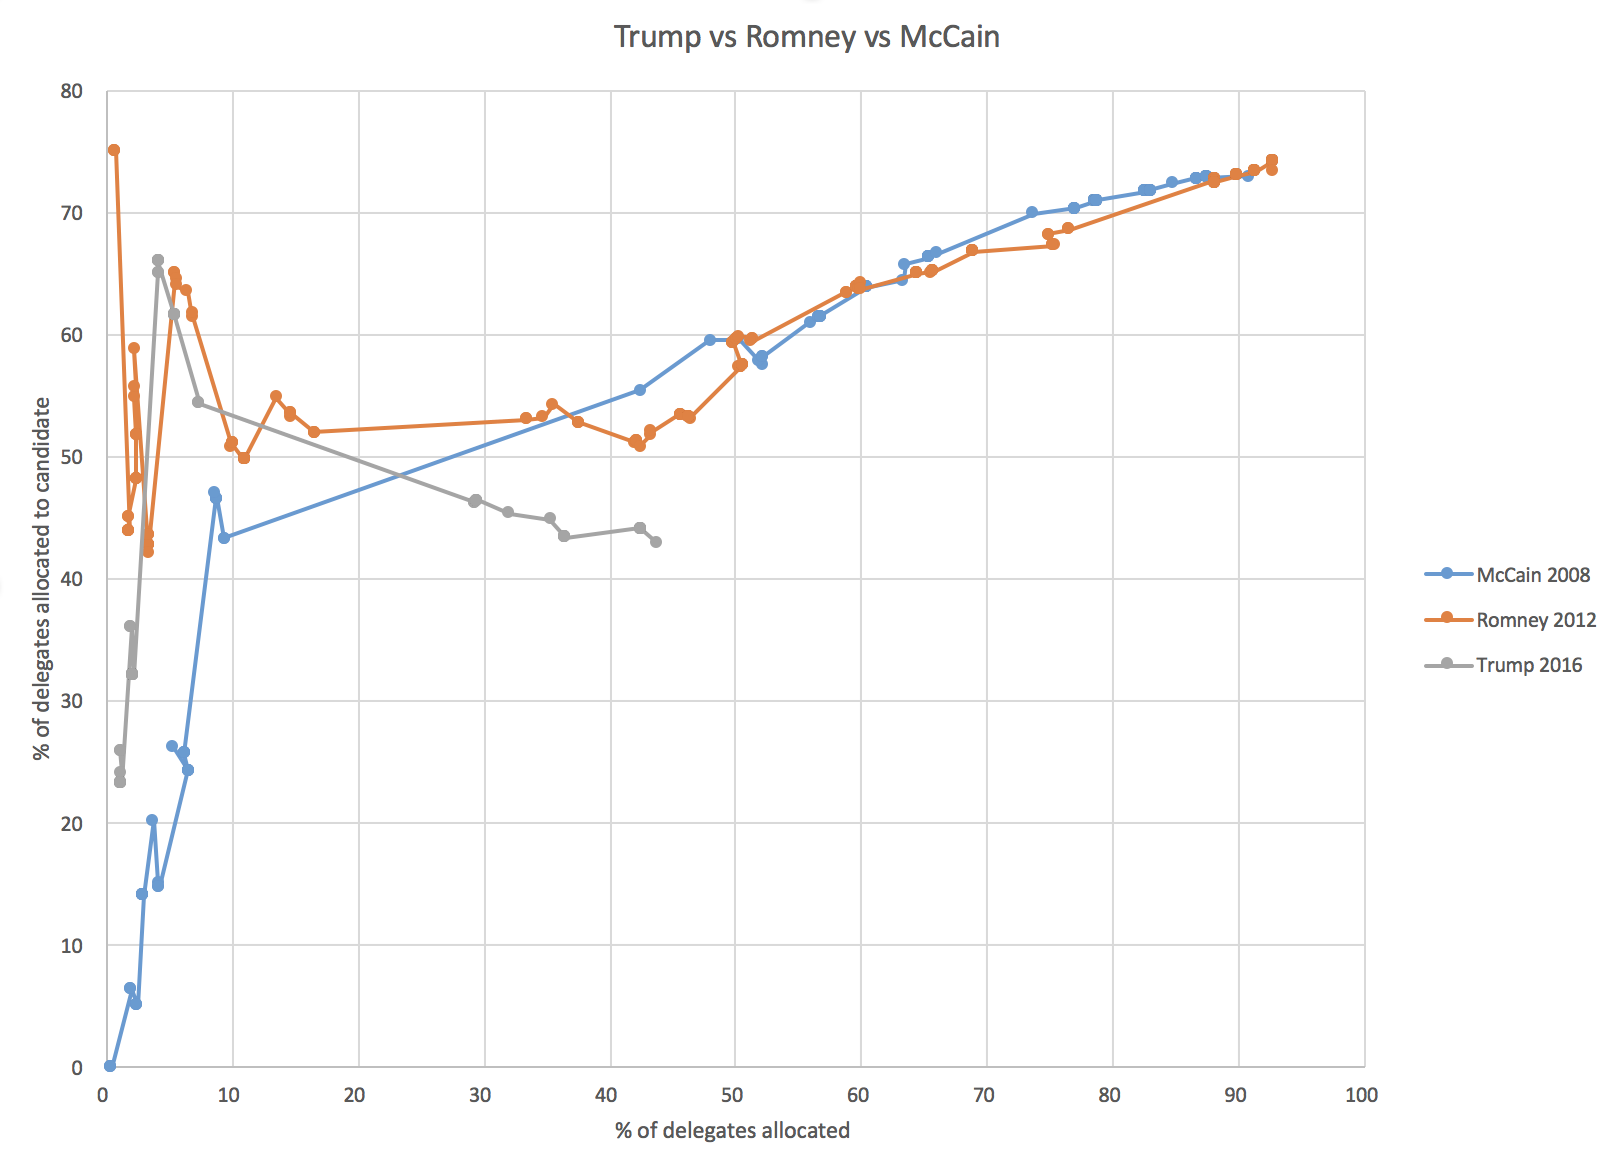
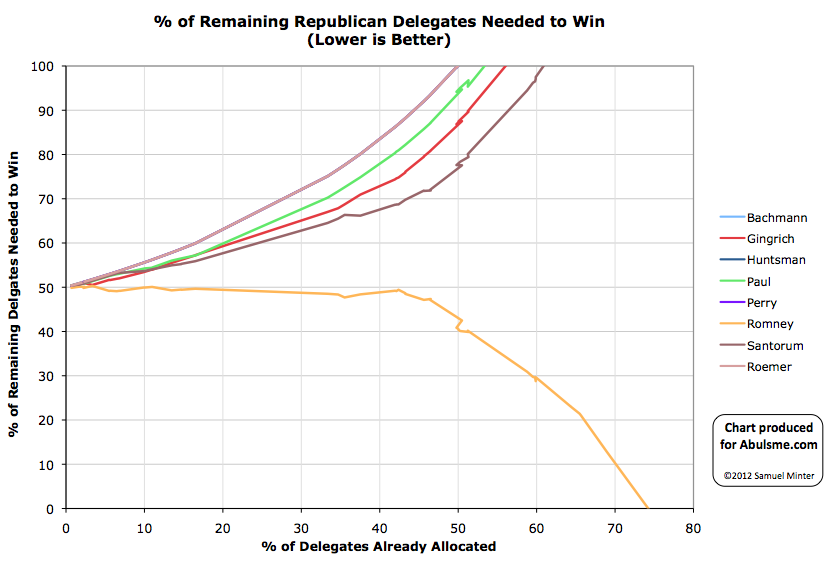
You can see that Trump is behind where either McCain or Romney were at about the same point in the race. But as I’ve said many times, percentages of delegates so far is the wrong way to look at things. Instead, you want to look at the % of the remaining delegates that are needed:
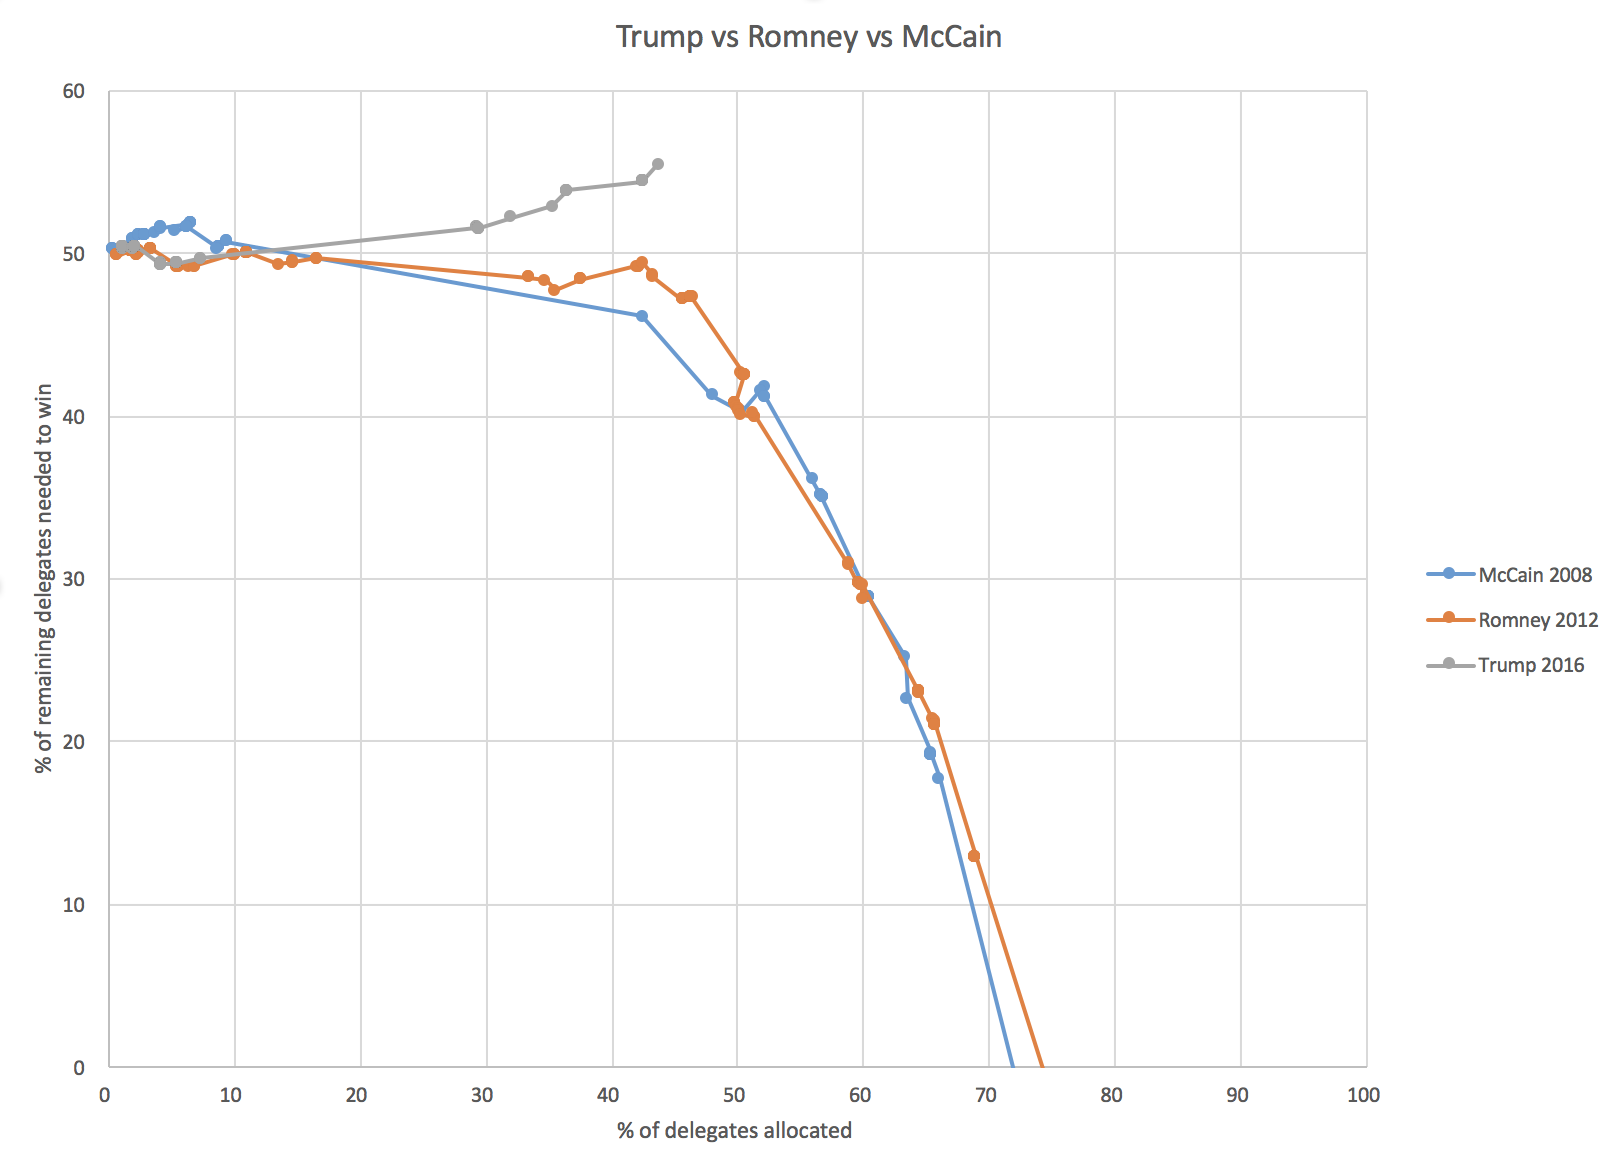
You can see that at this point in the race, both Romney and McCain needed less than 50% of the remaining delegates to win. Trump is way behind that pace. But it was also not until right around now in the races that McCain and Romney really started to pull away. Trump has a harder road here, but with a handful of big winner take all states it is not too late for him to start a downward dive to a flat out win.
But if his line doesn’t manage a full on turn downward, eventually it will curve up, and we’ll end up at the contested convention.
Ohio is close. We will have to wait until Tuesday to see how this thing is going…
Note: This post is an update based on the data on ElectionGraphs.com. Election Graphs tracks both a poll based estimate of the Electoral College and a numbers based look at the Delegate Races. All of the charts and graphs seen in this post are from that site. Additional graphs, charts and raw data can be found there. All charts above are clickable to go to the current version of the detail page the chart is from, which may contain more up to date information than the snapshots on this page, which were current as of the time of this post. Follow @ElectionGraphs on Twitter or like Election Graphs on Facebook to see announcements of updates or to join the conversation. For those interested in individual general election poll updates, follow @ElecCollPolls on Twitter for all the polls as they are added.
[Edit 22:17 UTC to add sentence about other candidate’s numbers getting worse, not just Trump’s.]
[Edit 22:32 UTC to add link to the post on the Democrats.]
On the Republican side March 9th brought results from Hawaii, Idaho, Michigan and Mississippi. The results were:
Trump +73, Cruz +59, Kasich +17, Rubio +1
The projections I made a few days ago based on polling were:
Projected total for March 8th: Trump +91, Cruz +28, Rubio +18, Kasich +12, Carson +1
Despite his wins, Trump considerably underperformed what his polling indicated just a couple days beforehand, while Cruz beat his estimates by quite a bit. Rubio, well, Rubio just flamed out.
Now, this is still a Trump win, but the fact that it was less than the polls would have predicted may mean that there is weakness in Trump that is not being captured by the latest polls.
Also, it was not enough to put him on track to get back out of the “contested zone” where we are on track for a contested convention, and back to a place where he actually has a majority of the delegates.
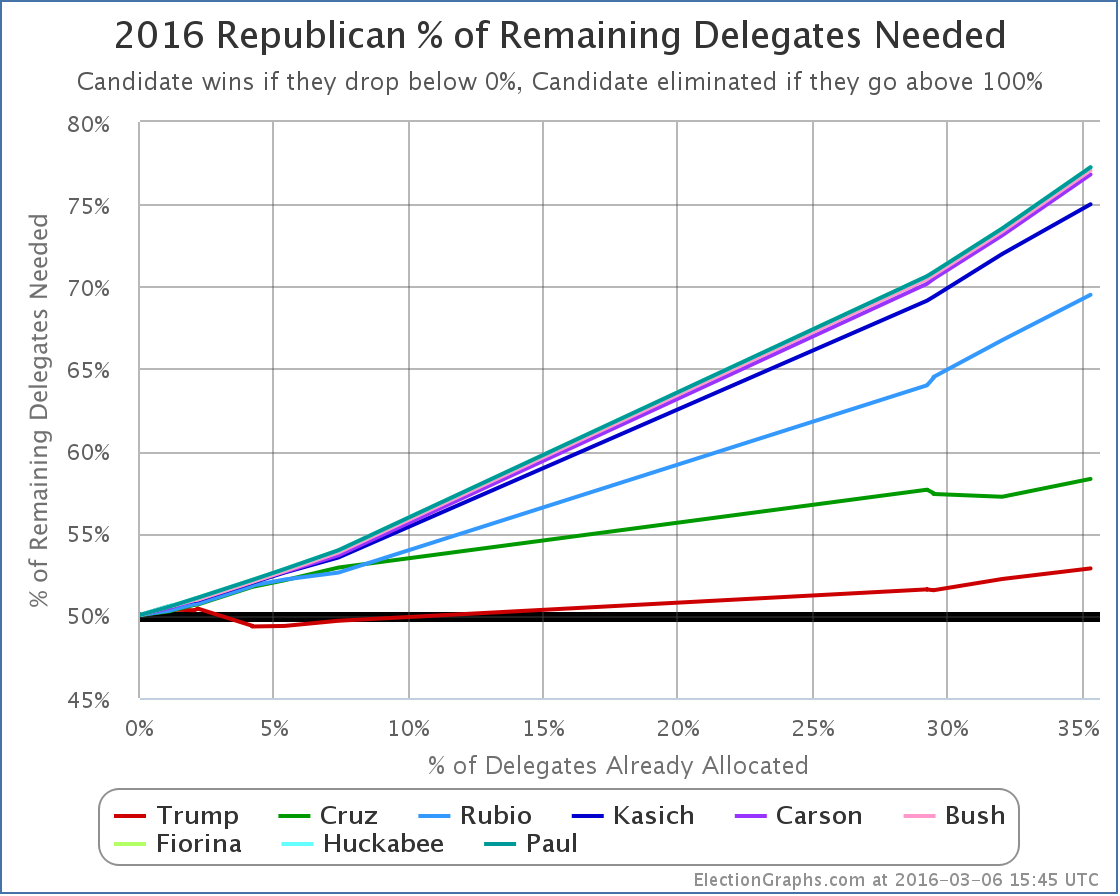
Lets look at the “% of remaining delegates needed to win” graph:
Before today, Trump needed 53.85% of the delegates to be on track for an outright win. For the night he got 48.67% of the delegates. Not quite there. So his % needed for the next contests increases to 54.39%.
This is getting high given that his history to date is only getting 44.14% of the delegates. He needs to improve his rate of delegate acquisition by about 23% to head toward an outright win.
If the remaining states were all straight proportional, it might already be time to start saying the likelyhood of the contested convention was getting to the point that anything else would be a surprise.
But the Republican contests are almost all biased at least a little bit to the winner, and starting March 15th, we have a number of high delegate winner take all states, most notably Florida and Ohio.
As I’ve been doing, lets look at the next few contests. This time lets go all the way through the big March 15th day. As usual, using RCP poll averages and delegate distribution rules from Green Papers.
Florida – 99 delegates – March 15th:
- Poll averages: Trump 40.2%, Rubio 24.4%, Cruz 17.4%, Kasich 8.4%
- Delegate estimate: Trump 99
North Carolina – 72 delegates – March 15th:
- Poll averages: Trump 32.7%, Cruz 21.7%, Rubio 15.3%, Kasich 9.7%
- Delegate estimate: Trump 30, Cruz 20, Rubio 14, Kasich 8
Illinois – 69 delegates – March 15th:
- Poll averages: Trump 32.7%, Rubio 18.7%, Cruz 17.7%, Kasich 13.3%
- Delegate estimate: Trump 37, Rubio 12, Cruz 11, Kasich 9
Ohio – 66 delegates – March 15th:
- Poll averages: Trump 39.0%, Kasich 34.0%, Cruz 15.3%, Rubio 7.0%
- Delegate estimate: Trump 66
Missouri – 52 delegates – March 15th:
- No recent polls, using national avg: Trump 36.0%, Cruz 21.8%, Rubio 18.0%, Kasich 12.0%
- Delegate estimate: Trump 52
Wyoming – 29 delegates – March 12th:
- No recent polls, using national avg: Trump 36.0%, Cruz 21.8%, Rubio 18.0%, Kasich 12.0%
- Delegate estimate: Trump 12, Cruz 7, Rubio 6, Kasich 4
District of Columbia – 19 delegates – March 12th:
- No recent polls, using national avg: Trump 36.0%, Cruz 21.8%, Rubio 18.0%, Kasich 12.0%
- Delegate estimate: Trump 9, Cruz 5, Rubio 5
Virgin Islands – 9 delegates – March 10th:
- No recent polls, using national avg: Trump 36.0%, Cruz 21.8%, Rubio 18.0%, Kasich 12.0%
- Delegate estimate: Trump 4, Cruz 2, Rubio 2, Kasich 1
Guam – 9 delegates – March 12th:
- No recent polls, using national avg: Trump 36.0%, Cruz 21.8%, Rubio 18.0%, Kasich 12.0%
- Delegate estimate: Trump 4, Cruz 2, Rubio 2, Kasich 1
Northern Marianas – 9 delegates – March 15th:
- No recent polls, using national avg: Trump 36.0%, Cruz 21.8%, Rubio 18.0%, Kasich 12.0%
- Delegate estimate: Trump 9
Now, lots of assumptions there. Also, Wyoming and some of the territories are actually directly electing delegates and we may not know their preferences on election night, so they may be listed as unbound or TBD for awhile. But lets do the addition anyway. From the above we end up with:
March 10th to March 15th estimate: Trump 322, Cruz 47, Rubio 41, Kasich 23
That would give Trump a whopping 74.36% of the delegates, well above the 54.39% he needs.
Now, because that includes some big winner take all, and some more that are winner-take-most, that is highly volatile. If he loses Florida… or Ohio, where the race is a lot closer… then things start to look worse for Trump very quickly. In terms of winning outright… not necessarily in terms of keeping the delegate lead.
But given the results above, does Trump get back to a delegate majority?
The new totals would be:
Trump 785, Cruz 409, Rubio 196, Kasich 77, Others 15
Trump would have 52.97% of the delegates. He would be back on track for an outright win.
Not only that, but 1482 of the 2472 delegates would already have been allocated. That is just a hair under 60%. Only 990 delegates would be left. And Trump would already have 785 of the 1237 delegates he would need to win outright. So he would only need 452 more delegates… or 45.66% of the remaining delegates. Which would probably be an easy ask given where the campaign would be at that point and the number of winner take all and/or winner take most states coming up. If he wins both states, the chances of a contested convention drop dramatically. We’re almost certainly looking at a clean Trump win.
Take away Ohio and Trump would no longer have a majority at this stage, and would still need 52.32% of the remaining delegates to win outright. This would still be very doable, just a little bit harder. In this scenario, we might be hanging on the edge between the contested convention and the Trump win for awhile.
Take away Ohio AND Florida and not only would Trump not have a majority, but he would need a full 62.32% of the remaining vote to win outright. This number would be more difficult to achieve, and the chances of a contested convention would then be very very high.
Now, this of course assumes the results are somewhat similar to the projections above in the other states too… but the general outlines of this are likely to remain true.
Where we are after March 15th will depend in huge part on Florida and Ohio. Right now Trump is way ahead in Florida, and has a slim lead in Ohio. But Trump has been underperforming his polls lately. If that trend continues, things may be closer than they look right now.
There are five and a fraction days left, including one more debate. So there is room for considerable movement as well.
But Trump has a significant advantage at this point. We are currently in the “contested convention” zone… but Trump is in a very good position to knock us out of there and into the “Trump wins” zone.
Note: This post is an update based on the data on ElectionGraphs.com. Election Graphs tracks both a poll based estimate of the Electoral College and a numbers based look at the Delegate Races. All of the charts and graphs seen in this post are from that site. Additional graphs, charts and raw data can be found there. All charts above are clickable to go to the current version of the detail page the chart is from, which may contain more up to date information than the snapshots on this page, which were current as of the time of this post. Follow @ElectionGraphs on Twitter or like Election Graphs on Facebook to see announcements of updates or to join the conversation. For those interested in individual general election poll updates, follow @ElecCollPolls on Twitter for all the polls as they are added.
Rubio walked away with 71% of the vote in Puerto Rico. Anything more than 50% meant that he got 100% of Puerto Rico’s 23 delegates.
In addition, some of the TBD delegates in Louisiana were determined since the post about the March 5th results. Rubio picked up 5 delegates while Cruz picked up 1. There are still 5 more delegates TBD from Louisiana. It looks like Louisiana’s rules state these should be officially uncommitted delegates, but the national rules don’t allow that this year, so… we’ll see what happens.
Anyway, that means since the last update, Rubio got 28 of 29 delegates… 96.55%! He had needed only 69.50% to be on track to catch up and win outright!
Uh, of course, nobody expects Rubio to continue at this pace in the next few states.
So lets look at where this puts the “% of remaining delegates needed to win” for the whole field:
You see that dip downward for Rubio? He does actually improve this time around. Now he only needs 68.94% of the remaining delegates to catch up and win! That still seems unlikely given he only has 17.09% of the delegates so far, but at least he went in the right direction for once.
In the mean time, everybody else’s position got worse.
Specifically, Trump moved from needing 52.88% of the remaining delegates to needing 53.85%. For each contest where he fails to reach his needed percentage, the bar for the remaining contests gets higher.
The current delegate totals are: Trump 391, Cruz 304, Rubio 154, Kasich 37… and 15 for people who have dropped out.
Next up on Tuesday for the Republicans are Hawaii, Idaho, Michigan and Mississippi. Lets take a quick look at how they look if we assume today’s RCP poll averages…
Michigan (59 delegates):
- RCP Poll average: 37.3% Trump, 19.8% Cruz, 16.8% Kasich, 15.2% Rubio
- Estimated delegates: 25 Trump, 13 Cruz, 11 Kasich, 10 Rubio
Mississippi (40 delegates):
- Only recent poll: 41% Trump, 17% Cruz, 16% Rubio, 8% Kasich, 5% Carson
- Estimated delegates: 24 Trump, 10 Cruz, 6 Rubio
Idaho (32 delegates):
- No polls, using national average: 35.6% Trump, 19.8% Cruz, 17.4% Rubio, 9.0% Carson, 8.8% Kasich
- Estimated delegates: 32 Trump
Hawaii (19 delegates):
- No polls, using national average: 35.6% Trump, 19.8% Cruz, 17.4% Rubio, 9.0% Carson, 8.8% Kasich
- Estimated delegates: 10 Trump, 5 Cruz, 2 Rubio, 1 Carson, 1 Kasich
Now, Michigan has a bunch of recent polls. Mississippi’s only recent poll is from the last week of February, which isn’t that long ago, but a lot has happened in that week. And I don’t trust using national numbers for Idaho and Hawaii at all really, but that is the best I can do with no polling at all. So where does this get us:
Projected total for March 8th: Trump +91, Cruz +28, Rubio +18, Kasich +12, Carson +1
With these projections, Trump would get 60.67% of the delegates on March 8th. That would be more than the 53.85% of the delegates he would need to improve his position.
The new totals would be: Trump 482, Cruz 332, Rubio 172, Kasich 49… and 16 for people who have dropped out.
Doing the rest of the math, that is a total of 1051 delegates. 1421 delegates would still be available. Trump would need 755 more delegates to win outright, which would be 53.13% of the remaining delegates.
So Trump would have improved his position, but not by very much.
The above assumes that the current polls hold of course. The results this weekend may indicate that Trump has been weakened by the events of the last week. If so, he may significantly underperform these estimates, putting him in a worse position. So these may be estimates that are optimistic for Trump.
And that still keeps us in the contested convention zone. For now.
Trump’s big chance to break out of that won’t come until March 15th with Florida and Ohio’s 165 winner take all delegates.
Until then, watch to see if Trump is able to match his 53.85% target line on Tuesday.
Update 2016-03-09 03:32 UTC – Update to get ready for tonight’s results. New Oklahoma estimates add one delegate for Cruz, subtract one from Trump. This does not significantly change the analysis above.
Note: This post is an update based on the data on ElectionGraphs.com. Election Graphs tracks both a poll based estimate of the Electoral College and a numbers based look at the Delegate Races. All of the charts and graphs seen in this post are from that site. Additional graphs, charts and raw data can be found there. All charts above are clickable to go to the current version of the detail page the chart is from, which may contain more up to date information than the snapshots on this page, which were current as of the time of this post. Follow @ElectionGraphs on Twitter or like Election Graphs on Facebook to see announcements of updates or to join the conversation. For those interested in individual general election poll updates, follow @ElecCollPolls on Twitter for all the polls as they are added.
The March 5th states have voted. Trump won Kentucky and Louisiana, Cruz won Kansas and Maine. But states don’t matter. Lets look at delegates:
From March 5th: Cruz +68, Trump +53, Rubio +13, Kasich +10 and 11 still TBD.
In addition since my Republican Super Tuesday post was originally published we had Cruz +8, Trump +4, Carson -1, Rubio -5 as vote counting finished and results were finalized.
So since the last post, Cruz +76, Trump +57, Kasich +10, Rubio +8, Carson -1.
Lets look at the all important “% of remaining delegates needed to win” graph:
Cruz did the best here, but in order to actually improve his position in terms of winning the nomination outright, he needed to get 57.7% of the delegates since my March 2nd update. Actual result above? 50.67% of the delegates since then. He didn’t get there.
Meanwhile, Trump only needed 51.6% of the delegates, but he only got 38.00%. He didn’t even come close to getting what he needed.
Bottom line, NOBODY is getting the delegate numbers they need for a win. This may change as things progress, but for the moment, we’re still on the narrow road to a contested convention.
All of those lines are above 50%, and all of those lines are headed up. For someone to win outright, one of those lines needs to start heading down and start driving toward zero. Right now it hasn’t happened yet.
Right now Trump needs 52.88% of the remaining delegates to win outright. So the non-Trump’s collectively need to be getting 47.12% of the delegates to force a contested convention.
I stated in the Super Tuesday post that in order to keep on this path, the non-Trump’s not only need to keep Trump above that 50% line until the big winner take all states like Florida and Ohio vote on March 15th, but they need to damage Trump to the extent that he is losing states left and right once we are in the winner take all zone. Very specifically, he probably needs to lose Florida and Ohio.
Trump underperformed his polling in the March 5th states, and Cruz exceeded his. The polling was pretty sparse, but this may indicate that the onslaught of attacks against Trump by Rubio, Cruz, and others in the last two weeks may be starting to take a toll on Trump. Perhaps his own debate performances have hurt as well by signaling a general election pivot a bit too soon… or perhaps he just finally passed some sort of line on the outrageous behavior front. Polling is frustratingly sparse in the upcoming states, so it is hard to tell what the situation is, let alone if it changed due to attacks, debates, or pivots.
The big question is: “Has Trump been damaged enough that the non-Trumps can force this to the convention?”.
Right now, we are on track for that!
Don’t get too excited about that possibility quite yet though… Current polling has Trump still ahead in a number of upcoming states, including the critical races in Florida and Ohio. If he maintains those leads, this may get pushed back into territory where Trump can win outright after March 15th. All it takes is a couple of Trump wins in big winner take all states, and dreams of a contested convention will go up in smoke.
But… but… if the damage to Trump is real and sustained, we may start seeing Trump weakness elsewhere soon, including in Florida and Ohio. If so, the chances of a contested convention will go up very quickly. (The odds of one of the non-Trumps winning outright are still very small.)
Next up, in just a few hours: Puerto Rico. As far as I can tell, there has been no polling in Puerto Rico at all. We’ll see how it goes…
[Update 17:31 UTC – Unrelated to March 5th, but looks like one Georgia delegate flipped from Cruz to Rubio as results there were finalized. This doesn’t substantively change the analysis above.]
Note: This post is an update based on the data on ElectionGraphs.com. Election Graphs tracks both a poll based estimate of the Electoral College and a numbers based look at the Delegate Races. All of the charts and graphs seen in this post are from that site. Additional graphs, charts and raw data can be found there. All charts above are clickable to go to the current version of the detail page the chart is from, which may contain more up to date information than the snapshots on this page, which were current as of the time of this post. Follow @ElectionGraphs on Twitter or like Election Graphs on Facebook to see announcements of updates or to join the conversation. For those interested in individual general election poll updates, follow @ElecCollPolls on Twitter for all the polls as they are added.
The Republican Super Tuesday is over with the exception of a handful of delegates that were still undetermined when it was time for me to start writing up the results.
Last Tuesday I used polling to project what Super Tuesday would look like for the Republicans. The projection looked like this:
Estimate: 294 Trump, 246 Cruz, 67 Rubio, 11 Kasich, 6 Carson
We’ll dispense with the state by state totals, and jump right to the final results:
Actual: 252 Trump, 211 Cruz, 101 Rubio, 16 Kasich, 4 Carson, 6 TBD
The 6 that are still to be determined as of this update are from Tennessee (3 delegates) and Texas (3 delegates), but they won’t make much of a difference here.
The poll based estimates were not quite as close as they were for the Democrats. This may simply be because I did the estimates a full week out based on relatively sparse polling. There were a lot of polls in that last week, and it may well be that the results would have been closer if I had redone the analysis on Monday.
The general outlines of the estimate and the analysis based on them were basically correct though. The one notable difference is that Rubio did considerably better than the estimates, at the expense of both Trump and Cruz’s delegate totals. It appears that Rubio’s week of anti-Trump crusading may have worked.
The main consequence is that Trump was pushed a bit further away from the levels he needed to actually improve his position relative to last week. He was expected to lose ground anyway, but he lost more than it looked like he was going to. It was enough to push Trump back down below 50% of the delegates allocated so far:
On this metric, Cruz looks like he did the best coming out of Super Tuesday. But this is the wrong number to be looking at. The all important thing to be looking at is the “% of remaining delegates needed to win”:
Everybody’s position got worse! (Remember down is good on this chart… getting down to 0% means you win, going up to 100% means you are eliminated.)
Trump needed to get 49.4% of the Super Tuesday delegates to improve his position in terms of getting to a clean first ballot win. Instead, he got 43.1% of the delegates so far. So his “% of remaining delegates to win” increased to 51.6%.
We are back in the zone where if everybody performs the same as they have so far, we end up with Trump having more delegates than anybody else, but a bit short of the majority he would need to win. The “contested convention” scenario.
At this point the closest competitor is Cruz, who would need 57.7% of the remaining delegates in order to catch up and win outright. Next closest is Rubio, who would need 64.0% of the remaining delegates. Given their past performances, it seems unlikely that either will reach anything close to those numbers, especially since they both seem determined to stay in the race. It would take one of them dropping out AND a complete Trump collapse to enable that. This seems like an unlikely scenario at this point.
But both the Cruz and Rubio campaigns are now starting to openly talk about a contested convention. To do that, neither Cruz or Rubio need to get super-majorities of the remaining delegates. They don’t even need to get majorities. They don’t even need to have a majority of the delegates between them. They just need to keep Trump to less than 51.6% of the remaining delegates.
So Cruz + Rubio + Kasich (now that Carson has dropped out) just need to manage to get 48.4% of the remaining delegates between them. And if they successfully do that, they will need even less the next time around.
At this point, the best strategy to “stop Trump” is not for more people to drop out. It is for all three of the remaining non-Trumps to stay in to try to get as many delegates as they can, even if they know they can’t get to an outright win either. Strategies have been suggested such as the candidates working together and encouraging their supporters to vote for whichever non-Trump was strongest in each state in order to maximize the delegate totals. Then they would work it out at the convention.
That kind of coordination between rival campaigns is unlikely. But it could happen to some degree spontaneously between now and March 15th, just by the nature of having four candidates still in the race. Even though Trump is leading in a lot of the states in the next couple of weeks, it is possible the non-Trumps could keep him below that 51.6% target, and thus be on the road to a contested convention.
But… starting March 15th there are winner take all states. Not just states where the delegate totals are heavily weighted to the winner, but pure unadulterated winner take all. If Trump is below 50% of delegates at that point, but not by all that much, and he is still leading the polls, then starting on March 15th, he’ll just start cleaning up and get back over 50% very rapidly, and then close out the contest.
In order to actually force a contested convention, the non-Trumps not only have to keep him below 51.6% of the delegates that are being doled out in the next couple weeks, they either have to keep him MUCH lower than that number in the next two weeks, or they have to damage him so much that by March 15th he is losing states left and right and the others can continue to pick up large numbers of delegates in the winner take all zone. Of course, the two might have to come together.
The odds of a non-Trump winning the nomination outright are now negligible absent a major event that destroys Trump’s prospects.
The ability to deny Trump a majority is still alive though. But the time for even that is running out quickly. The non-Trumps basically have two weeks.
Of course, Trump might still come out of a contested convention as the nominee, especially if he came in with a plurality of the delegates that wasn’t very far from the 50% mark. But all kinds of things can happen at a contested convention, including the emergence of a nominee who wasn’t even running. You never know.
One final thing before closing up. I have heard a lot of commentary saying that if any other candidate besides Trump was in the position he is in, he would already be being called the presumptive nominee. Maybe. But we really aren’t quite there yet.
Trump is definitely leading. He has better chances than anybody else of ending up the nominee. But at the same time…
Trump is clearly behind where either Romney or McCain were at this stage in the process. Digging up data from my 2008 and 2012 delegate tracking…
We are currently at the point where about 29% of the delegates have been allocated. Super Tuesday was bigger in 2008, so we don’t have a data point between about 10% and 42%, but you can see that in that Super Tuesday event, McCain took a clear lead, leaving all of the competitors behind. Although things were still a muddle before Super Tuesday, from that point forward there was no stopping McCain. His dominance was unmistakeable.
In 2012, Romney was over 50% of delegates earned almost from the very beginning. He continued to hover just below 50% of remaining delegates needed to win though, leading for continued talk of a possible brokered convention for awhile longer. It took until we got past 45% of delegates for Romney to really pull away and eliminate that possibility, making it a clean win.
2012 is probably the closest parallel to where we are today, but Romney never dropped below 50% of delegates after that first few percent at the beginning of the race. Trump is weaker than that at the moment… and his opponents are stronger. But the gap isn’t large. He trails Romney, but not by much.
We’re going to go from just under 30% of delegates determined today, to just under 60% after March 15th. Things will move very quickly, and if there really is going to be a good chance of a contested convention, the groundwork will be laid in these two weeks. If the non-Trumps want to stop Trump, that almost certainly needs to be the game plan at this point. And it has to start bearing fruit NOW.
[Update 2016-03-03 02:34 UTC – The 6 TBD delegates in Tennessee and Texas have been resolved, and there were other adjustments as results continues to be tabulated. Net changes happened in four states: Arkansas (Trump -1, Cruz +1), Massachusetts (Trump +1, Carson -1), Tennessee (Trump +2, Cruz +2, Rubio -1) and Texas (Cruz +4, Trump +2, Rubio -3). Total change for this update: Cruz +7, Trump +4, Carson -1, Rubio -4. New overall delegate totals are: Trump 338, Cruz 235, Rubio 113, Kasich 27, Carson 8, Bush 4, Fiorina 1, Huckabee 1, Paul 1. These changes do not substantively change the analysis above.]
[Update 2016-03-04 02:53 UTC – Update for Georgia: +1 Cruz, -1 Rubio.]
Note: This post is an update based on the data on ElectionGraphs.com. Election Graphs tracks both a poll based estimate of the Electoral College and a numbers based look at the Delegate Races. All of the charts and graphs seen in this post are from that site. Additional graphs, charts and raw data can be found there. All charts above are clickable to go to the current version of the detail page the chart is from, which may contain more up to date information than the snapshots on this page, which were current as of the time of this post. Follow @ElectionGraphs on Twitter or like Election Graphs on Facebook to see announcements of updates or to join the conversation. For those interested in individual general election poll updates, follow @ElecCollPolls on Twitter for all the polls as they are added.
Once again the headline out of a state is Trump winning. In Nevada the delegate count was:
14 Trump, 7 Rubio, 6 Cruz, 2 Carson, 1 Kasich
To be on the glide path for a 1st ballot victory though, Trump needed 15 of the 30 delegates. So he fell slightly short.
Now, don’t misunderstand. This is still an impressive victory, and looking at the upcoming states he has a clearer path to victory than anybody else. His margins were higher in Nevada than many people expected. But if today’s performance was replicated in all of the other states, Trump would come to the convention with more delegates than anybody else, but not the majority needed to win outright. Of course as we continue more people will drop out, and the amount with which states give bonuses to the winners increases, so that still seems like an unlikely final outcome.
Right now Trump continues to do everything he needs to do to win. Lets look at some of the graphs, then we’ll do a quick look at the March 1st “Super Tuesday” states.
The overall delegate count is now:
81 Trump, 17 Cruz, 17 Rubio, 6 Kasich, 5 Carson, and 7 for people who have dropped out
Trump continues to dominate. Lets look at this as percentages:
The “winners” here were actually Cruz, Rubio and Carson. Each of them improved their proportion of delegates with Nevada’s results. Trump actually went down. He doesn’t have to worry too much about that though. He still has a majority of the delegates allocated so far, and he is far far ahead of any of his opponents.
Finally, lets look at the “% of remaining delegates needed to win”, which I argue is the single most important thing to look at to understand where the race really is:
Because Trump got 14 delegates instead of 15 delegates, his line goes up a little bit. (Remember, on this chart down is good, up is bad.) The red line goes from needing 49.39% of the remaining delegates to needing 49.42%. This is a relatively trivial difference though. It is basically flat. Trump’s situation is very close to unchanged.
Meanwhile, the other lines keep going up at a decent pace. Kasich and Carson add about 0.6% to their numbers. Cruz and Rubio add about 0.4%.
This should be obvious, but the more they lose, the harder it is to catch up.
Many people are still talking about how as consolidation happens, the remaining non-Trumps will do better and the picture will change. Maybe, but nobody new announced they were dropping out after the Nevada results (yet anyway). So it looks like we may still go into March 1st with a five person race.
Lets run a hypothetical using current polling on the Super Tuesday states and see where we end up using RCP poll averages for the five remaining candidates. We’ll make delegate estimates based on the specific delegate allocation rules in each state.
Texas (155 delegates)
- Current poll averages: 37.3% Cruz, 28.0% Trump, 11.7% Rubio, 4.7% Carson, 3.0% Kasich
- Delegate estimates: 99 Cruz, 56 Trump
Georgia (76 delegates)
- Current poll averages: 35.0% Trump, 22.7% Cruz, 19.3% Rubio, 7.3% Carson, 6.3% Kasich
- Delegate estimates: 50 Trump, 26 Cruz
Tennessee (58 delegates)
- Last poll from November so using national average: 33.6% Trump, 20.4% Cruz, 16.4% Rubio, 9.8% Kasich, 7.4% Carson
- Delegate estimates: 37 Trump, 21 Cruz
Alabama (50 delegates)
- Last poll from December so using national average: 33.6% Trump, 20.4% Cruz, 16.4% Rubio, 9.8% Kasich, 7.4% Carson
- Delegate estimates: 32 Trump, 18 Cruz
Virginia (49 delegates)
- Using only February poll: 28% Trump, 22% Rubio, 19% Cruz, 7% Kasich, 7% Carson
- Delegate estimates: 17 Trump, 13 Rubio, 11 Cruz, 4 Kasich, 4 Carson
Oklahoma (43 delegates)
- Using only February poll: 32.5% Trump, 25.0% Cruz, 15.5% Rubio, 7.0% Carson, 0.0% Kasich
- Delegate estimates: 17 Trump, 15 Cruz, 11 Rubio
Massachusetts (42 delegates)
- Current poll averages: 41.0% Trump, 17.0% Rubio, 10.0% Cruz, 7.5% Kasich, 3.5% Carson
- Delegate estimates: 23 Trump, 9 Rubio, 6 Cruz, 4 Kasich
Arkansas (40 delegates)
- Using only February poll: 27% Cruz, 23% Trump, 23% Rubio, 11% Carson, 4% Kasich
- Delegate estimates: 18 Cruz, 13 Rubio, 9 Trump (giving Rubio the 2nd place finish breaking 23% tie by alphabetical order)
Minnesota (38 delegates)
- Last poll from January so using national average: 33.6% Trump, 20.4% Cruz, 16.4% Rubio, 9.8% Kasich, 7.4% Carson
- Delegate estimates: 18 Trump, 11 Cruz, 9 Rubio
Wyoming (29 delegates)
- No polls at all, using national average: 33.6% Trump, 20.4% Cruz, 16.4% Rubio, 9.8% Kasich, 7.4% Carson
- Delegate estimates: 12 Trump, 7 Cruz, 5 Rubio, 3 Kasich, 2 Carson
Alaska (28 delegates)
- Last poll from January so using national average: 33.6% Trump, 20.4% Cruz, 16.4% Rubio, 9.8% Kasich, 7.4% Carson
- Delegate estimates: 13 Trump, 8 Cruz, 7 Rubio
Vermont (16 delegates)
- No polls at all, using national average: 33.6% Trump, 20.4% Cruz, 16.4% Rubio, 9.8% Kasich, 7.4% Carson
- Delegate estimates: 10 Trump, 6 Cruz
OK, that’s it. Adding all that up…
Estimated Super Tuesday delegate totals: 294 Trump, 246 Cruz, 67 Rubio, 11 Kasich, 6 Carson
That gives Trump 47.1% of the super Tuesday delegates, Cruz 39.4%, and everyone else much less.
Trump needs 49.4% of the delegates to be on the path to an outright win though! So 47.1% would be in the realm where heading to a contested convention might be possible! Still unlikely, as the additional states in March will add up fast, and more candidates are likely to drop out. Still though, possible!
Adding in the existing delegates, we’d have a post-Super Tuesday race that looks like this:
375 Trump, 263 Cruz, 84 Rubio, 17 Kasich, 11 Carson, 7 for candidates who have already dropped out
Now, these are estimates based on current polling, and very few of these states were well polled as of this post, so much of the above is based on one or two polls, or using the national averages rather than state polls. And I had to make the assumption that all congressional districts would mirror state results (which is unlikely to be true). And Wyoming actually elects individual delegates rather than doing things based on candidate preference, so it may be an oddball in the end. And of course things are likely to change further before people actually vote next Tuesday. But… the general outlines of this aren’t likely to be too far off.
If this is even remotely close to where we are on March 2nd, we end up with Trump very close to the 50% of delegate mark. (The above has him EXACTLY at that mark.) He would need just a LITTLE bit more to actually push him over the edge to a clean win.
The flip side of that though is the combination of all the anti-Trumps would need just a LITTLE bit more in order to have this be on the path to a contested convention. I mentioned earlier that this is still an unlikely outcome. It is. After March 1st, the disproportionality of delegates given to the winner increases, and after March 15th we have pure winner take all states as well. If Trump remains in the overall lead, even with a plurality, then that is all it takes to push him over the edge.
If the anti-Trumps want to have any hope here at all, they need to be in a position by mid-March that they can win not just a few, but many states of the winner-take-most and winner-take-all variety. And frankly, the most likely scenario even then is just forcing a contested convention where Trump still has the most delegates, not someone else winning outright.
The anti-Trumps would have a hard road to get to an outright win. Cruz would need 56.8% of the remaining delegates to catch up and win after March 1st if things played out like my estimates above.
If you had to make a guess based on what we know now, a Trump nomination is far more likely than any other… and with an outright delegate majority on the first ballot, not after a contested convention.
6 days until Super Tuesday. We’ll see how close my estimates above turn out to be.
Update 2016-02-26 07:17 UTC – On February 22nd New Hampshire certified the results of their primary. In the final tally Trump had one more delegate than previous estimates, and Rubio one less. This did not seem worthy of a separate post, but a note here seemed appropriate. The totals on ElectionGraphs.com have been updates appropriately. This does not substantively change any of the analysis above.
Note: This post is an update based on the data on ElectionGraphs.com. Election Graphs tracks both a poll based estimate of the Electoral College and a numbers based look at the Delegate Races. All of the charts and graphs seen in this post are from that site. Additional graphs, charts and raw data can be found there. All charts above are clickable to go to the current version of the detail page the chart is from, which may contain more up to date information than the snapshots on this page, which were current as of the time of this post. Follow @ElectionGraphs on Twitter or like Election Graphs on Facebook to see announcements of updates or to join the conversation. For those interested in individual general election poll updates, follow @ElecCollPolls on Twitter for all the polls as they are added.
[Edit 16:28 UTC to correct math on % of remaining Cruz would need after Super Tuesday, I’d originally shown a higher number around 61%.]
[Edit 2016-02-27 17:06 UTC to fix place where Kasich had been autocorrected to Quash.]
[Edit 2016-02-28 22:03 UTC to add dropped out candidates to the after Super Tuesday estimate.]
To be on a pace to win, Trump needed 26 of the 50 delegates in South Carolina. Instead, he got all 50 of them. Just as this site pointed out was very likely on the 10th and again on the 11th. I’ve seen some surprise at this result in some of the commentary, but absent the polls being way off, this was predictable weeks ago.
Delegate rules matter. The popular vote is only relevant in terms of how it determines the delegates.
So Trump jumps way up in the delegate race:
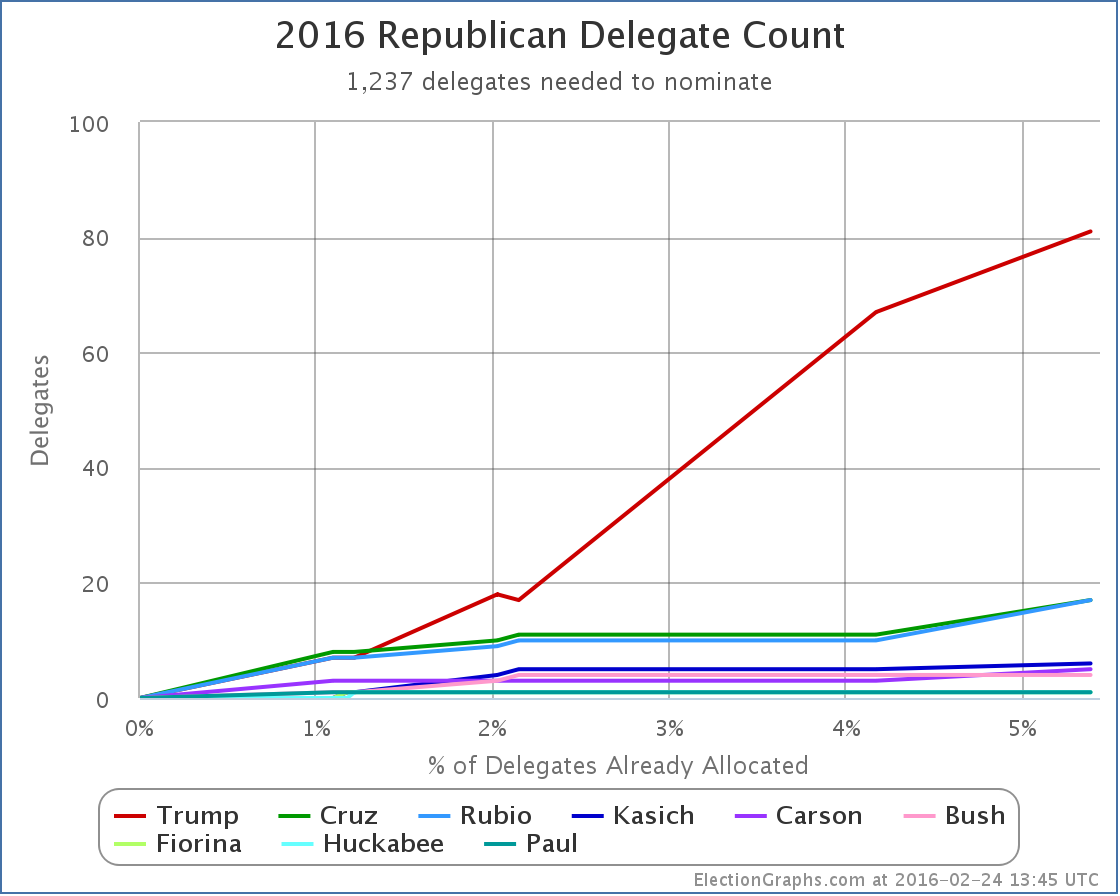
So… 67 Trump, 11 Cruz, 10 Rubio, 5 Kasich, 3 Carson, and 7 for people who have dropped out.
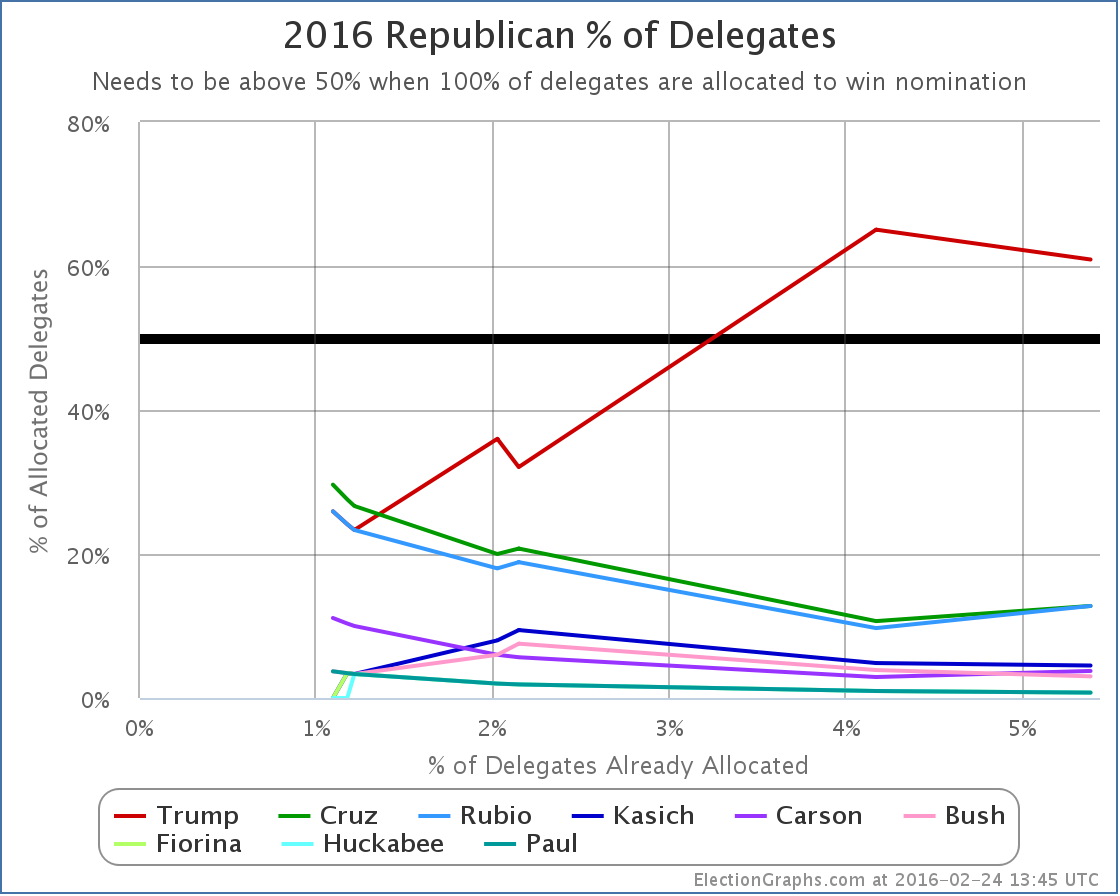
Lets look at this in percentage terms:
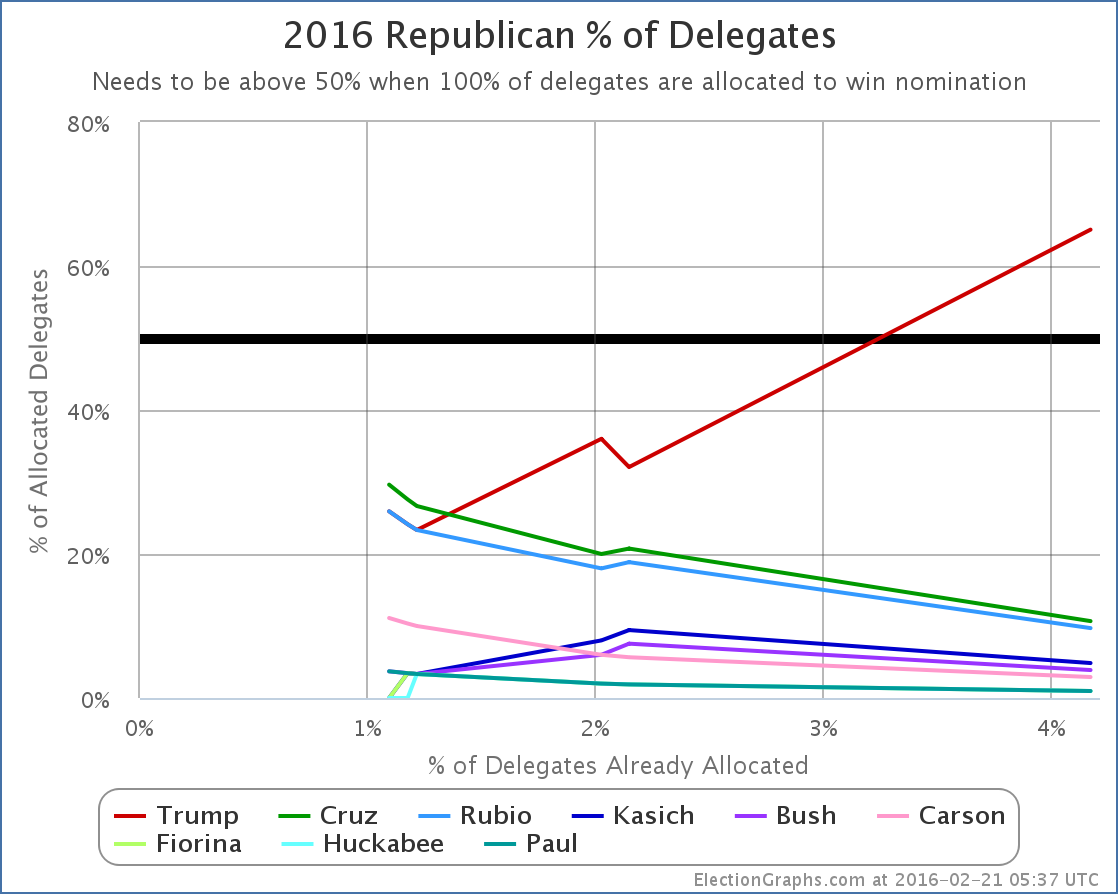
Trump now has more than 50% of the delegates allocated so far. About 65% of them. That is just under 2/3 of the delegates.
Now, we’re only 4.2% of the way through the delegates, but at this point Trump is dominating.
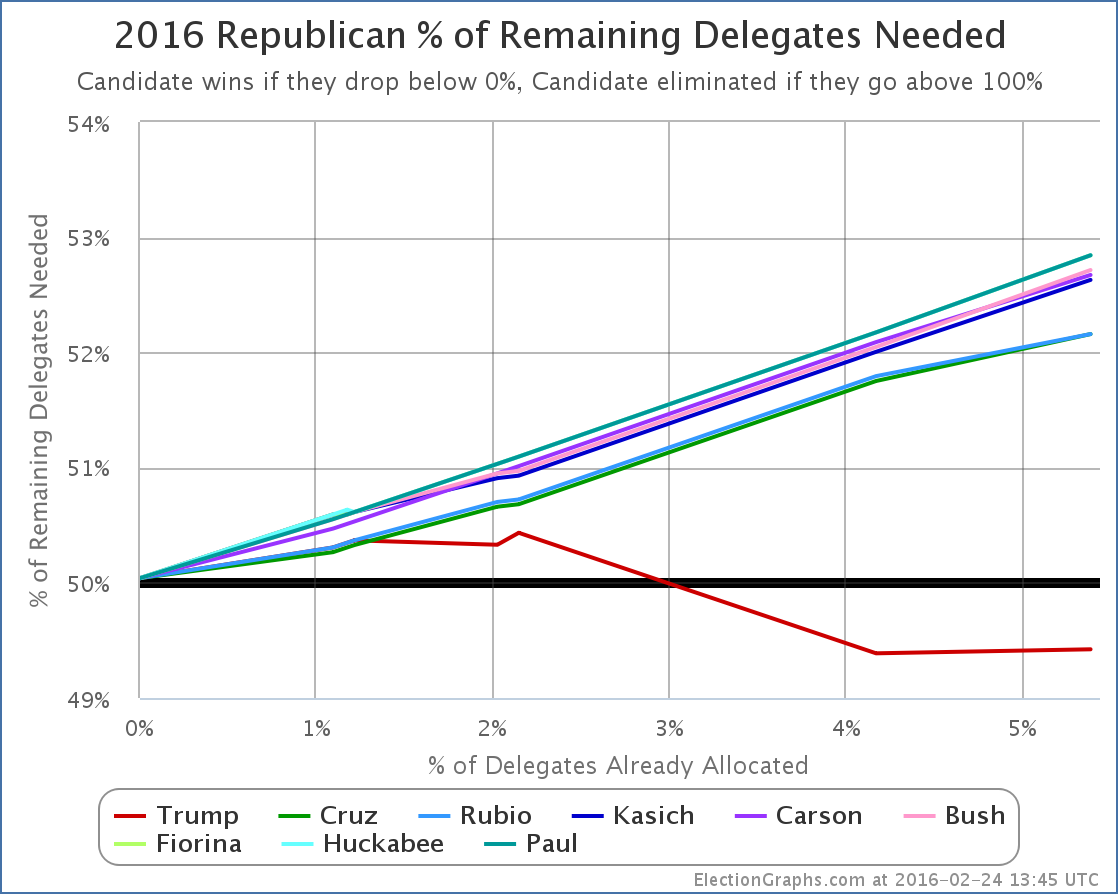
How about “% of remaining delegates needed to win”?
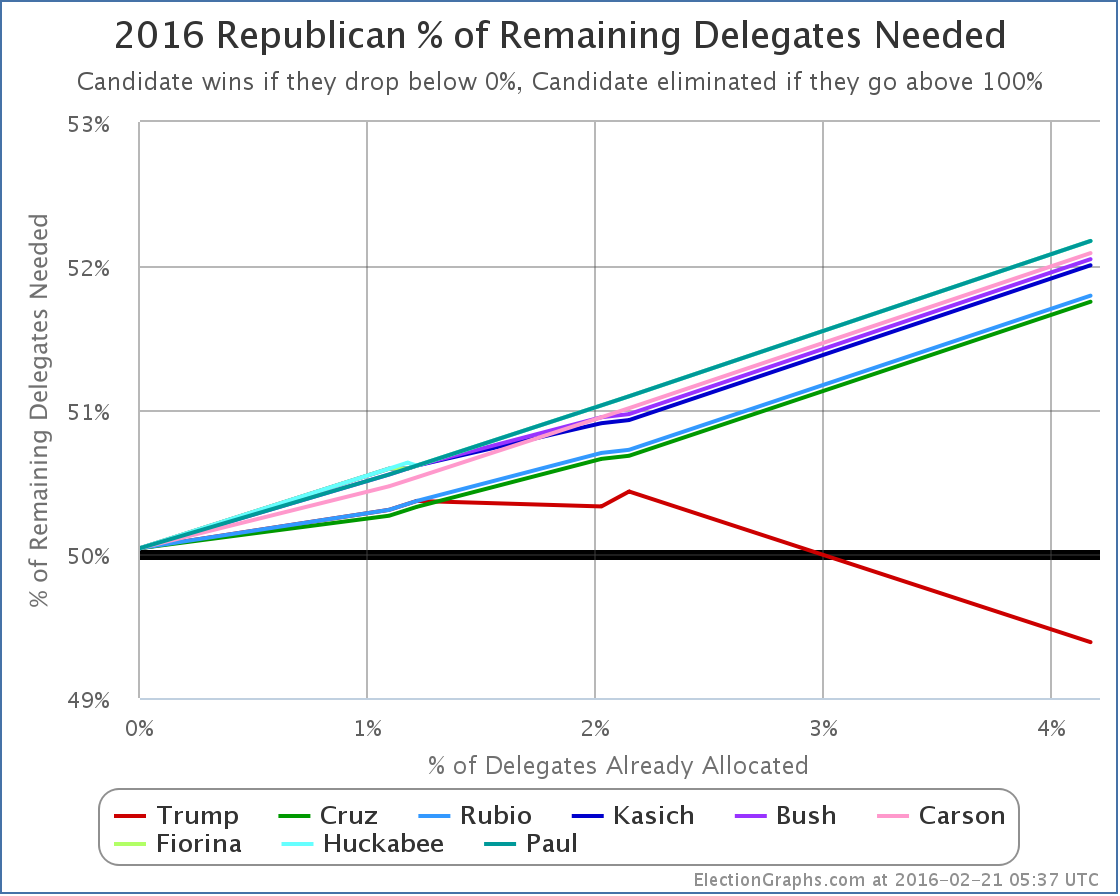
Now that he has a majority, Trump’s line dives down. (Down is good on this graph.) He now only needs 49.39% of the remaining delegates to win.
More importantly though, because of how the delegates split between his opponents, they are all just racing upward. Cruz is second right now, and he now needs 51.75% of the remaining delegates in order to win. Now, this still isn’t a crazy number, although obviously Cruz hasn’t come close to it in any contest yet. But… time is running out.
We are down to five candidates after South Carolina. It is possible we will lose more after Nevada in a couple days. But most polling and modeling I have seen says Trump wins in a five way race, in a four way race, and even in a three way race. It takes bringing it down to a two person race before the non-Trump starts winning. The question is if that happens fast enough to “Stop Trump”.
With the number of delegates determined between March 1st and March 15th, if such a move is going to happen, it has to happen very quickly. Still having 3+ candidates when the March 1st votes happen puts Trump in a very strong position. If we’re not down to 3 before March 15th, Trump may just be wrapping things up.
Or something dramatic could happen that changes everything. You never know.
For now though, polls in Nevada and the March 1st states look good for Trump, and we still have five people in the race.
Trump is on a path to victory.
Nevada is up next on Tuesday.
Note: This post is an update based on the data on ElectionGraphs.com. Election Graphs tracks both a poll based estimate of the Electoral College and a numbers based look at the Delegate Races. All of the charts and graphs seen in this post are from that site. Additional graphs, charts and raw data can be found there. All charts above are clickable to go to the current version of the detail page the chart is from, which may contain more up to date information than the snapshots on this page, which were current as of the time of this post. Follow @ElectionGraphs on Twitter or like Election Graphs on Facebook to see announcements of updates or to join the conversation. For those interested in individual general election poll updates, follow @ElecCollPolls on Twitter for all the polls as they are added.
|
|