This is the website of Abulsme Noibatno Itramne (also known as Sam Minter).
Posts here are rare these days. For current stuff, follow me on Mastodon
|
Clinton and Sanders left the Wyoming caucuses with a 7 to 7 delegate tie.
In the mean time, since Wisconsin Sanders has been winning the superdelegate race. The net change over that time has been Sanders +7, Clinton +2. This actually includes one delegate that actually did indeed switch from Clinton to Sanders (with a couple days as uncommitted in between). So far, that has been a very rare event. Perhaps it is the beginning of a trend? If so, I will of course note it here.
Adding up the changes since Wisconsin, we get Sanders +14, Clinton +9. This means Sanders has gotten an impressive 60.87% of recent delegates…
…which is not enough. Sanders needed to get better than 67.76% of the delegates to be on pace to catch up and win.

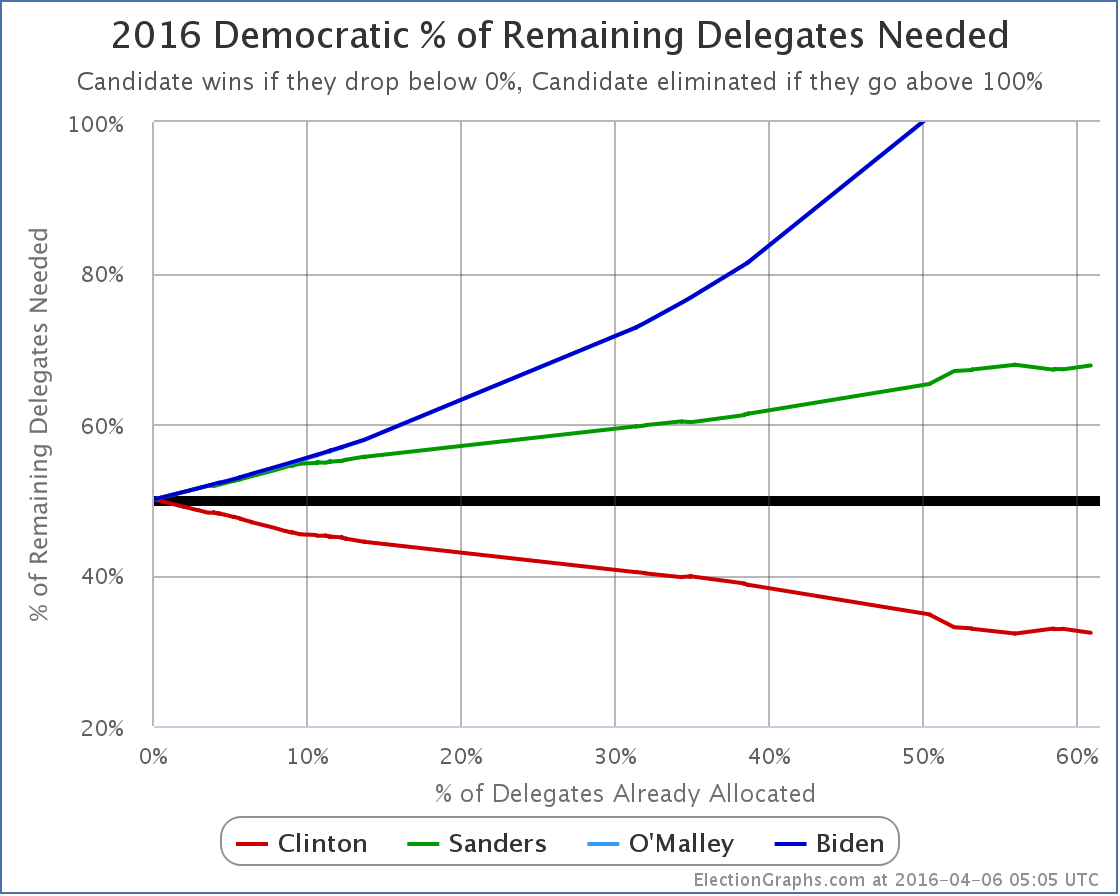
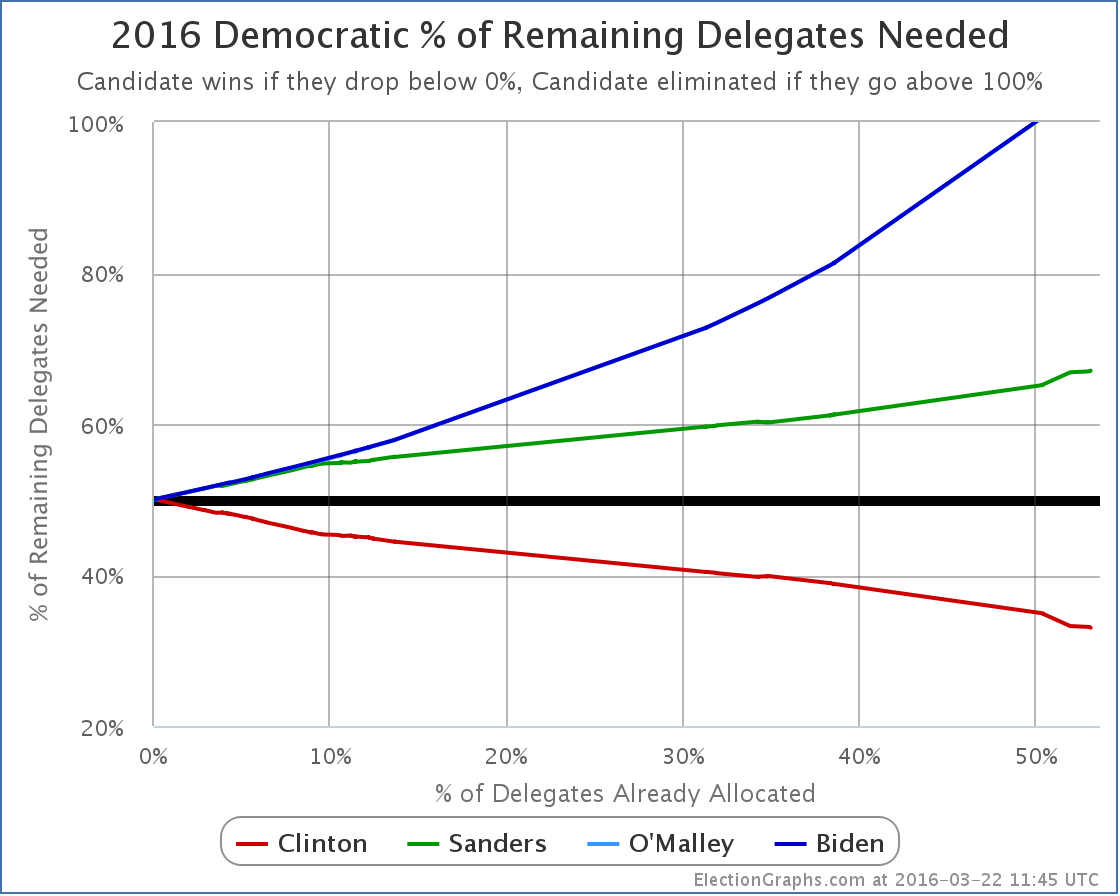
The percentage of the remaining delegates Sanders needs to win is now 67.84%. There have been some ups and downs, but basically Sanders had been able to keep things at 67.xx% since March 17th. This represents Sanders’ string of wins. Those wins have prevented Sanders’ situation from getting much worse, but critically he has not succeeded in actually bending his line downward to start heading to an actual win.
Clinton only needs 32.27% of the remaining delegates (including superdelegates) in order to win. This is not a high bar. To be absolutely clear here, this means Sanders could win every remaining contest by an absolutely stunning margin… and Clinton would still win the nomination because it wouldn’t be enough to catch up.
Of course, the Sanders argument is that if he did indeed continue winning almost every contest, the superdelegates would finally start coming to his side in large numbers, and would change those dynamics. Maybe. He has to actually do that first. And make sure that his efforts to sway the superdelegates don’t backfire and make them even more strongly committed to Clinton than they were before.
New York is up next of course. Clinton is currently leading the RCP poll average there by 14%. There are 247 delegates at stake. If the delegates in New York split according to current polls, then as a rough estimate Clinton will get 142 delegates and Sanders will get 105. That would leave Sanders needing 71.76% of the remaining delegates to catch up, and Clinton only needing 28.37% to get to the magic number and wrap things up.
The Sanders folks are tenacious, but actually winning the nomination would still take something catastrophic happening to Clinton’s campaign. The reason for Sanders to continue at this point is primarily to influence Clinton and pull her toward Sanders’ positions presumably. Unless the Sanders camp really is just hoping that Clinton will indeed implode at some point.
We will see.
[Update 2016-04-13 15:08 UTC – Superdelegate scan nets Clinton +4, Sanders +1. In addition an adjustment from Colorado yields Sanders +1, Clinton -1. Net for today’s changes, Clinton +3, Sanders +2.]
[Update 2016-04-17 02:20 UTC – Update from Colorado Democratic State Convention today. Net change: Sanders +2, Clinton -2.]
[Update 2016-04-17 14:19 UTC – Superdelegate scan nets Sanders +1, Clinton -1.]
[Update 2016-04-20 01:20 UTC – Superdelegate scan net: Clinton -2.]
Note: This post is an update based on the data on ElectionGraphs.com. Election Graphs tracks both a poll based estimate of the Electoral College and a numbers based look at the Delegate Races. All of the charts and graphs seen in this post are from that site. Additional graphs, charts and raw data can be found there. All charts above are clickable to go to the current version of the detail page the chart is from, which may contain more up to date information than the snapshots on this page, which were current as of the time of this post. Follow @ElectionGraphs on Twitter or like Election Graphs on Facebook to see announcements of updates or to join the conversation. For those interested in individual general election poll updates, follow @ElecCollPolls on Twitter for all the polls as they are added.
Sanders won Wisconsin. Sanders got 48 delegates to Clinton’s 38. That’s 55.8% of the delegates.
Add in superdelegates and other changes since Washington, Hawaii and Alaska and it becomes Sanders +48.5, Clinton +44. That’s 52.4% for Sanders.
But Sanders needed 67.0% of the delegates to actually get closer to the nomination given that the pool of remaining delegates is dwindling. So the percentage of the remaining delegates Sanders needs to catch up and win increases despite the win.
Before Washington, Hawaii, and Alaska, Sanders needed 67.84% of the remaining delegates to win. After his big wins in those contests, this declined to 67.03%. We’re now back to 67.76%. Sanders hasn’t lost all the ground he won, but he has lost most of it.
Winning states isn’t enough. To catch up Sanders would have to be routinely winning by massive margins. That hasn’t been happening.
In recent posts, I’ve also included calculations for an “if superdelegates didn’t exist” scenario. Even these show a very hard road for Sanders. Recently even some Sanders surrogates have started to acknowledge that catching Clinton in pledged delegates via primaries and caucuses may be a near impossible task.
Now the optimistic scenario for the Sanders camp seems to be that while they don’t catch Clinton in pledged delegates, they win so many states, are close enough, and have so much “momentum” that superdelegates going to Sanders would give him the nomination at the convention. Just a few weeks ago Sanders supporters were saying that superdelegates overturning the pledged delegate results would be a travesty of justice… but things change I guess.
We now essentially have even the Sanders camp saying the right way to look at the race is to include the superdelegates and their preferences. Because it is clear that any possible path to victory involves superdelegates.
Given that, there are about 207 superdelegates who have not yet expressed any preference that Sanders can woo. Just like delegates from primaries and caucuses, to be on a pace to catch up and win, Sanders needs to get over 67.76% of those delegates to come over to his side. Or, of course, he can try to convince some of the about 474 superdelegates who have already said they are supporting Clinton to change their minds.
So far there have not been any significant superdelegate moves toward Sanders.
If that does start to happen, you will of course see it here.
[Update 2016-04-08 17:57 UTC – Superdelegate scan plus updated results in Arizona and Kansas yield a net change of Clinton +2, Sanders +2. This does not substantially change the analysis above.]
[Update 2016-04-09 15:53 UTC – Superdelegate scan, net change: Sanders +4, Clinton -1.]
[Update 2016-04-10 14:59 UTC – Superdelegate scan, net change: Clinton +1, Sanders +1.]
Note: This post is an update based on the data on ElectionGraphs.com. Election Graphs tracks both a poll based estimate of the Electoral College and a numbers based look at the Delegate Races. All of the charts and graphs seen in this post are from that site. Additional graphs, charts and raw data can be found there. All charts above are clickable to go to the current version of the detail page the chart is from, which may contain more up to date information than the snapshots on this page, which were current as of the time of this post. Follow @ElectionGraphs on Twitter or like Election Graphs on Facebook to see announcements of updates or to join the conversation. For those interested in individual general election poll updates, follow @ElecCollPolls on Twitter for all the polls as they are added.
Although the best delegate tallies are still estimates that will almost certainly change a bit before they are final, the general outline will not change. Sanders crushed Clinton in all three states that caucused on March 26th. With Washington, Hawaii and Alaska together, the delegate haul was 104 for Sanders to only 38 for Clinton.
Since the last update Sanders has also been on a roll gaining four new superdelegates (while Clinton got no new supers), and having four delegates move from Clinton to Sanders as results in states that voted earlier got finalized.
Between all that, since the 23rd the net change is Sanders +112, Clinton +34.
So Sanders got a whopping 76.71% of the delegates since the 23rd. That is well above the 67.70% he needed to improve his position in the race in terms of the % of the remaining delegates needed to win. So unlike some Sanders “wins” where he gets the most delegates but still just ends up in a worse position because he didn’t win by enough, this time Sanders supporters are fully justified in celebrating the win.
See that downward slope right neat the end of the green line? That is the improvement in Sander’s position because of these three states. Despite all the states that Sanders has won, this has not happened often. Aside from days when a stray superdelegate committed to him or when states revised their results by a delegate here or there, the only previous times so far where Sanders has improved his position are February 9th when he won New Hampshire and March 6th when he won Maine. (OK, probably Democrats Abroad too.) This new result on March 26th swamps both of those in the magnitude of the improvement.
With all of the results and adjustments since Arizona, Idaho and Utah last week, Sanders goes from needing 67.70% of the remaining delegates to win, to needing only… 67.03%.
So… an improvement of… 0.67%.
So, uh… big improvement? Suddenly the Sanders path to victory is clear? Well, it is the biggest improvement in this metric Sanders has seen yet, but…
No.
March 26th was a big Sanders win. That should not be minimized. If he matched the March 26th performance in every contest from here to the end of the primary season, he would indeed catch up to Clinton and win. And the visibility of wins like the 26th may help Clinton seem weak, and may improve Sanders’ performance in future contests.
But the basic situation has not changed significantly. 67% of delegates is still an incredibly high bar. Sanders would have to consistently meet that bar for the rest of the race in order to win outright.
But wait you say, once again this is all including superdelegates. But surely if Sanders won in pledged delegates, the superdelegates wouldn’t deny him the win and would switch to Sanders en masse because to do otherwise would be unseemly? Well, I generally reject starting with that premise and say lets watch the superdelegates and see what they actually do.
But for the moment, as I did once before, let me run the numbers pretending superdelegates don’t exist.
With supers the totals right now are Clinton 1735, Sanders 1069.5, O’Malley 1
Without supers that becomes Clinton 1264, Sanders 1040.
Without supers there are 4050 delegates, and you need 2026 to have a majority.
Sanders would need 976 more delegates to have that majority of pledged delegates. There are 1746 more pledged delegates available.
That means Sanders would need 55.90% of the pledged delegates remaining to end the season with a majority of the pledged delegates.
That bar is a LOT lower than 67%. Consistently beating 67% seems close to unimaginable without a complete implosion. But 56%? Could you get to that just through some momentum, some positive press cycles and good campaigning? Maybe. It seems like it is on the outer edge of the possible given the history so far, but still possible.
If Sanders did succeed at that, he would still need to get a large number of Clinton superdelegates to defect in order to actually win. But Sanders has said he is ramping up his efforts to woo superdelegates. He has gone from saying superdelegates should be ignored, to acknowledging that any realistic path to a win involves getting superdelegates to vote for him too.
If superdelegates do start to defect, you will of course see it on the graphs here.
One last comparison, updating the one I did two weeks ago:
Granting for the moment the premise that the results on the 26th are not an outlier, but are instead indicative of an inflection point in the race, you see that compared to Obama 2008, Sanders starts his “turn” on the graph later (at about 56% rather than at about 49%) and that he is much much further behind that Obama was. Just barely past this point in 2008 is when Obama took the delegate lead. Sanders is far from that.
Meanwhile, Clinton is in a much stronger position than Obama was until very nearly the end.
If this is a “turn”, and Sanders drives his line down and eventually wins, it will be one of the largest come from behind wins in modern times. This is not impossible, but it is still highly unlikely.
Wisconsin is next on April 5th. Right now the RCP poll average there has Clinton 46.5% to Sanders 44.0%. If that average plays out and assuming a roughly even distribution of support throughout the congressional districts in the state, it would mean about 44 delegates for Clinton to 42 delegates for Sanders.
If that happened, Sanders would then need 67.87% of the remaining delegates to win, completely undoing the gains he made with Washington, Hawaii and Alaska.
Now, Sanders may get a boost of his recent wins and do better than the current poll average indicates. He may even win Wisconsin. The question though is not if he wins, but if he wins it by enough to actually be on a pace to catch up to Clinton before things are over. Right now, that means he needs 58 of the 86 delegates available from the Wisconsin primary.
We shall see.
[Update 2016-04-01 16:10 UTC – Superdelegate scan nets Clinton +3, Sanders +2.5. This does not significantly change the analysis above.]
[Update 2016-04-01 16:55 UTC – I found an update from Michigan which I had logged on March 10th, but had an error in it, so the totals in Michigan in the state detail table were correct, but that update wasn’t included in the national totals. Fixed now. Net change from that: Clinton +2, Sanders -2. This also does not significantly change the analysis above.]
[Update 2016-04-05 16:29 UTC – Superdelegate scan: Clinton +1. Note because Bill Clinton said something about how he would support Sanders at the convention if Sanders won, just like he supported Obama in 2008, some people are saying he should be listed as an Uncommitted superdelegate instead of a Clinton superdelegate. I don’t buy this at the moment and am continuing to list Bill Clinton as supporting Hillary Clinton.]
Note: This post is an update based on the data on ElectionGraphs.com. Election Graphs tracks both a poll based estimate of the Electoral College and a numbers based look at the Delegate Races. All of the charts and graphs seen in this post are from that site. Additional graphs, charts and raw data can be found there. All charts above are clickable to go to the current version of the detail page the chart is from, which may contain more up to date information than the snapshots on this page, which were current as of the time of this post. Follow @ElectionGraphs on Twitter or like Election Graphs on Facebook to see announcements of updates or to join the conversation. For those interested in individual general election poll updates, follow @ElecCollPolls on Twitter for all the polls as they are added.
[Edit 2016-03-28 00:05 UTC – Fixed one place I had Sanders’ name instead of Clinton.]
With Arizona, Idaho and Utah weighing in, Sanders won 74 delegates to Clinton’s 57. That’s a big win for Sanders. But it is only 56.49% of the delegates. To actually improve his overall position, Sanders would have needed 67.06% of the delegates. He didn’t reach that level, so the Sanders path to the nomination gets even harder.
Also including an additional Sanders superdelegate that was added to the totals since the last update, Sanders now needs 67.70% of the remaining delegates to catch up and win. Or, as usual, a huge number of Clinton superdelegates changing their minds could change everything. That seems increasingly unlikely the closer Clinton gets to the nomination of course. But if it happens, you’ll see it here.
[Update 3/26 21:14 UTC – Updates in preparation for new results tonight. Superdelegate changes: Sanders +4. Updates from FL/GA/AZ net: Sanders +4, Clinton -4.]
Note: This post is an update based on the data on ElectionGraphs.com. Election Graphs tracks both a poll based estimate of the Electoral College and a numbers based look at the Delegate Races. All of the charts and graphs seen in this post are from that site. Additional graphs, charts and raw data can be found there. All charts above are clickable to go to the current version of the detail page the chart is from, which may contain more up to date information than the snapshots on this page, which were current as of the time of this post. Follow @ElectionGraphs on Twitter or like Election Graphs on Facebook to see announcements of updates or to join the conversation. For those interested in individual general election poll updates, follow @ElecCollPolls on Twitter for all the polls as they are added.
[Edit 18:14 to fix the date in the title.]
Just a small number of delegates, but we did finally get results from the Democrats Abroad primary that was held earlier in the month:
Sanders 9, Clinton 4.
With this change alone, Sanders did get a high enough percentage of delegates (69.2%) that his “% of remaining delegates needed to win” would have improved. But there were other delegate changes in the six days since the last primary results as well.
The last Democratic post was done while many delegates from Florida and Illinois were still to be determined, because for some reason those states were super slow and it took about two days for everything to be settled. That info was added to that post as an update, but for completeness here, from those final updates, Clinton gained 85 more delegates and Sanders added 43. In addition there were superdelegate updates. Net superdelegate change was Clinton +5, Sanders +0.5. The half delegate is from a Democrats Abroad superdelegate, who only gets a half vote.
With all that, the Democrats Abroad results are actually overwhelmed by the other updates and the new totals are:
Clinton 1644, Sanders 882.5, O’Malley 1
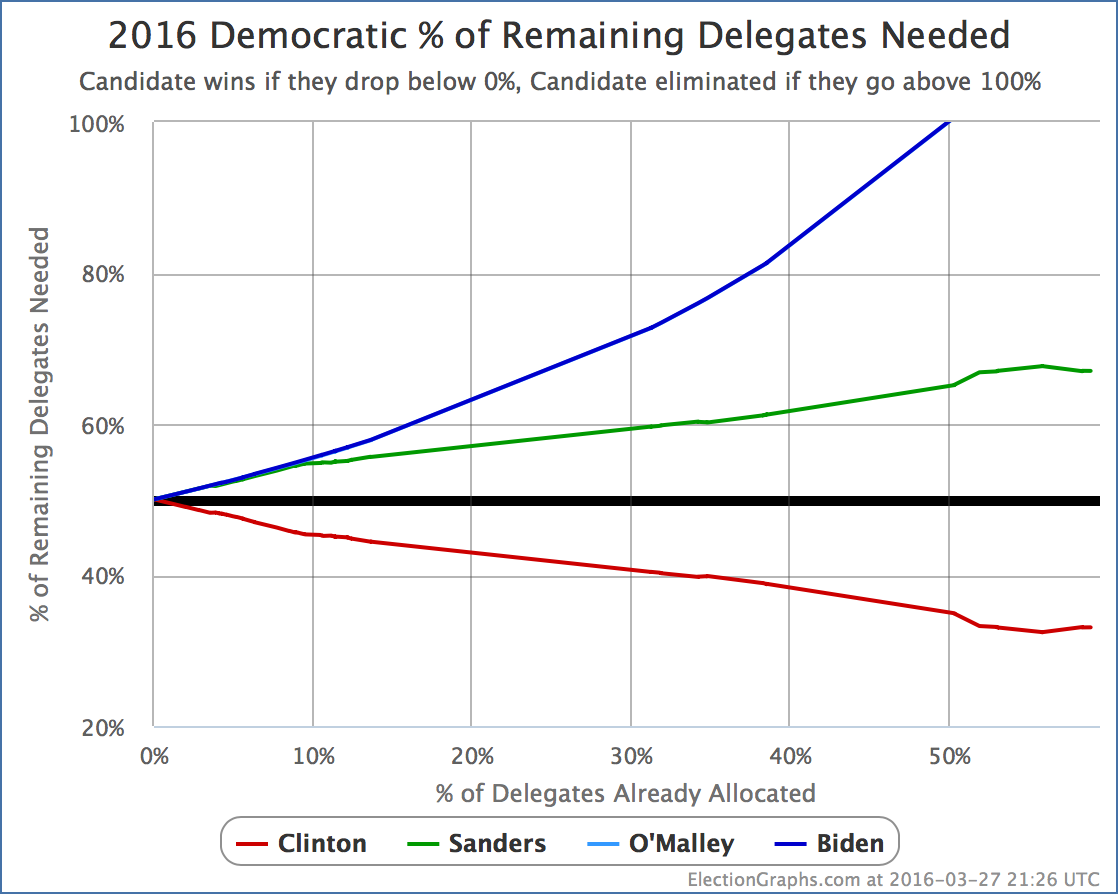
Translating that into the all important “% of remaining delegates needed” graph:
As of now, Clinton needs 33.03% of the remaining delegates to win. Sanders needs 67.06%.
That includes superdelegates of course, and superdelegates can change their minds. If Clinton superdelegates defect to Sanders, Clinton would need more and Sanders would need less. Such defections have been very rare so far however. If they do start to happen, you’ll see it in these charts.
Until then though, this is where we sit. Up next: Arizona, Utah and Idaho.
[Update 2016-03-23 01:34 – Superdelegate scan, Net Sanders +1]
Note: This post is an update based on the data on ElectionGraphs.com. Election Graphs tracks both a poll based estimate of the Electoral College and a numbers based look at the Delegate Races. All of the charts and graphs seen in this post are from that site. Additional graphs, charts and raw data can be found there. All charts above are clickable to go to the current version of the detail page the chart is from, which may contain more up to date information than the snapshots on this page, which were current as of the time of this post. Follow @ElectionGraphs on Twitter or like Election Graphs on Facebook to see announcements of updates or to join the conversation. For those interested in individual general election poll updates, follow @ElecCollPolls on Twitter for all the polls as they are added.
As of when I started writing this post, the results from the March 15th contests on the Democratic side were:
Clinton +312, Sanders +251, TBD 128*
In addition, since the last post other revisions netted: Clinton +3, Sanders +1.
So of the delegates allocated since that last update, Clinton got 55.6%. She only needed 38.90% of the delegates to be on pace to win.
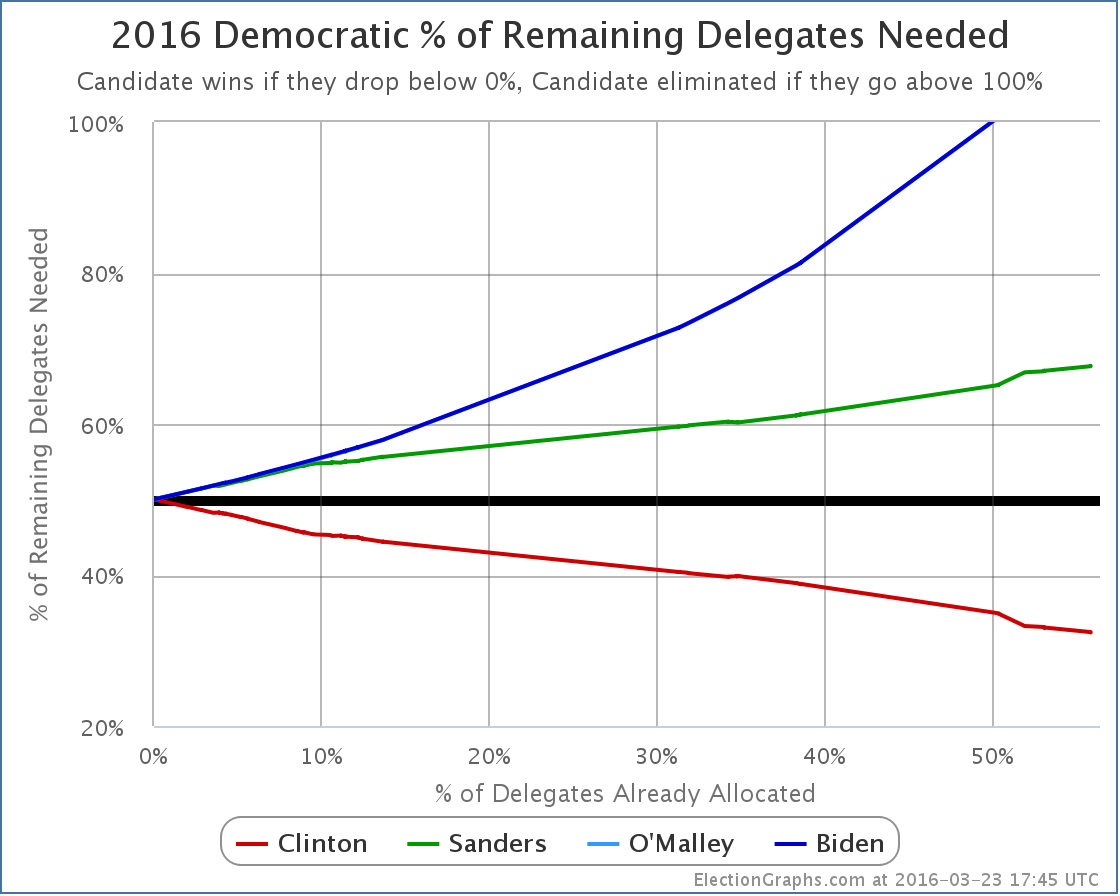
So the updated “% of remaining needed to win” graph looks like this…
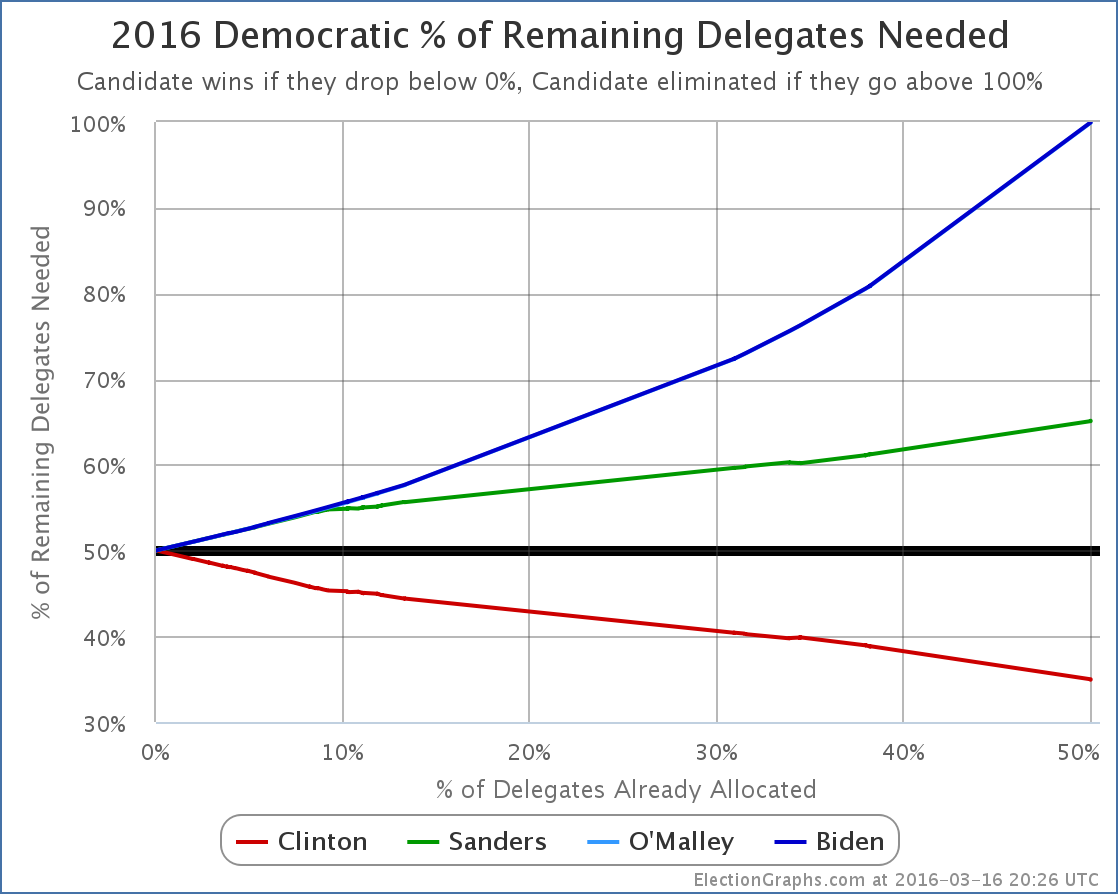
Clinton only needs 34.94% of the remaining delegates to win.
Of course, if massive numbers of superdelegates start changing their minds, that number would get higher. Enough superdelegates flipping could in fact still put Sanders in the lead!
But superdelegates haven’t been changing their minds in significant numbers yet.
And so Clinton’s delegate accumulation continues.
* I waited awhile before writing this post because the final disposition of 64 delegates each from Florida and Illinois is still undetermined as per my source (Green Papers). But at some point I had to go ahead with what I had. Those delegates are likely to split along the same lines as the other delegates from those states though, and they are unlikely to change the overall picture. If there are additional updates for those delegates before the results from Arizona, Idaho and Utah come in, I will add updates to the post with those results.
[Update 2016-03-17 00:30 UTC – And here is the first of those updates. With updates to both Florida and Illinois, Clinton added 64 more delegates, and Sanders added 11. All 64 TBD delegates from Florida are now accounted for. There are still 53 delegates TBD in Illinois. Clinton now only needs 33.30% of the remaining delegates, while Sanders needs 66.78%. In addition, with this update O’Malley is officially mathematically eliminated.]
[Update 2016-03-18 05:20 UTC – Update today for both Illinois and Ohio. Net result Clinton gained another 21 delegates, Sanders gained 32. There are no more TBD delegates remaining. Clinton now needs 33.16% of the remaining delegates while Sanders needs 66.93%.]
[Update 2016-03-18 05:41 UTC – Superdelegate scan, Net: Clinton -1]
[Update 2016-03-20 16:12 UTC – Superdelegate scan, Net: Clinton +1]
[Update 2016-03-22 11:27 UTC – Superdelegate scan: Net: Clinton +5, Sanders +0.5 (Democrats Abroad superdelegates get half a vote)]
Note: This post is an update based on the data on ElectionGraphs.com. Election Graphs tracks both a poll based estimate of the Electoral College and a numbers based look at the Delegate Races. All of the charts and graphs seen in this post are from that site. Additional graphs, charts and raw data can be found there. All charts above are clickable to go to the current version of the detail page the chart is from, which may contain more up to date information than the snapshots on this page, which were current as of the time of this post. Follow @ElectionGraphs on Twitter or like Election Graphs on Facebook to see announcements of updates or to join the conversation. For those interested in individual general election poll updates, follow @ElecCollPolls on Twitter for all the polls as they are added.
[Update 2016-03-17 15:45 UTC to correct slight error in the second decimal place of the “needs” numbers for Clinton and Sanders in the 2016-03-17 00:30 UTC update note.]
On Saturday we got results from the Northern Mariana Islands. A whopping 6 delegates were at stake, so this almost wasn’t worth its own post, but here goes. Then we’ll follow it up with a quick comparison with 2008 and 2012.
Clinton won 4 delegates. Sanders won 2.
Since the post on the Michigan results between Michigan finalizing results and superdelegate preferences we have an additional net change of Clinton +2, Sanders -1.
So since the Michigan post, a total of Clinton +6, Sanders +1. So 85.71% of delegates to Clinton, way more than the 38.96% she needed to be on the glide path to the nomination.
Clinton now needs 38.90% of the remaining delegates to win. Or more if a large number of superdelegates start to defect. But that hasn’t happened yet.
Yawn.
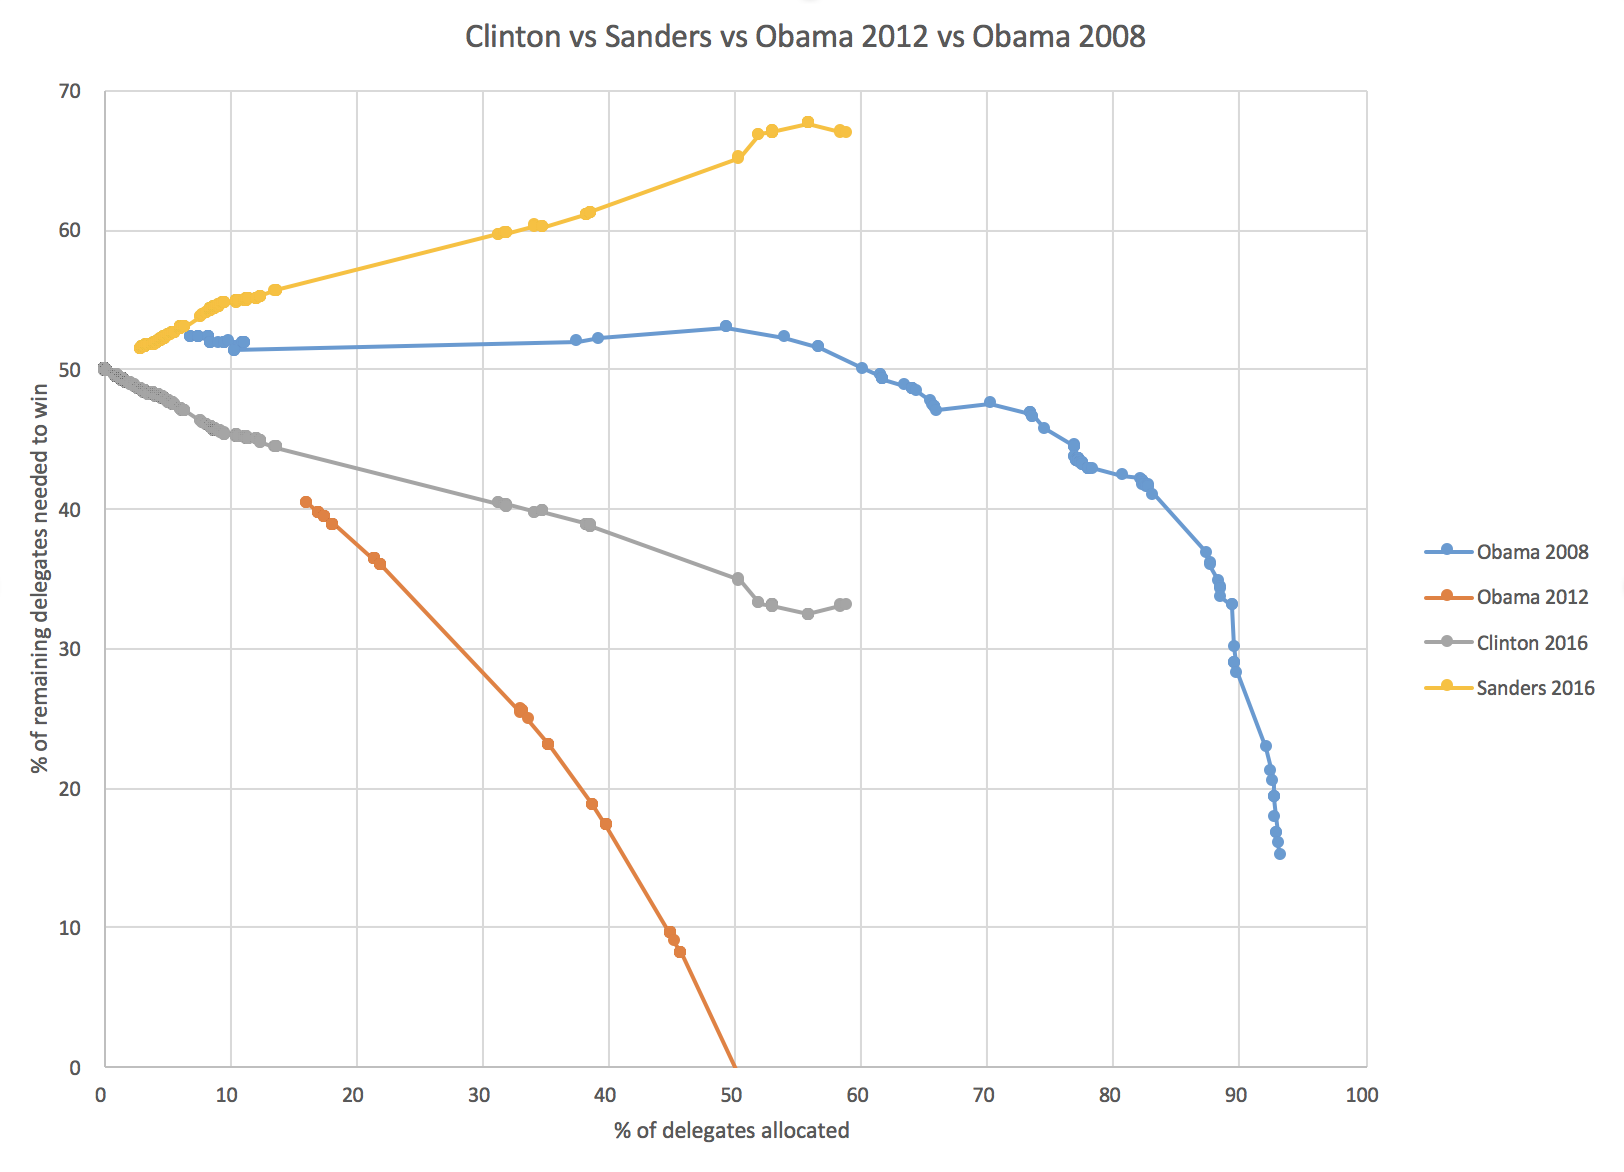
OK, since not much happening there, just a quick comparison of where Clinton and Sanders’ “% of remaining needed to win” is compared to Obama’s at similar points in 2008 and 2012. (For clarity, I’ve eliminated some oddness in the chart at the very end of the 2008 line when delegates were restored to states that had been stripped of them for rules violations and such.)
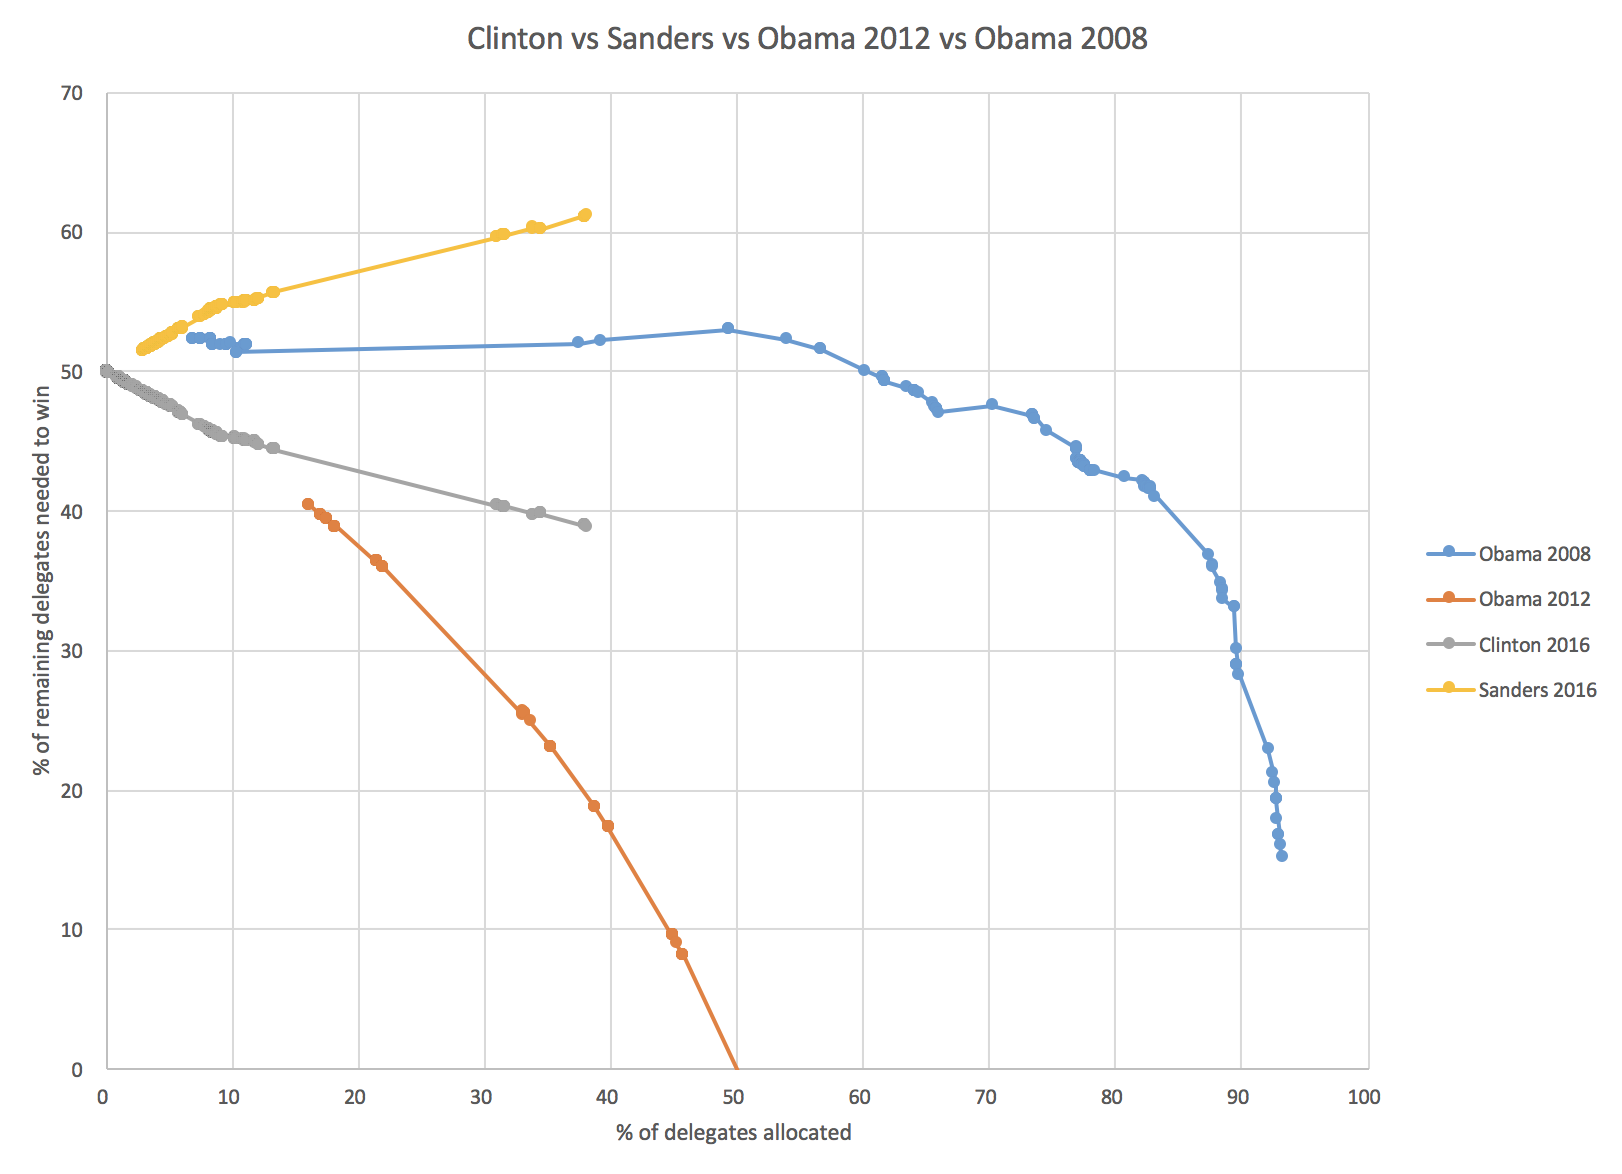
The blue line is Obama in 2008. At this point he was still behind! He needed about 52% of the remaining delegates to win. He managed that of course, and ended up winning. Because of the competition from Clinton, Obama did not clinch the nomination until about 96% of the delegates had been determined.
The orange line was Obama in 2012 when he was unopposed. Aside from a few random protest delegates here and there he essentially collected 100% of delegates as soon as they became available, and clinched at the 50% mark.
Clinton 2016 so far is neatly splitting the difference. She is far far ahead of where Obama was in 2008, but of course not doing as well as she would if she was unopposed.
And then Sanders 2016. Notice that while Obama was behind at this stage, he was basically holding steady. He was not getting further and further behind with each new primary or caucus. Then right around when he hit the 50% mark, he started winning decisively, and caught up and won. Sanders is not holding the line. He is not keeping up. He keeps falling further and further behind the pace he would need to catch up and win. This is not what a come from behind victory looks like. This is what a stay behind loss looks like.
Of course if Sanders started winning every contest from here on out by large margins, then Clinton superdelegates might start abandoning her in droves and this graph COULD still change rapidly. If and when that happens, we’ll see it. But it hasn’t happened yet, and the longer this goes on, the less likely that becomes. It would require a DRAMATIC change in the the race. As I’ve said before, we’re talking something on the order of a new Clinton scandal that even Clinton die-hards think is disqualifying, or a major Clinton health issue, not just Sanders doing well and winning a few states.
[Update 2016-03-15 05:07 UTC – Revision to Kansas delegate results, plus superdelegate changes. Net: Clinton +4, Sanders +1]
[Update 2016-03-16 00:31 UTC – Superdelegate changes. Net: Clinton -1]
Note: This post is an update based on the data on ElectionGraphs.com. Election Graphs tracks both a poll based estimate of the Electoral College and a numbers based look at the Delegate Races. All of the charts and graphs seen in this post are from that site. Additional graphs, charts and raw data can be found there. All charts above are clickable to go to the current version of the detail page the chart is from, which may contain more up to date information than the snapshots on this page, which were current as of the time of this post. Follow @ElectionGraphs on Twitter or like Election Graphs on Facebook to see announcements of updates or to join the conversation. For those interested in individual general election poll updates, follow @ElecCollPolls on Twitter for all the polls as they are added.
You may have heard all the breathless coverage last night of Sanders’ surprise win in Michigan. And it was indeed a surprise. He outperformed all the recent polls by a substantial margin. This was a big huge win, right?
Well, no. It wasn’t. The media hype is all around the fact that it is more interesting to cover an actual race than a slow march to an almost inevitable win. Time to look at the numbers.
First of all, the straight up delegates out of Michigan: Sanders 69, Clinton 61
That means Sanders got 53.1% of the Michigan delegates. To be on a pace to catch up and win, he needed 60.2% of the delegates. He may have “won”, but he didn’t win by anywhere near enough to actually catch up with Clinton.
But Michigan wasn’t the only state handing out delegates. Mississippi did too. And Mississippi went for Clinton 32 to 4. So the total for the day was actually Clinton 93 to Sanders 73.
There were also some superdelegate updates since my last post. Net change: Clinton +4, Sanders +3.
So total since the Maine results on Sunday: Clinton 97, Sanders 76.
So Sanders only got 43.9% of the delegates since Sunday. This is not close to 60.2%.
Yes, Sanders pulled out a surprise win in Michigan. But he could duplicate that win in EVERY STATE from here until the end of the primary season and he STILL would not catch up. He would not win. He can’t catch up by “just winning”. He needs to win by huge margins to catch up. That did happen (barely) in Maine. But Michigan didn’t do it, and Sanders has only very rarely managed the margins he would need to catch up.
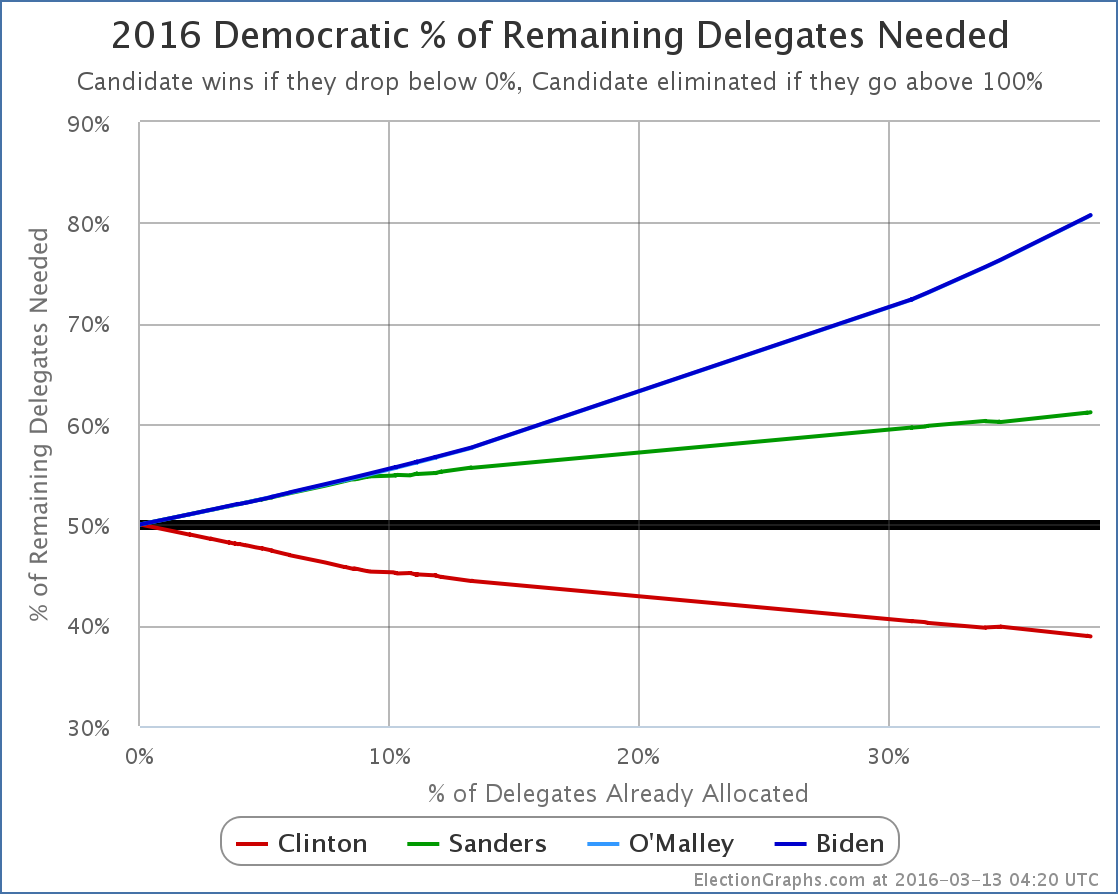
So, looking at the graph of “% of remaining needed to win”:

Clinton now needs 38.96% of the remaining delegates to win. Sanders needs 61.14% of the remaining delegates to catch up.
Oh, unless the superdelegates start changing their minds in massive numbers. That would make things harder for Clinton and easier for Sanders. And to be fair, if all 460 of Clinton’s superdelegates flipped to Sanders tomorrow, Sanders would indeed be ahead by 1035 delegates to 771.
I wouldn’t hold my breath on that one though.
Right now the totals are Clinton 1231, Sanders 575.
Next up are the Northern Marianas on Saturday, then Florida, Illinois, Missouri, North Carolina and Ohio next Tuesday.
[Edit 16:22 UTC to add the following exchange]
Minutes after I posted this update, I got a comment via Facebook that prompted me to do some additional analysis. It seemed directly relevant and interesting, so adding it here (lightly edited):
Jenn: Since superdelegates have never actually gone against the popular vote and could change their minds, what’s the math if we simply exclude them? I’m not saying it’ll happen. I’m just curious and too lazy to do it myself.
Sam: On superdelegates, my position is that if they ever start to change their minds because of the results of the pledged delegate race, we will see that because they will say so. So speculating about them changing their minds is pointless, you can actually watch and see if they do. If they start changing their minds, then it is a real thing and it will be measured and tracked as it happens. So long as they don’t, it is just a fantasy. But OK, I’ll quickly do the calculation of what things would look like if you only look at pledged delegates and assume superdelegates will follow the pledged delegate result.
[Edit 2016-03-10 16:07 UTC to strike through the calculation below due to really bad stupid math error that completely invalidates the result. Sanders needed percentage will be closer to 55%. Redoing calculations shortly.]
Sam: OK. Here goes. The current totals are Clinton 1231, Sanders 575, O’Malley 1. If you take out supers, that becomes Clinton 771, Sanders 552. Now, there are 2472 delegates total, so you need 1237 delegates to win. But that includes superdelegates. If the assumption is that supers will go for the pledged delegate winner, then you shouldn’t count them in the total number of delegates either because they now don’t matter. Without supers there are 1755 delegates, and you need 878 to win. Sanders therefore needs 326 more delegates to catch up and win. Between Clinton and Sanders they have collected 1323 delegates already. So there are only 432 pledged delegates remaining. 326/432 = 75.5%. So if you look only at pledged delegates it is actually WORSE for Sanders. He needs nearly 76% of the remaining delegates to catch up and win rather than “only” 61%.
[Edit 2016-03-10 17:30 to add additional conversation correcting the erroneous calculation. I am leaving the first version struck out above for the record. The below is lightly edited from the original Facebook conversation.]
Sam: Urg!!!! I made a huge error on those calculations! I blame it on…. Uh…. Being stupid. I used the total number of Republican delegates in one part of the calculation rather than the Democratic totals, which of course invalidates the whole thing. I suspect Sanders actually needs closer to 55% if you don’t count supers. I will redo the calculation.
Sam: OK, here goes again. I suck. Numbers that have changed bolded. The current totals are Clinton 1231, Sanders 575, O’Malley 1. If you take out supers, that becomes Clinton 771, Sanders 552. Now, there are 4765 delegates total, so you need 2383 delegates to win. But that includes superdelegates. If the assumption is that supers will go for the pledged delegate winner, then you shouldn’t count them in the total number of delegates either. Without supers there are 4048 delegates, and you need 2025 to win. Sanders therefore needs 1450 more delegates to catch up and win. Between Clinton and Sanders they have collected 1323 delegates already. So there are only 2725 pledged delegates remaining. 1450/2725 = 53.2%. This is significantly better than the 41.7% of pledged delegates Sanders has gotten so far, but it is not yet in the impossible zone by a long shot, and it is still better than where he is when you include superdelegates. Apologies for the stupid error.
Sam: I had actually checked and rechecked the calculation several times before posting it originally, but I made the same mistake every time. Sigh! Oh well!
Sam: See also this article by Andrew Prokop for more on what would be involved in a Sanders comeback. It was while reading this that I realized my error.
[Update 2016-03-10 06:45 UTC – Update in Michigan shifts 2 additional delegates from Sanders to Clinton. This does not substantially change the analysis above. In addition, the number of total “unpledged PLEOs” was adjusted in several states, giving a net addition of 1 total convention delegate.]
[Update 2016-03-11 05:29 UTC – Superdelegate update: Clinton loses one as a second superdelegate says they will just vote for the pledged delegate winner, putting them back in the uncommitted category for now.]
[Update 2016-03-12 23:50 UTC – Superdelegate update to prepare for March 12th results: Clinton +1, Sanders +1]
Note: This post is an update based on the data on ElectionGraphs.com. Election Graphs tracks both a poll based estimate of the Electoral College and a numbers based look at the Delegate Races. All of the charts and graphs seen in this post are from that site. Additional graphs, charts and raw data can be found there. All charts above are clickable to go to the current version of the detail page the chart is from, which may contain more up to date information than the snapshots on this page, which were current as of the time of this post. Follow @ElectionGraphs on Twitter or like Election Graphs on Facebook to see announcements of updates or to join the conversation. For those interested in individual general election poll updates, follow @ElecCollPolls on Twitter for all the polls as they are added.
[Edit 15:59 to fix one place I said Sanders instead of Clinton. Fixed. Thanks Jenn for pointing it out.]
[Edit 2016-03-10 21:12 UTC to fix author of Vox article I linked to.]
Sanders won Maine 16 delegates to 9 for Clinton.
In addition, further updates to Louisiana since yesterday gave Sanders 2 more delegates and Clinton 2 less.
So effectively, as 25 new delegates were added, Sanders increased his total by 18. So 72%. Way more than the 60.26% I said he needed to be on track to catch up and win. So how does that look on the big chart?
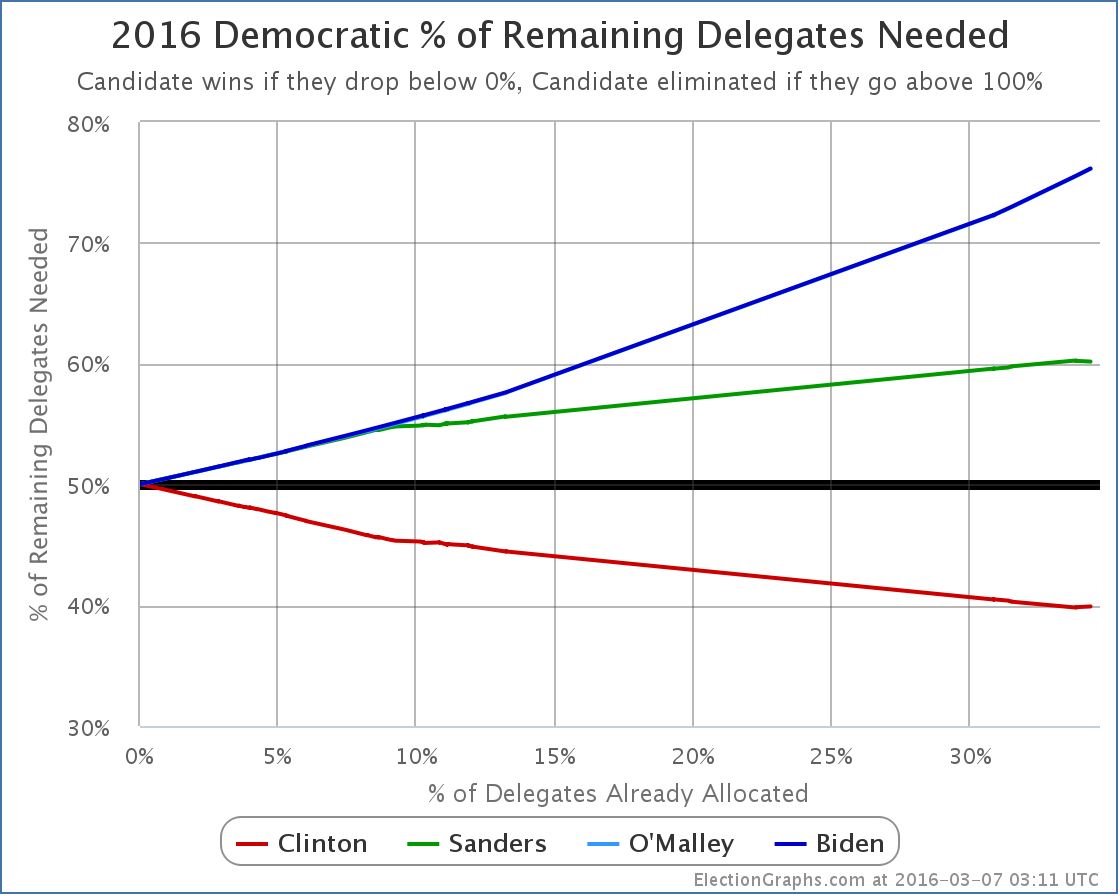
Yeah, see that little tiny change in direction at the ends of the green and red lines? That’s it.
Sanders did indeed improve his position in the race by winning Maine by a nice large margin. Yesterday he needed 60.26% of the remaining delegates to win. Today he needs… 60.17% of the remaining delegates.
Clinton of course also had a little setback. Instead of needing 39.80% of the remaining delegates, she now needs 39.90%.
Yeah, not much of a change, is it.
After the slight speed bump in Maine, Clinton’s march to the nomination continues…
Update 2016-03-09 03:19 UTC – Full superdelegate scan in preparation for adding new delegate results. Net Clinton +4, Sanders +3. Also 1 additional delegate added to the total number of delegates. This of course does not change the analysis above significantly.
Note: This post is an update based on the data on ElectionGraphs.com. Election Graphs tracks both a poll based estimate of the Electoral College and a numbers based look at the Delegate Races. All of the charts and graphs seen in this post are from that site. Additional graphs, charts and raw data can be found there. All charts above are clickable to go to the current version of the detail page the chart is from, which may contain more up to date information than the snapshots on this page, which were current as of the time of this post. Follow @ElectionGraphs on Twitter or like Election Graphs on Facebook to see announcements of updates or to join the conversation. For those interested in individual general election poll updates, follow @ElecCollPolls on Twitter for all the polls as they are added.
Absent something really surprising happening… which you never know… could happen… the posts on the Democratic side at this point are essentially just going to be documenting Clinton’s slow but sure march to the Democratic nomination.
On March 5th if you go by states, you would see Sanders winning Kansas and Nebraska, while Clinton only won Louisiana.
Of course, states don’t matter. Delegates do. For the night, Clinton got 59 delegates and Sanders got 50.
In addition, since the post about Super Tuesday there were adjustments for finalized Super Tuesday results and new superdelegate counts. The net result was that Clinton gained an additional 22 delegates while Sanders added 13.
So total since then… Clinton +81, Sanders +63.
At the time of that last post, Clinton needed 40.52% of the remaining delegates to be on track to win. Sanders needed 59.54%.
Actual percentages since then? Clinton 56.25%, Sanders 43.75%. Clearly Clinton easily exceeded her targets, while Sanders… did not.
Actual delegate counts right now: Clinton 1127, Sanders 482, O’Malley 1.
You need 2382 delegates to win. 1610 have already been counted. There are 3153 left to be determined.
Where does that put things now?
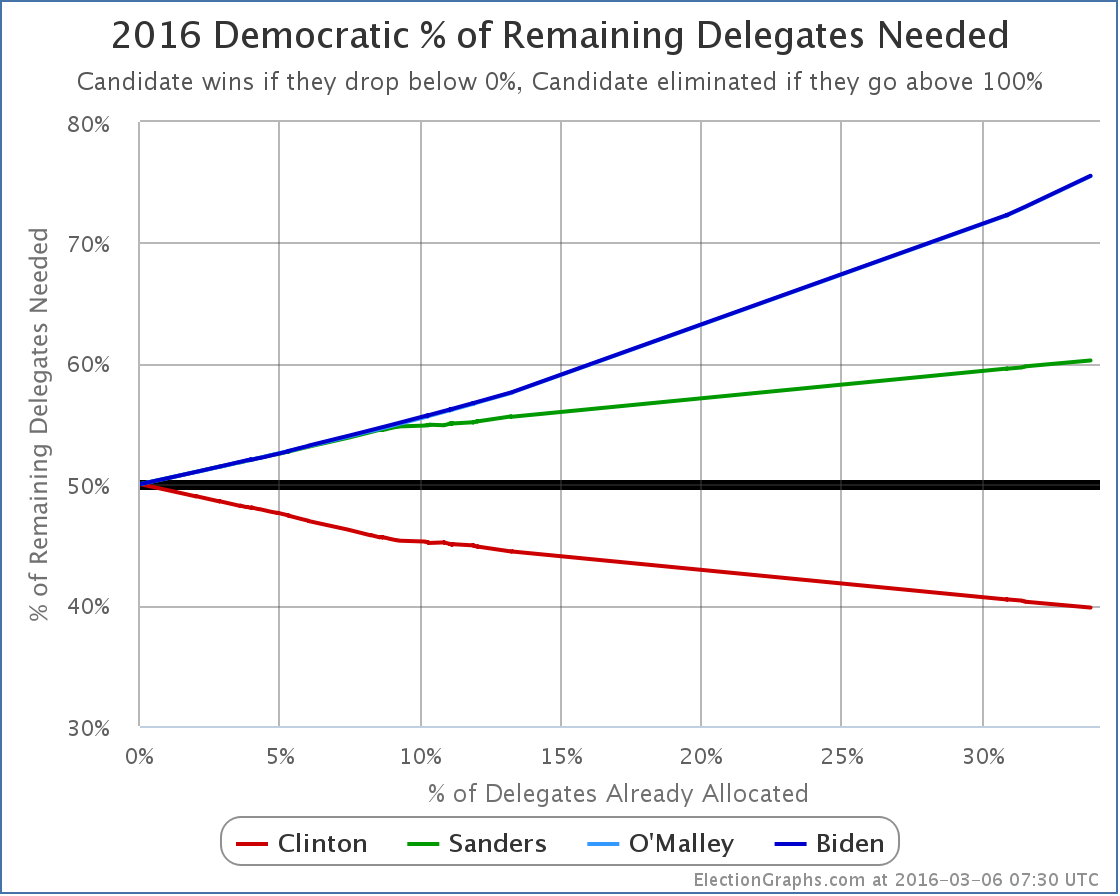
Clinton now needs only 39.80% of the remaining delegates to win.
To catch up and win, Sanders would need 60.26% of the remaining delegates.
Next up is Maine. I haven’t found any polling on Maine. It seems like it might be a good state for Sanders. But is it 60.26% good? In delegate terms that would be 16 of the 25 pledged delegates. Guess we’ll find out.
[Update 15:56 UTC: Overnight updates gave Sanders 1 additional delegate in Louisiana and Clinton 1 less. So if I’d waited until morning to post this the title would have said Clinton won 58 to 51 rather than 59 to 50. But the substance of the post remains the same.]
[Update 2016-03-07 03:07 UTC: Another update gives Sanders yet another delegate in Louisiana and Clinton yet another less. So Louisiana now Clinton 37 to Sanders 14, and March 5th contests overall Clinton 57 to Sanders 52.]
Note: This post is an update based on the data on ElectionGraphs.com. Election Graphs tracks both a poll based estimate of the Electoral College and a numbers based look at the Delegate Races. All of the charts and graphs seen in this post are from that site. Additional graphs, charts and raw data can be found there. All charts above are clickable to go to the current version of the detail page the chart is from, which may contain more up to date information than the snapshots on this page, which were current as of the time of this post. Follow @ElectionGraphs on Twitter or like Election Graphs on Facebook to see announcements of updates or to join the conversation. For those interested in individual general election poll updates, follow @ElecCollPolls on Twitter for all the polls as they are added.
Update 08:40 to add actual delegate counts, how many are left, etc.
|
|