This is the website of Abulsme Noibatno Itramne (also known as Sam Minter).
Posts here are rare these days. For current stuff, follow me on Mastodon
|
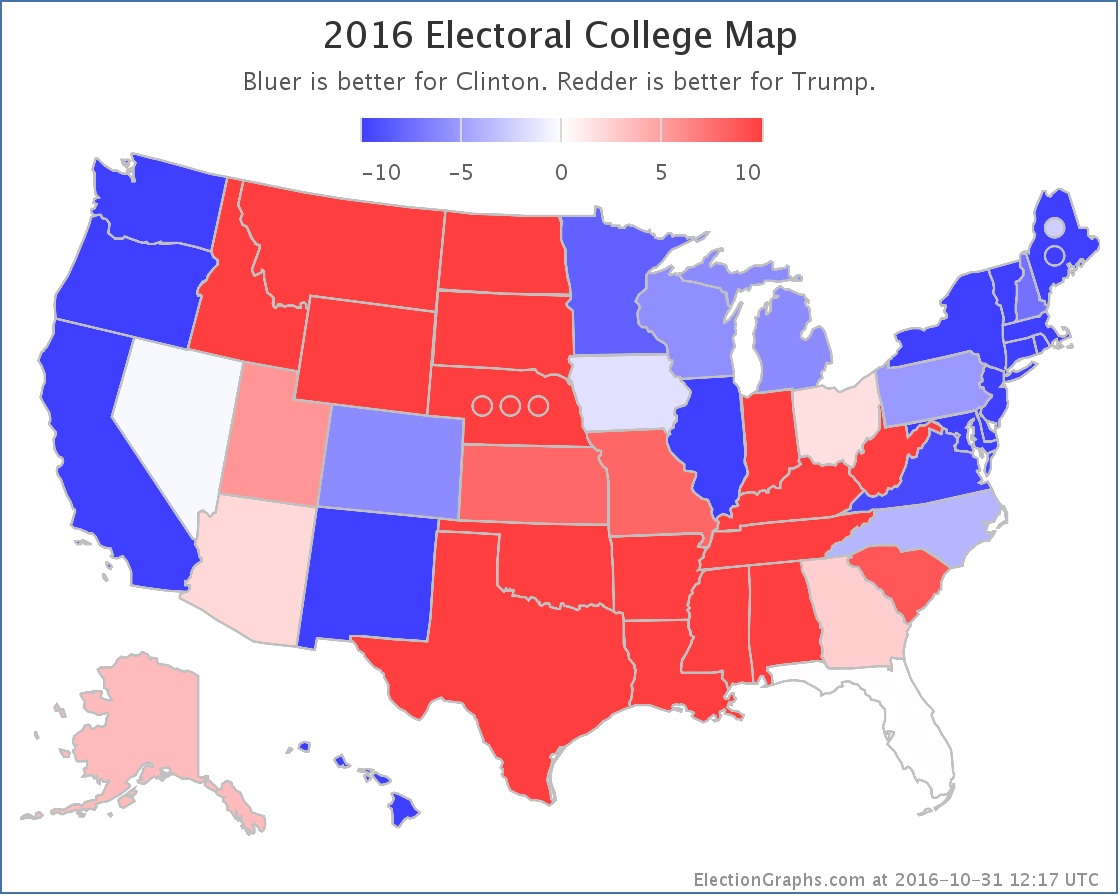
States with new poll data added since the last update: All 50 states, DC, and the Maine congressional districts.
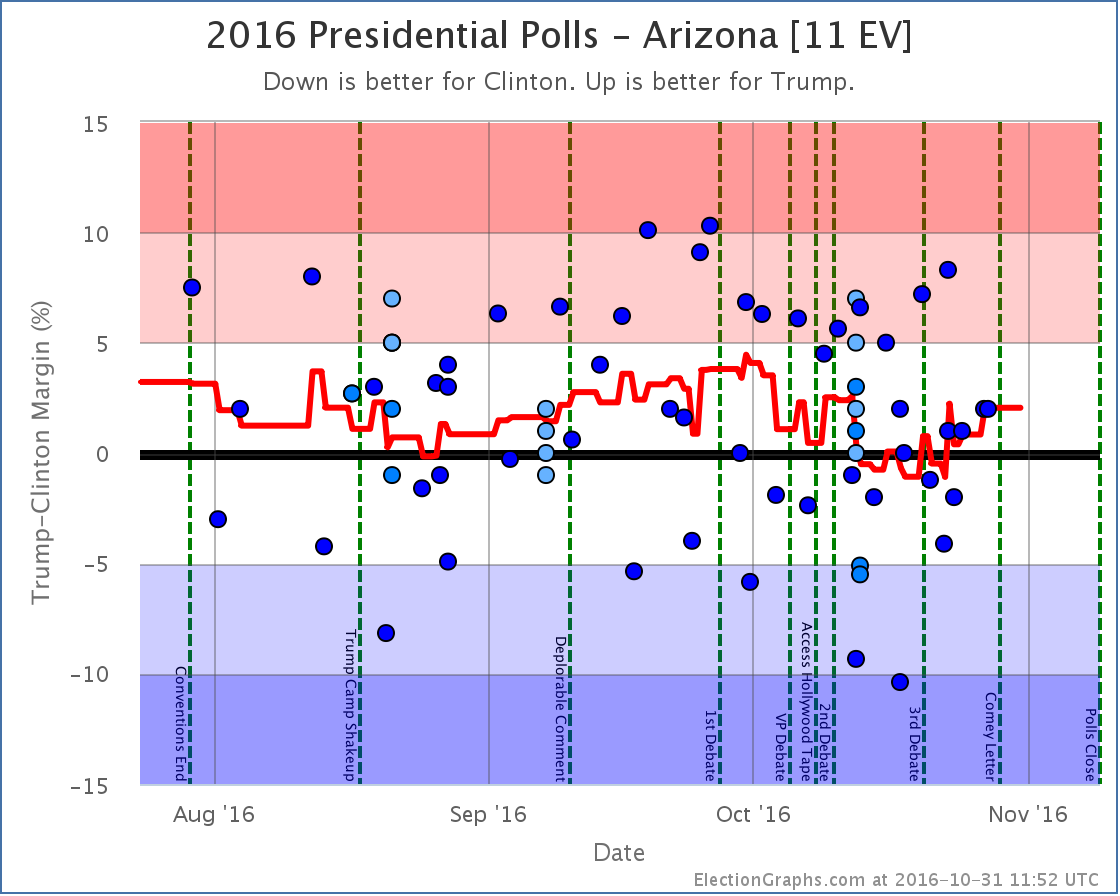
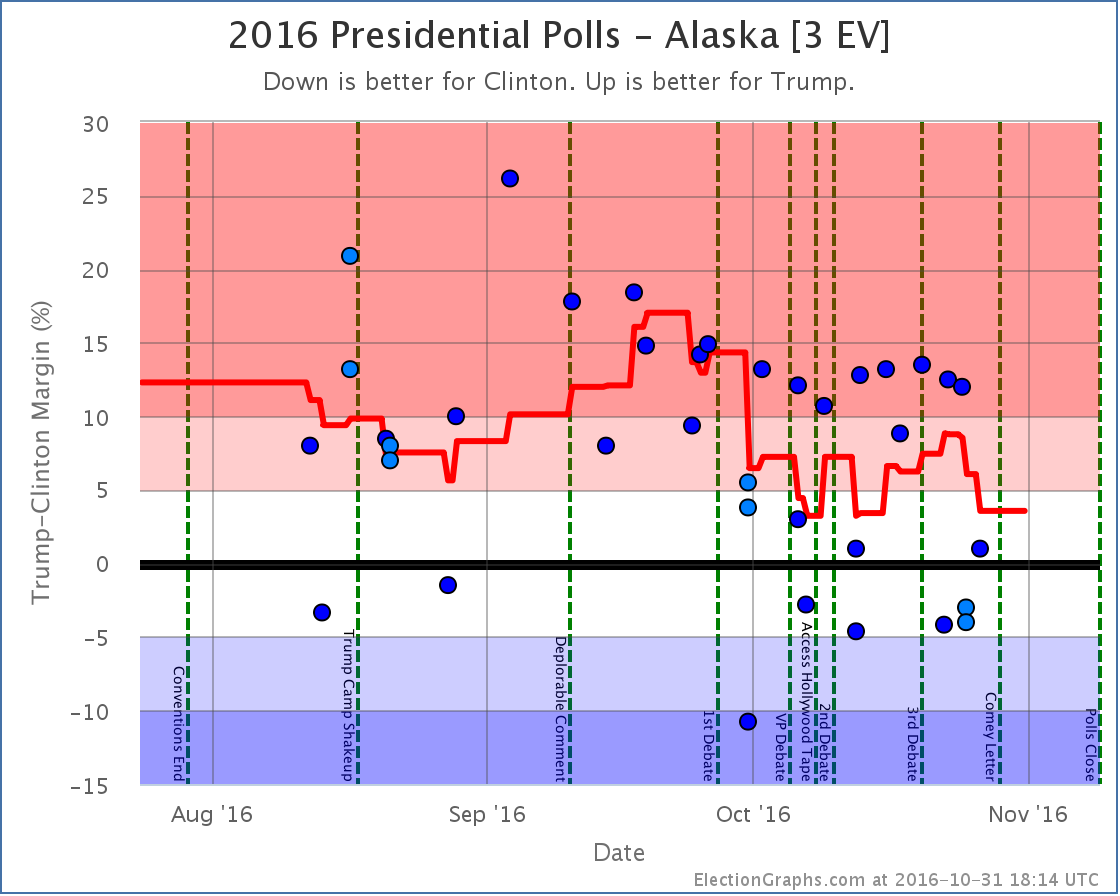
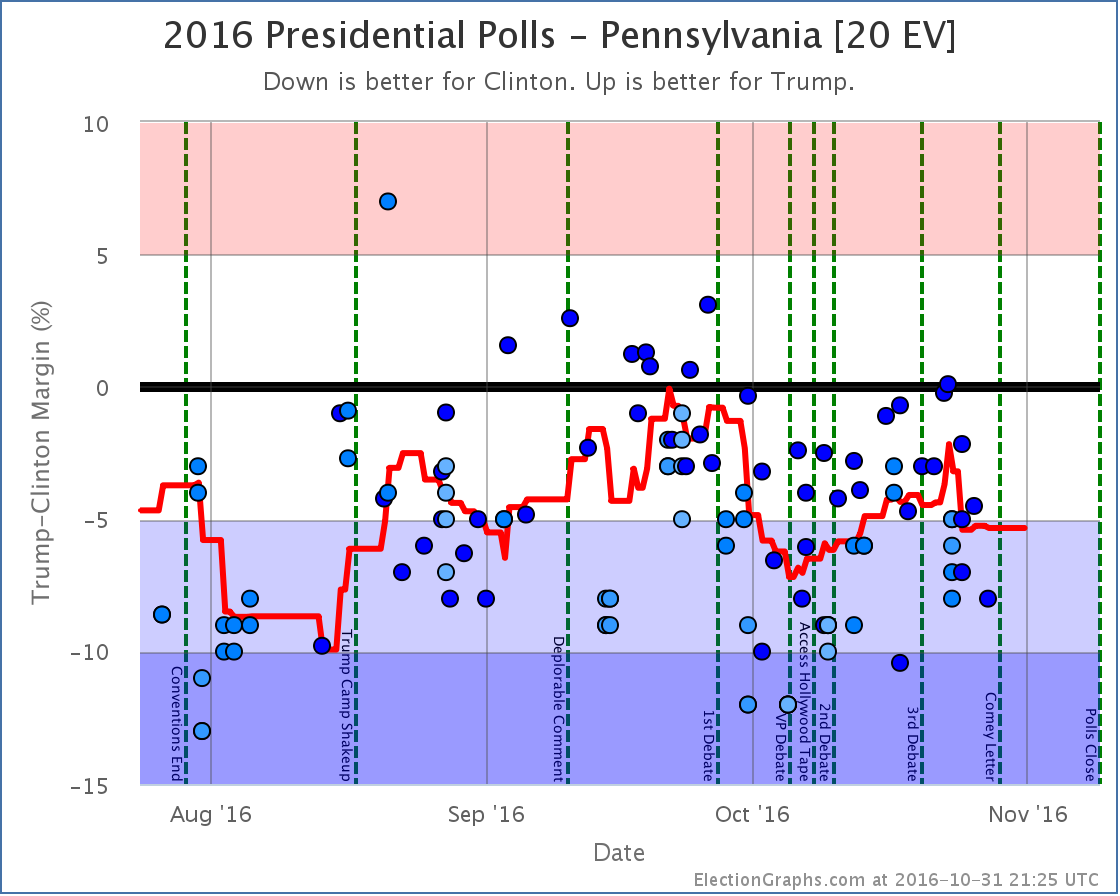
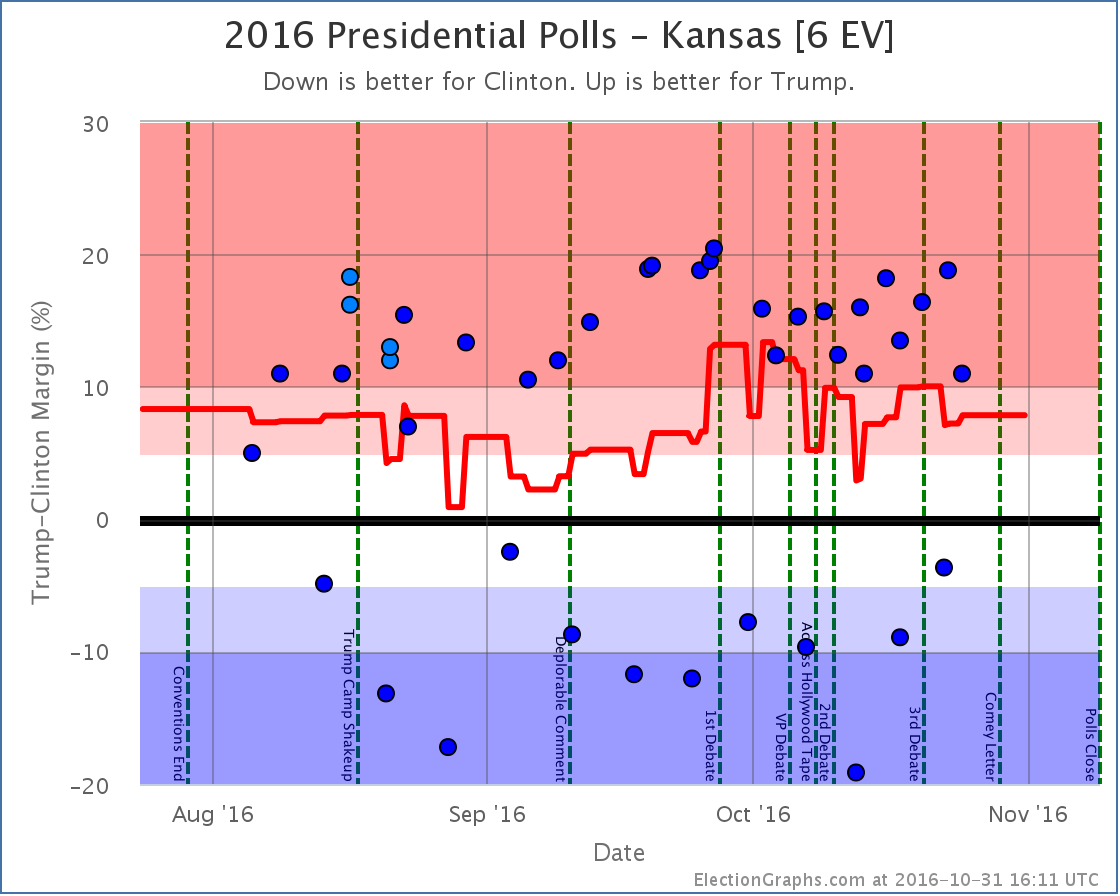
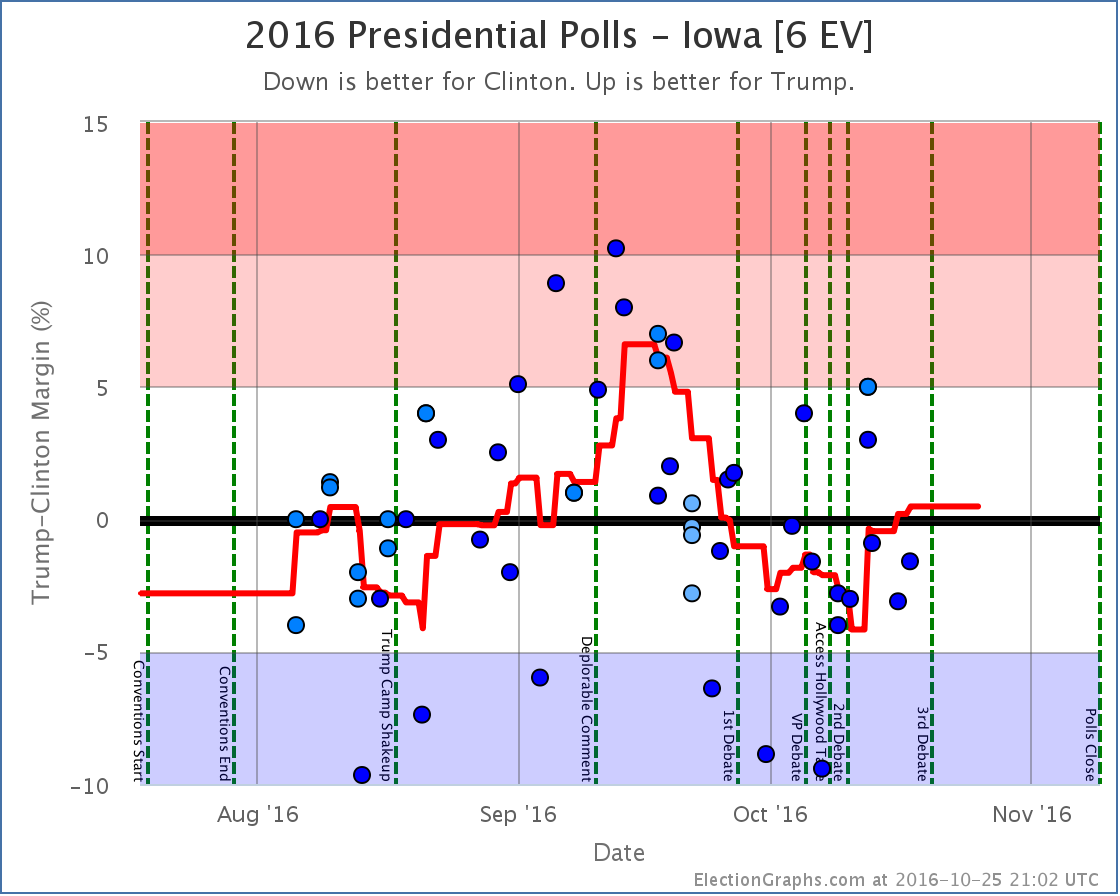
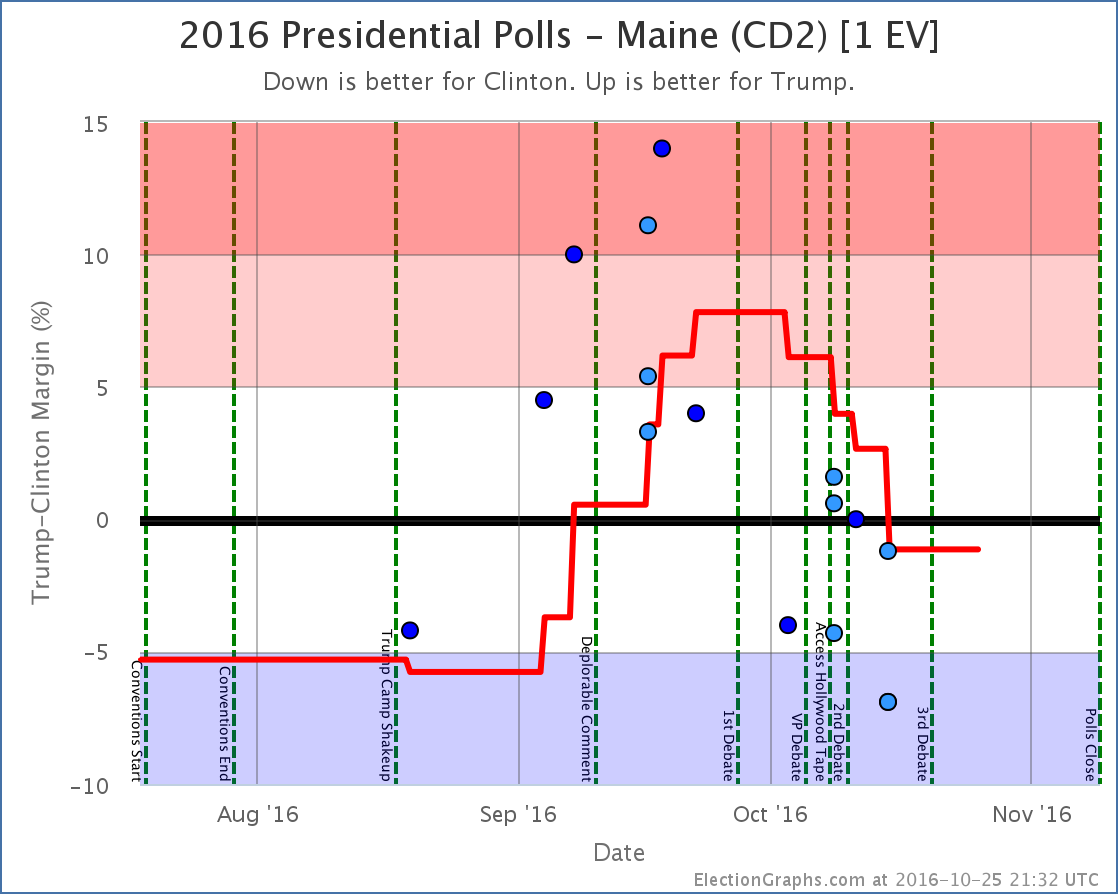
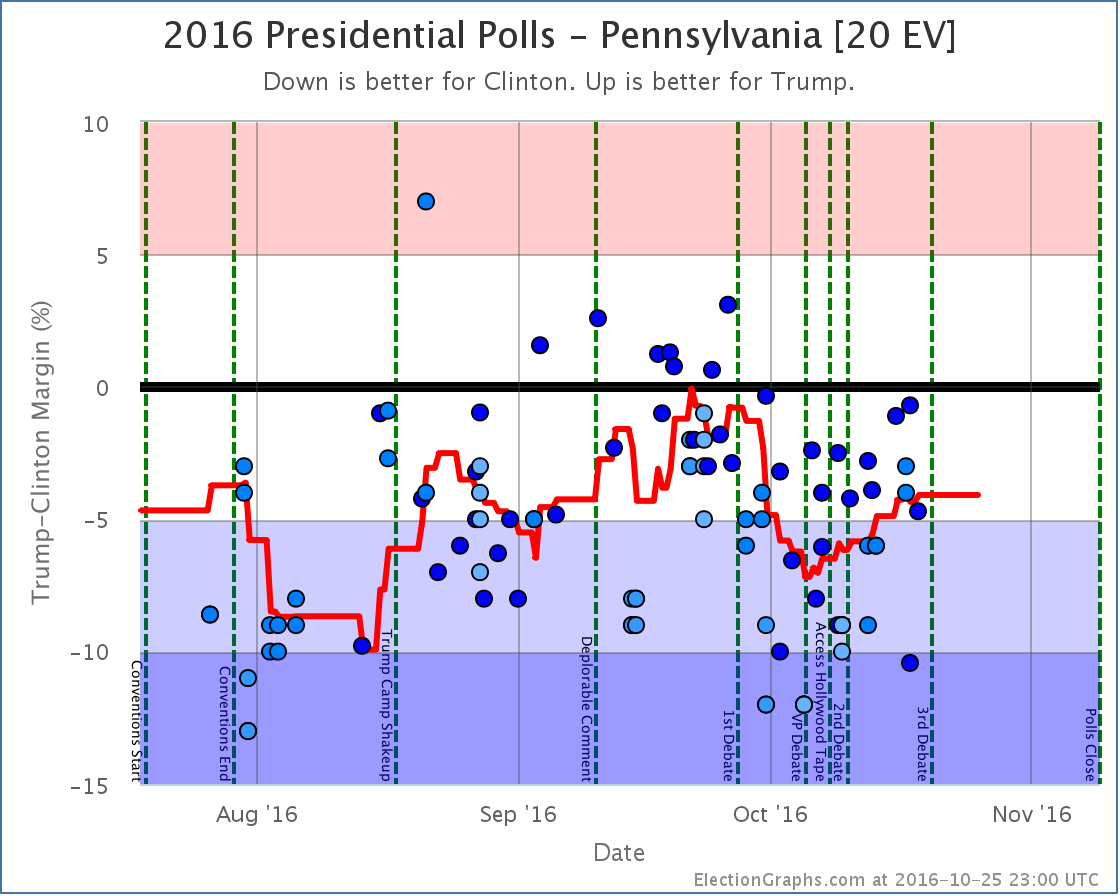
Notable changes in: Florida (29), Pennsylvania (20), Arizona (11), Iowa (6), Kansas (6), Utah (6), Alaska (3), and the tipping point.
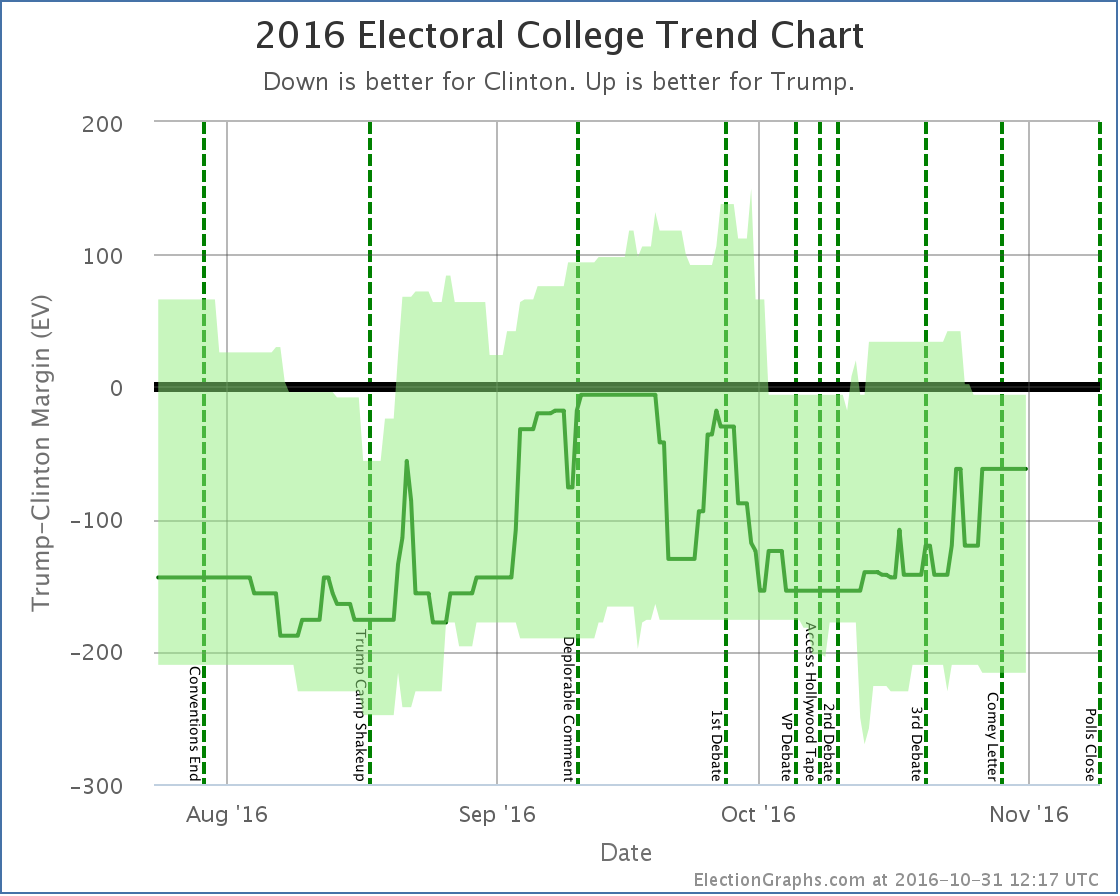
National Summary
It has been about five days since the last update. Since then the movement has been decidedly mixed.
Note that as of this update, no polls have been included that contain interviews done after the release of the “Comey Letter”.
Good for Trump:
- The expected result has moved from a 130 EV Clinton win to only a 62 EV Clinton win
- Clinton’s best case has declined from a 234 EV win to only a 216 EV win
Good for Clinton:
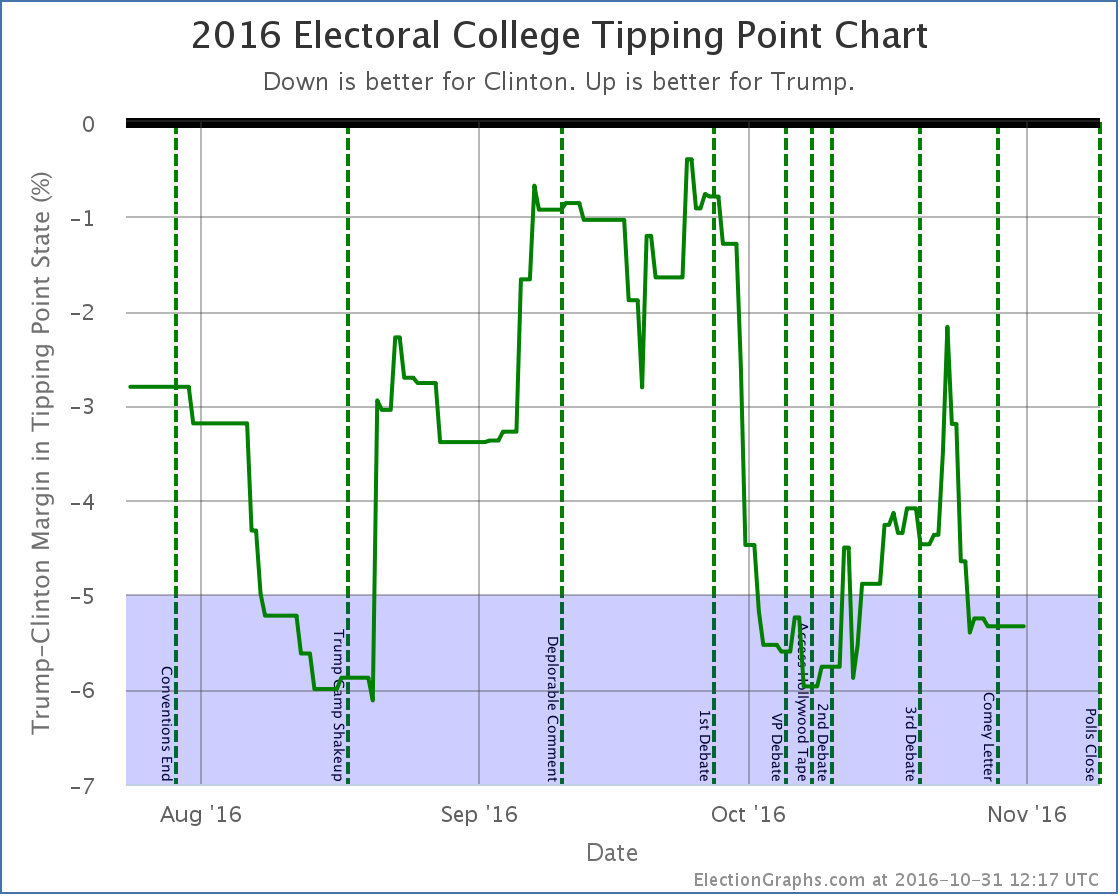
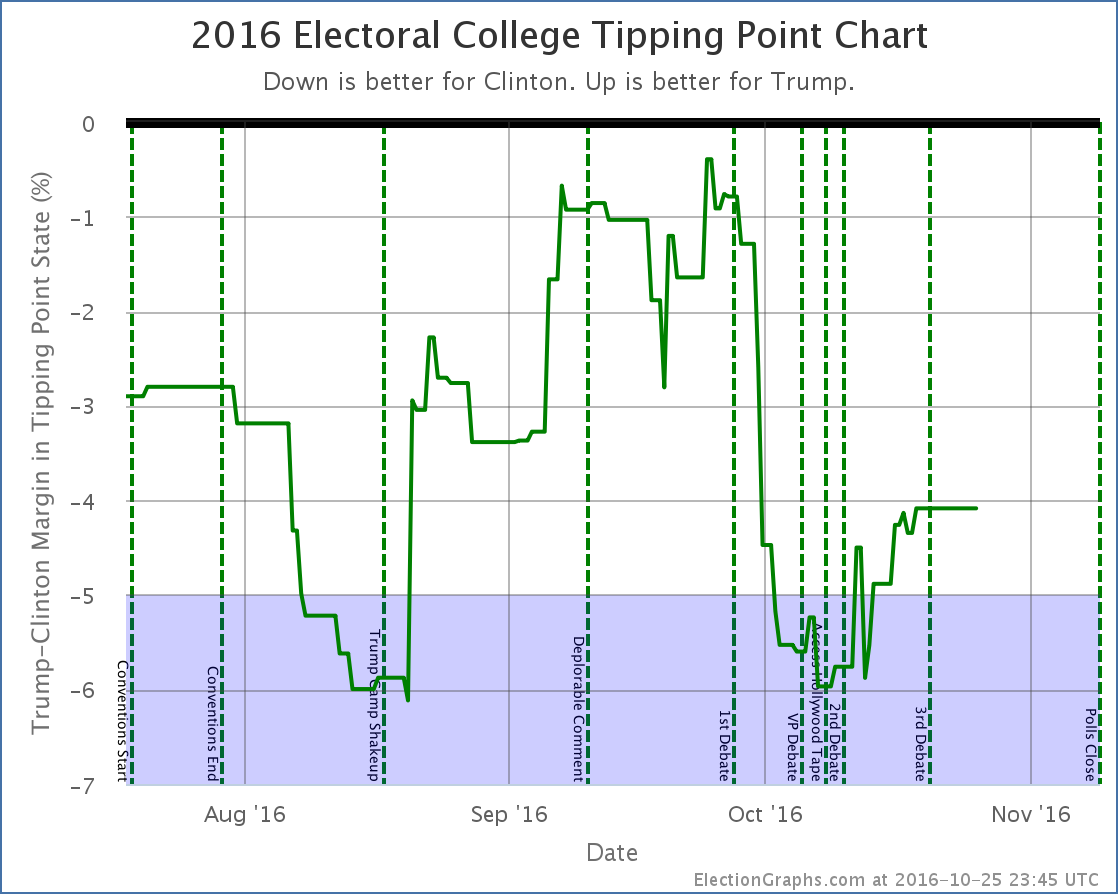
- The tipping point moves from Clinton by 4.1% in PA to Clinton by 5.3% in PA
- Trump’s best case declines from a 34 EV win to a 6 EV loss
Charts
Discussion
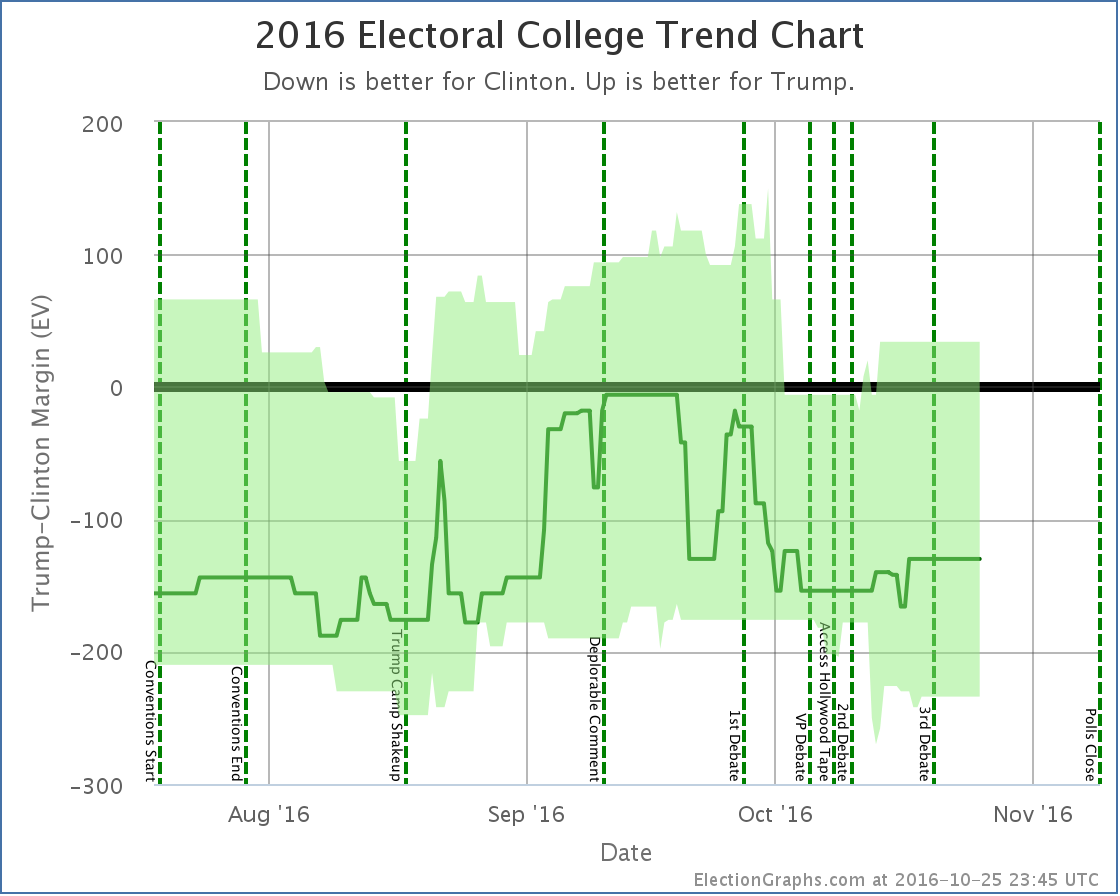
While some metrics have moved in Trump’s direction and others in Clinton’s, in the end this picture is bad news for Trump. Why is that? Fundamentally, doesn’t the fact that the “expected case” moved toward Trump mean that he is doing better?
Well, it means the margin he will lose by is getting smaller, yes. However, if you are trying to look for scenarios where Trump would actually catch up and win, the tipping point is what you want to be looking at. To win he has to move the tipping point state (or states he is even further behind in) over to his side of the line. And the tipping point is moving further away at the moment.
If you look at the tipping point chart you can see that Trump had indeed been making progress on the tipping point starting about when the Access Hollywood tape dropped. But that started to reverse around the 23rd. At the same time that his expected electoral college result was still improving.
This is still confusing. What is happening? Well, all the states aren’t moving in lock step in reaction to events. A number of close states have moved toward Trump, like Florida for instance. But key states like Pennsylvania have been moving away from him. Because of this divergence, we can have Trump improving his electoral college “score” while simultaneously the path to 270 electoral votes gets harder.
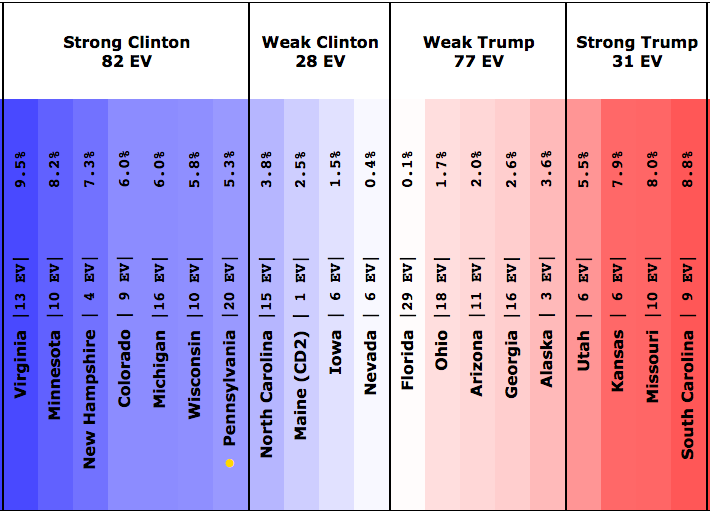
And in fact, at the moment, 270 looks out of reach for Trump. Look at the spectrum of the close states above. Right now Trump could win every state he is ahead in, then also pull over the states where he is close… Nevada (0.4% Clinton lead), Iowa (1.5% Clinton lead), Maine CD2 (2.5% Clinton lead), and North Carolina (3.8% Clinton lead)… and Trump would still lose by 6 electoral votes.
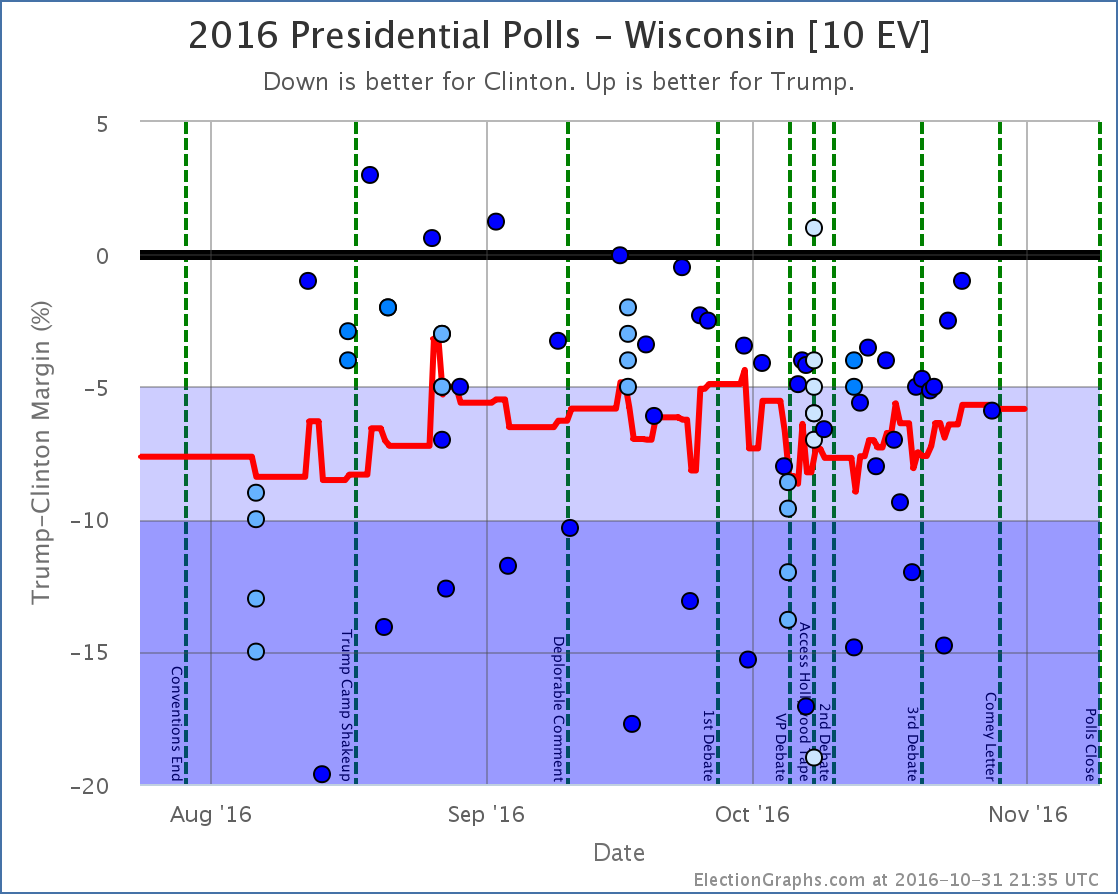
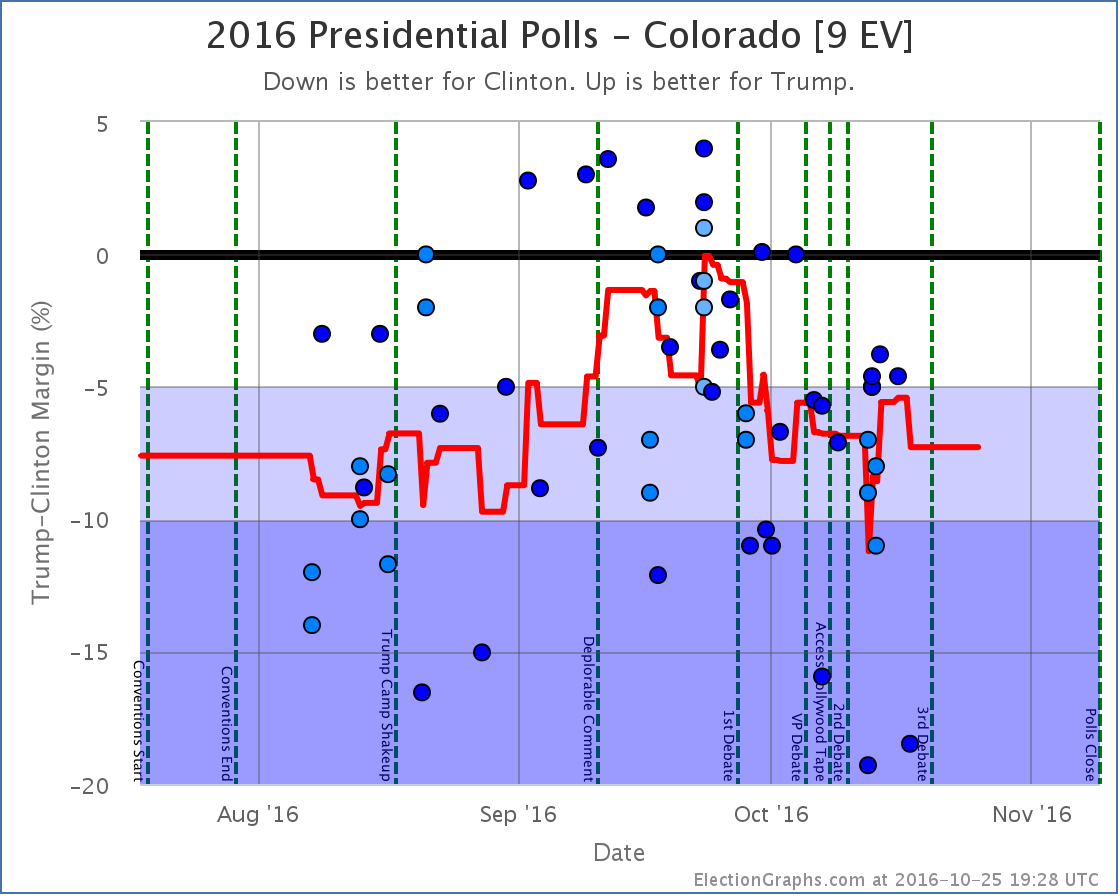
To win, Trump has to win all of the close states, plus Pennsylvania, where Clinton has a 5.3% lead at the moment… or one of the other larger “Strong Clinton” states… Wisconsin, Michigan, Colorado, Minnesota, or Virginia… all of which Clinton currently leads by even bigger margins. (New Hampshire isn’t enough to push Trump over the edge with only 4 EV.)
This is a really big pull with so little time left. The Trump side seems to be hanging their hopes on the fallout from the Comey Letter. This may cause some movement, but early indications are that almost all voters made up their minds on the Clinton email issue and if it mattered to them long long ago, and this is unlikely to change many minds.
We’ll start to see if there is any movement due to the letter within a few days. But there just are not that many days left. Sites that give odds for Trump winning range from less than 0.01% on the low side to 24.4% on the high side. The median odds seem to be around 5%. That isn’t impossible. But those odds are low enough that a Trump win would be a very big surprise.
There is another goal that Trump has a much better shot at though. If the election ends up exactly how things look today, Trump will lose by only 62 electoral votes. That would mean that Trump would do better than both McCain (lost by 192 EV) and Romney (lost by 126 EV). It may not be an actual win, but Trump improving on the performance of both previous Republican candidates may give the message to Republicans that a Trump like candidate in 2020 might be the way to go rather than returning to Romney or McCain style Republicanism.
We shall see.
8.1 days left until we start getting actual election results.
We are almost there.
State Details
The following are the detailed charts for all the states that influenced the national changes outlined above.
Moving from Clinton to Trump

Moving from Trump to Clinton

Now a possible Clinton pickup
Now out of Trump’s reach
Now out of Clinton’s reach
Also influencing the tipping point
A note about McMullin
Election Graphs is designed around showing the Republican – Democrat margin, and there is not enough time before the election to revamp the site to properly account for 3rd parties that are strong enough to have a shot at winning electoral votes.
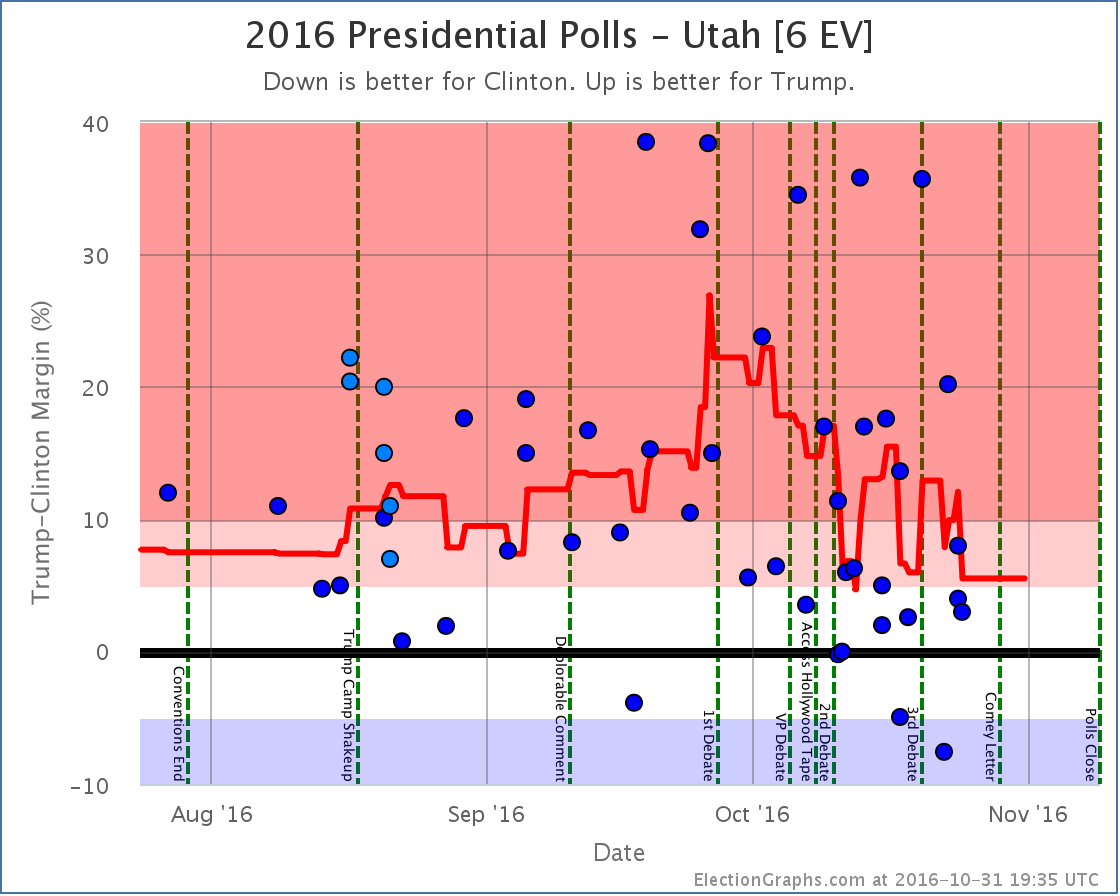
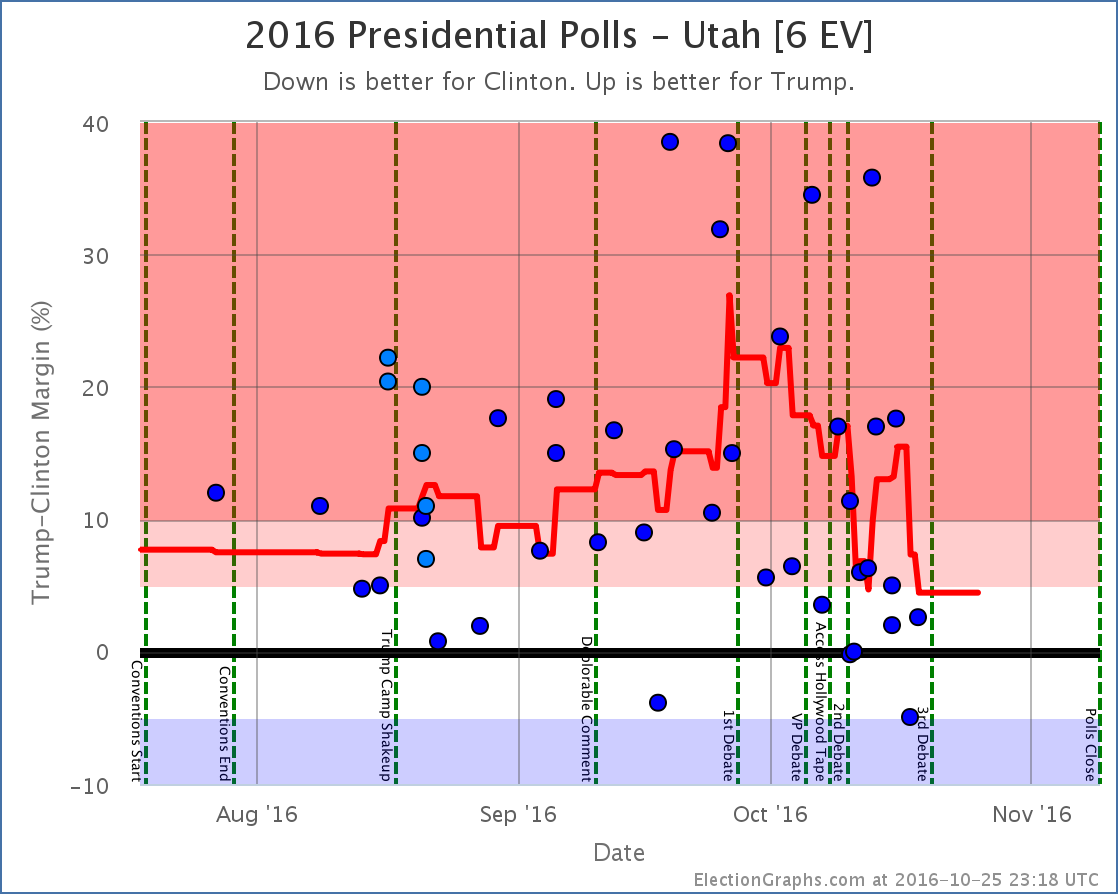
Right now the Real Clear Politics average in Utah has McMullin 6.0% behind the lead. The 538 average in Utah has him 7.3% behind the lead. If/when McMullin is within 5% according to either of these averages, I will add notes to both the Utah and National pages about the possibility of McMullin winning Utah’s 6 electoral votes.
For more information…
This post is an update based on the data on ElectionGraphs.com. Election Graphs tracks a state poll based estimate of the Electoral College. All of the charts and graphs seen in this post are from that site. Additional graphs, charts and raw data can be found there. Follow @ElectionGraphs on Twitter or like Election Graphs on Facebook to see announcements of updates or to join the conversation. For those interested in individual general election poll updates, follow @ElecCollPolls on Twitter for all the polls as they are added. If you find the information in these posts interesting or useful, please consider visiting the tip jar.
States with new poll data added since the last update: All 50 states, DC, and the Maine congressional districts
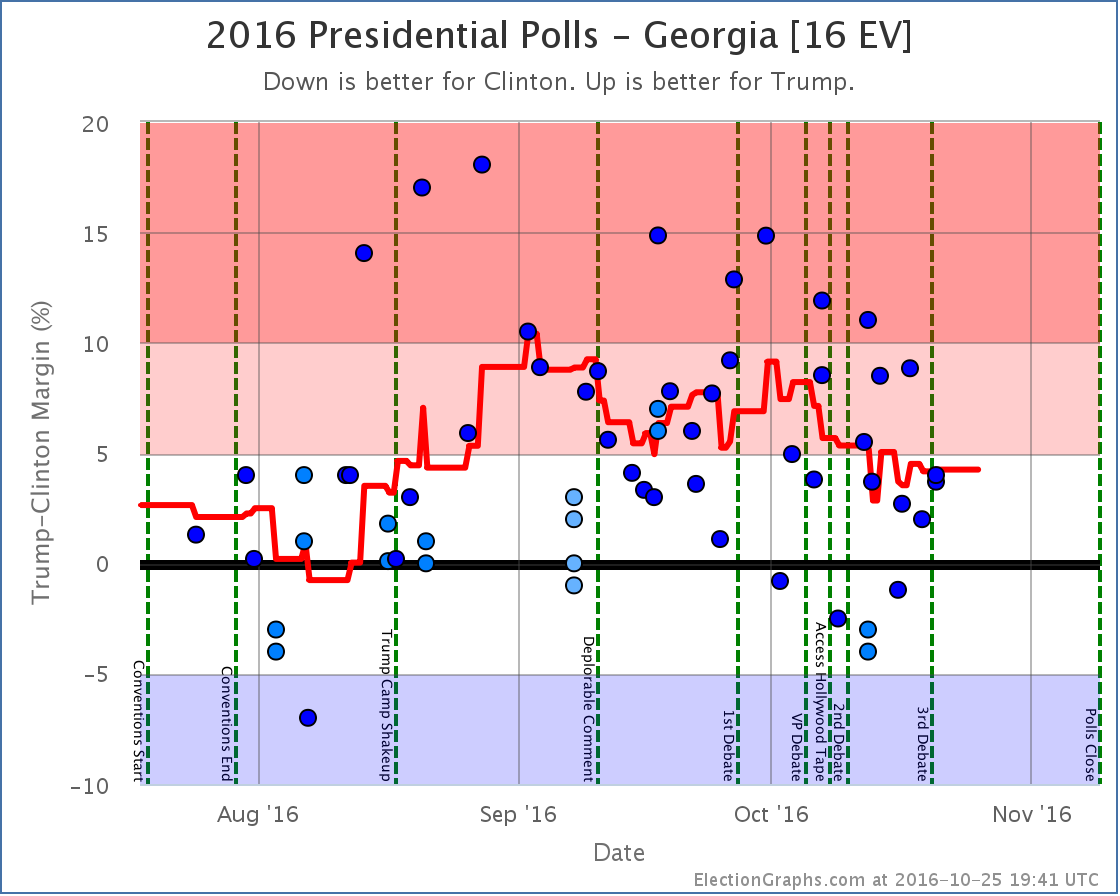
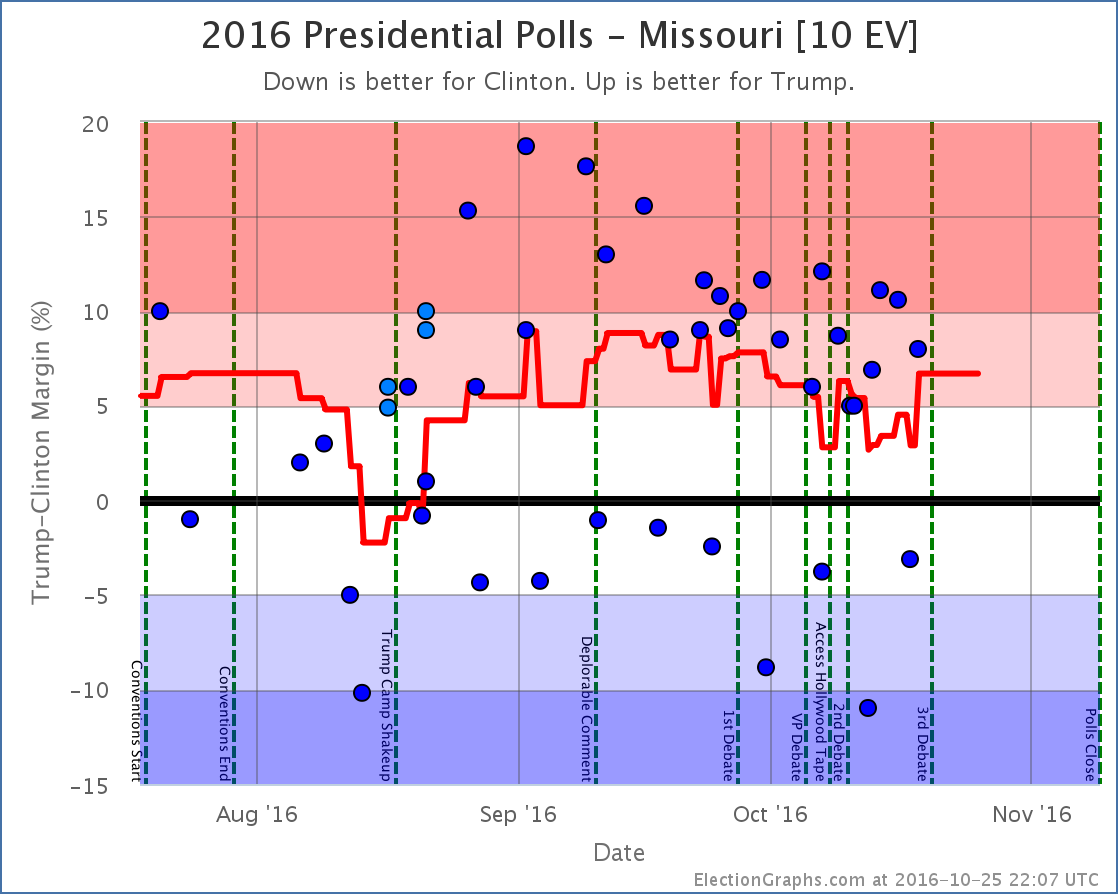
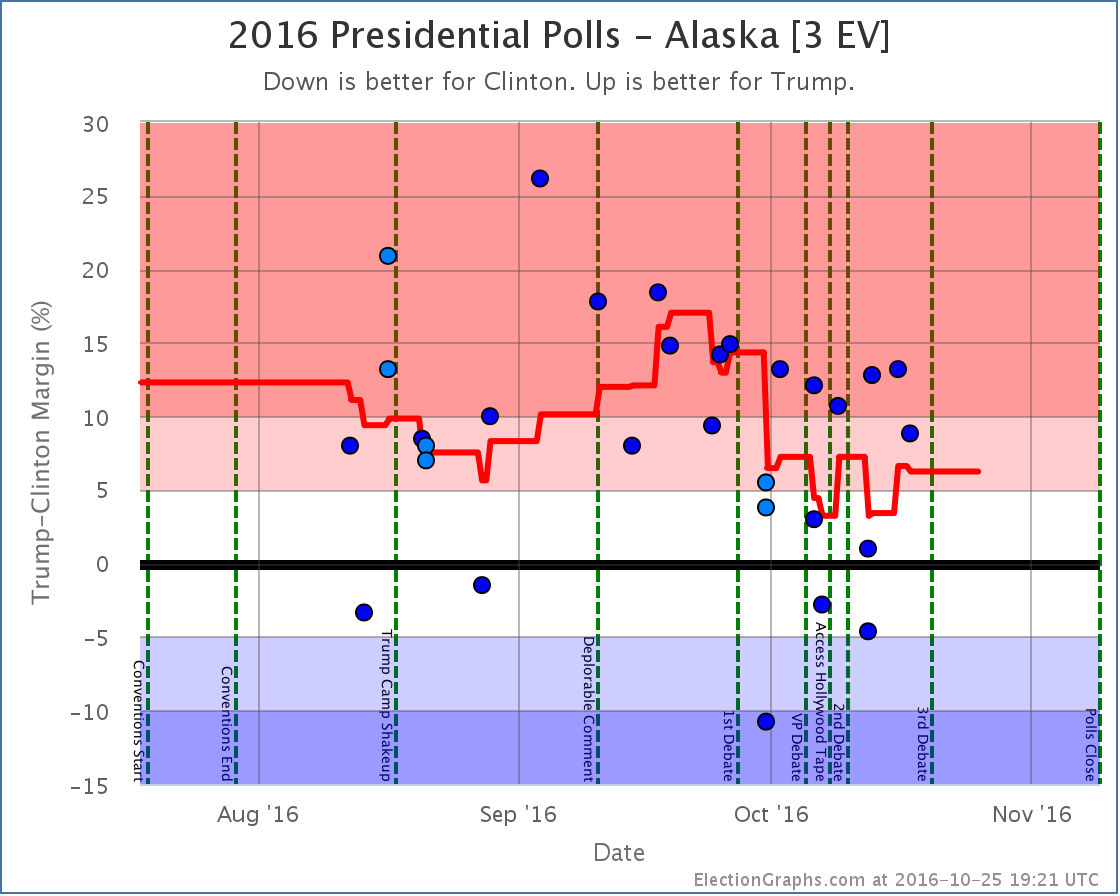
Notable changes in: Iowa, Georgia, Utah, Alaska, Indiana, Missouri, Maine (CD2), and the tipping point
National Summary
It has been about six days since my last update and the trend since then has been toward Trump. Here are the stats:
Good for Trump:
- The expected result changed from a 140 EV Clinton win to a 130 EV Clinton win
- The tipping point moved from Clinton by 4.9% in PA to Clinton by 4.1% in PA
- Clinton’s best case declined from a 238 EV win to only a 234 EV win
No change
- Trump’s best case remained a 34 EV win
Charts
Discussion
With all the data we have now, looking back to the release of “the tape” on October 7th the overall movement has been mixed. Both candidates have improved their “best cases” as states that were not close have gotten closer… on both sides. So this doesn’t show a move toward one candidate or another, but rather some red states getting less red while simultaneously some blue states got less blue.
Some of the really close states moved across the center line… in both directions… resulting in a net movement of the expected electoral college margin toward Trump by 24 electoral votes… but the most indicative sign of movement toward Trump is actually the tipping point.
Since the release of the tape the tipping point has moved from Clinton leading by 6.0% (in Virginia) to Clinton leading by only 4.1% (in Pennsylvania). So… with some of the worst news cycles for a politician in decades, with day after day after day of negative revelations… Trump improved his position by nearly 2%.
How to interpret this? My best guess… Most people were pretty well set on their Trump vs Clinton choice prior to the reveal of the tapes and the subsequent sexual assault allegations. In the wake of the first debate the part of the public that was persuadable had already swung us from near Trump’s ceiling to near Trump’s floor. With the string of additional bad news, very few die hard Trump supporters moved away from him, while some number of those persuadables viewed this as the press piling on Trump and went back to him thinking this was unfair.
But to be honest, the above is trying to make up a story to fit the numbers. Is it right? I don’t know.
In the end though, the reality is that in the face of a hurricane of bad coverage, Trump has actually improved his position.
Despite the improvement, Trump is still losing by a significant margin, but Trump’s best case does still includes a win.
If he keeps all the states he leads, then flips Arizona, North Carolina, Florida and Pennsylvania, he could still pull out a narrow win. Arizona is close enough it could flip back easily enough. North Carolina and Florida have both been back and forth over the past couple months, so seeing them go red again would not be shocking.
Pennsylvania is the hard pull. While he made it close in September, Trump has never led in Pennsylvania. And Trump needs Pennsylvania to win. Right now, this is Clinton’s firewall.
Clinton would clearly like to be leading in Pennsylvania by more than 4.1%… but even at that margin, it is a tall wall for Trump to climb.
There are 13.7 days left until the first polls close. With less than two weeks left to go now, it is almost certainly too late for Trump to flip all the states he would need to flip in order to win. But if he manages to continue the trend of the last couple of weeks, it is enough time for him to make it close enough that Democrats will start to panic.
State Details
The following are the detailed state charts for states that influenced the status changes since the last update.
Weak Clinton to Weak Trump
Weak Trump to Weak Clinton
Influencing the tipping point
Now possible Clinton pickups
No longer possible pickups for Clinton
A note about McMullin
Election Graphs is designed around showing the Republican – Democrat margin, and there is not enough time before the election to revamp the site to properly account for 3rd parties that are strong enough to have a shot at winning electoral votes.
Right now the Real Clear Politics average in Utah has McMullin 5.5% behind the lead. The 538 average in Utah has him 8.5% behind the lead. If/when McMullin is within 5% according to either of these averages, I will add notes to both the Utah and National pages about the possibility of McMullin winning Utah’s 6 electoral votes.
For more information…
This post is an update based on the data on ElectionGraphs.com. Election Graphs tracks a state poll based estimate of the Electoral College. All of the charts and graphs seen in this post are from that site. Additional graphs, charts and raw data can be found there. Follow @ElectionGraphs on Twitter or like Election Graphs on Facebook to see announcements of updates or to join the conversation. For those interested in individual general election poll updates, follow @ElecCollPolls on Twitter for all the polls as they are added. If you find the information in these posts interesting or useful, please consider visiting the tip jar.
Since the last update there have been new polls in Arizona, Washington, Illinois, Iowa, Florida, Ohio, Pennsylvania, and Utah. The latest ones in Pennsylvania, Arizona and Utah made differences to the Electoral Graphs model. Two of these moves favored Trump, but one favored Clinton.
We’ll cover them in order of how many electoral votes each state has.
Pennsylvania (20 EV)
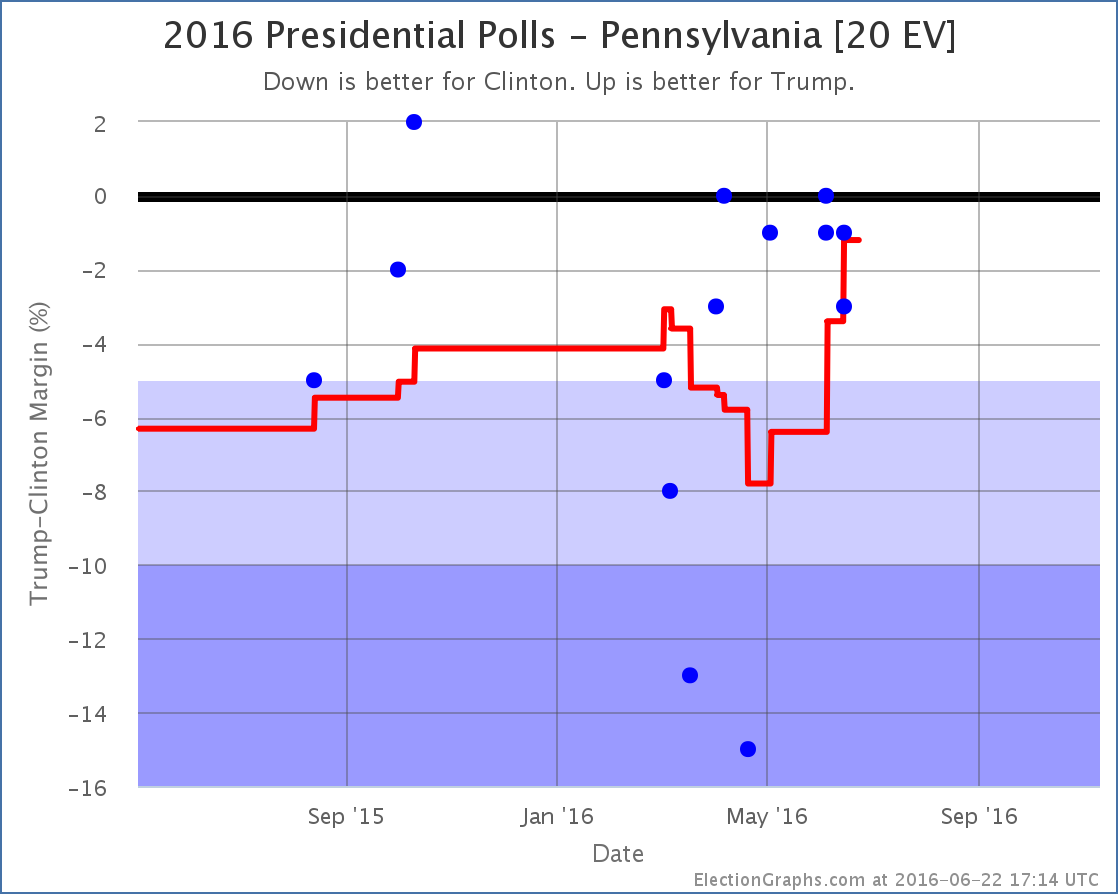
The polling average moves from Clinton by 3.4% to Clinton by 1.2% as a really good poll for Clinton (15% lead) from April rolls off the average, replaced by polls showing a close race. The state doesn’t change categories, it is still a “Weak Clinton” state, but this continues the Trumpward movement in Pennsylvania, and since Pennsylvania was the tipping point state, it moves the tipping point in Trump’s direction:
On the tipping point metric, Trump has been improving consistently since the beginning of May. This despite the continued downward trend in the national numbers. As I discussed last time, this has happened in enough states at this point that it seems like it may be a real thing. Trump is getting closer in some states, while simultaneously falling further behind nationally.
Arizona (11 EV)
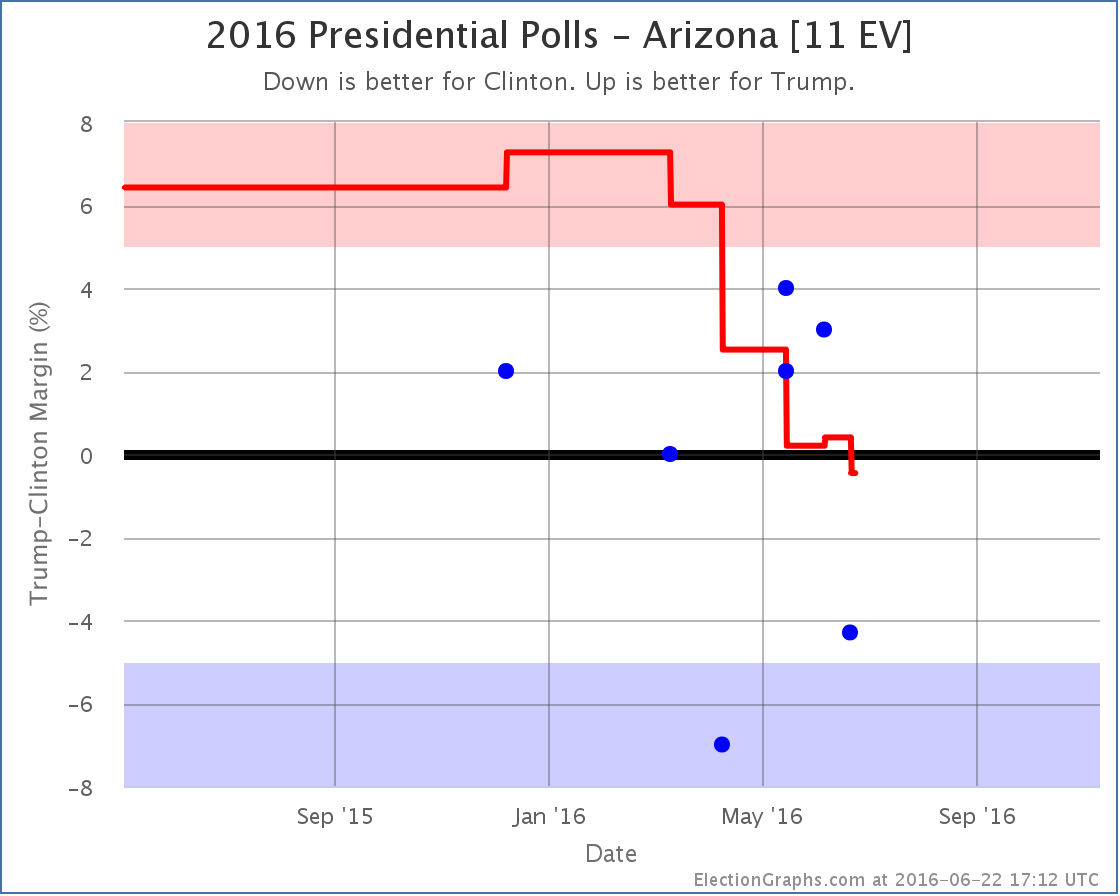
While the tipping point was moving toward Trump, Arizona has been moving toward Clinton. With the latest updates, Arizona moves from an 0.4% Trump lead to a 0.5% Clinton lead. Either way, Arizona is currently looking like a state that could go either way. But for the first time this cycle, Arizona is now on the blue side of the line. Arizona hasn’t gone Democratic in a presidential election since 1996. That isn’t as long as a state like Utah, but it is still quite some time, and it is remarkable that the poll average is showing Democrats with a lead, no matter how small.
Utah (6 EV)
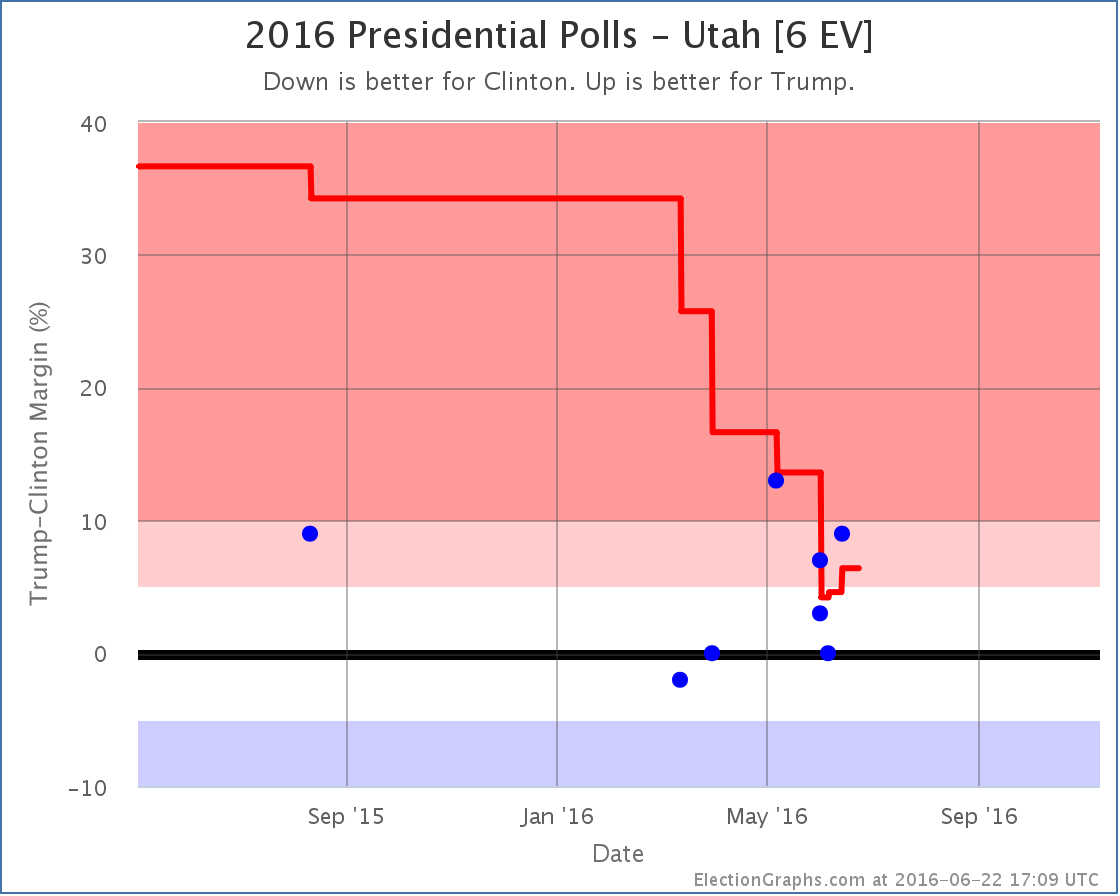
Meanwhile, as Arizona dips into the blue, Utah, which had briefly dropped into the competitive zone, once again looks a little stronger for Trump, and thus moves out of the category that could go either way. Having said that, we’re still looking at the smallest Republican margin in Utah in many decades. Just not quite as narrow as it looked.
National Summary
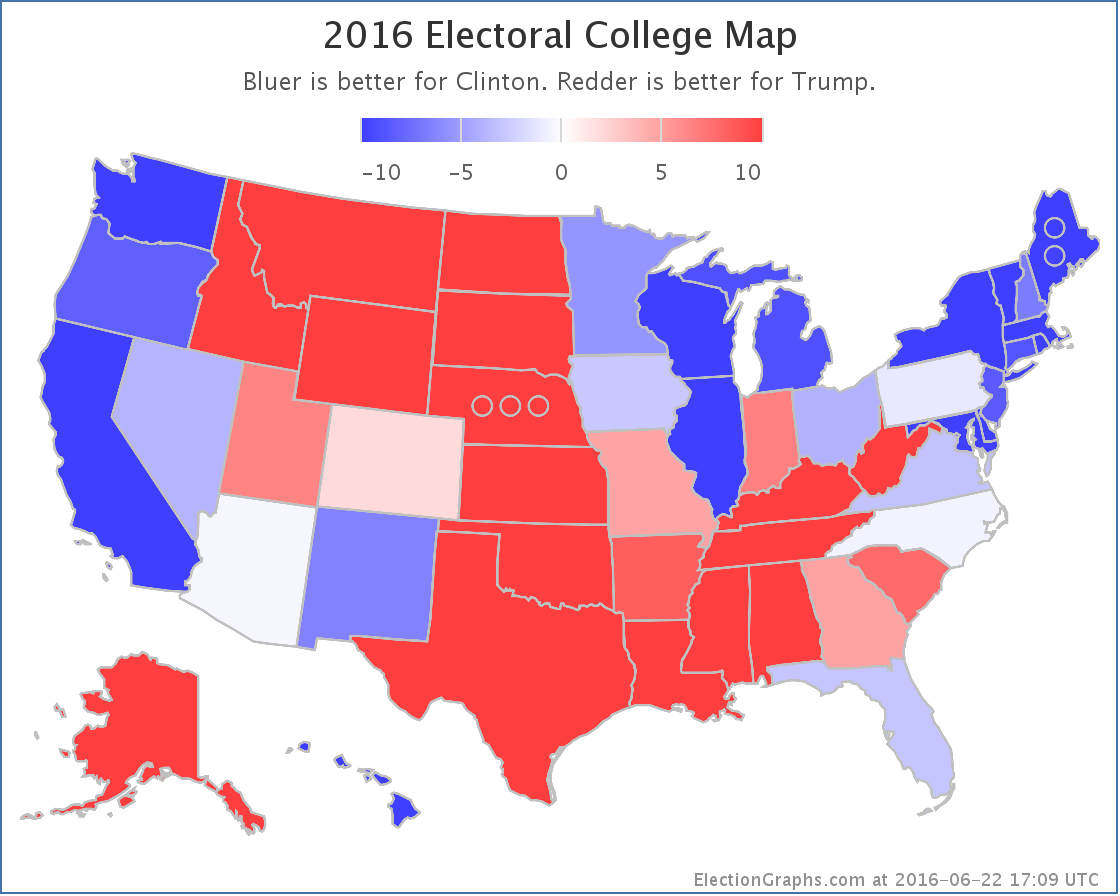
With Arizona flipping to the blue, improving the expected case for Clinton, and Utah pulling back out of the competitive zone, reducing Clinton’s best case, the national map now looks like this:
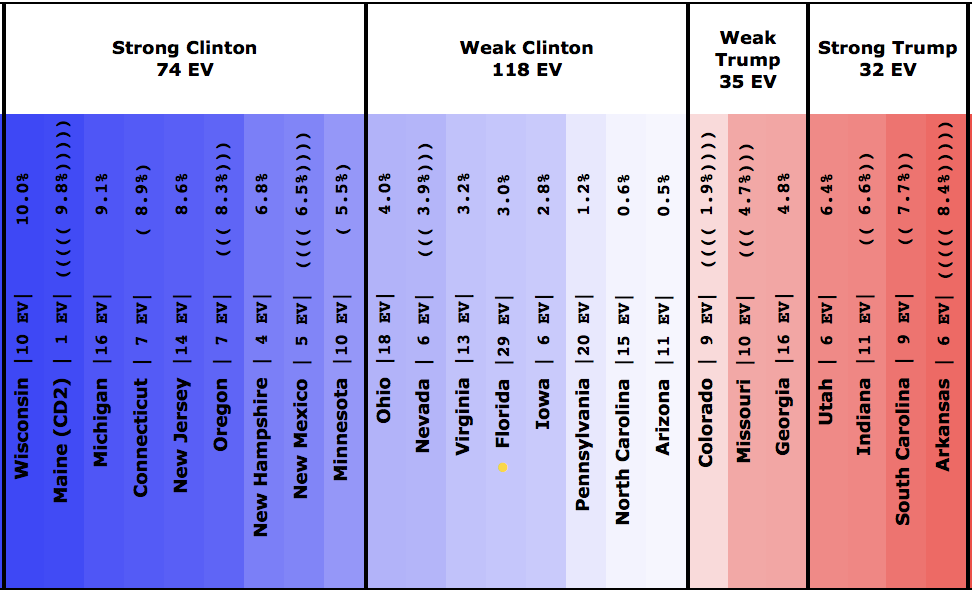
The center of the spectrum of the states (excluding the solid states where one candidate leads by more than 10%) looks like this:
And the trend bubble…
It is hard to call a trend on this.
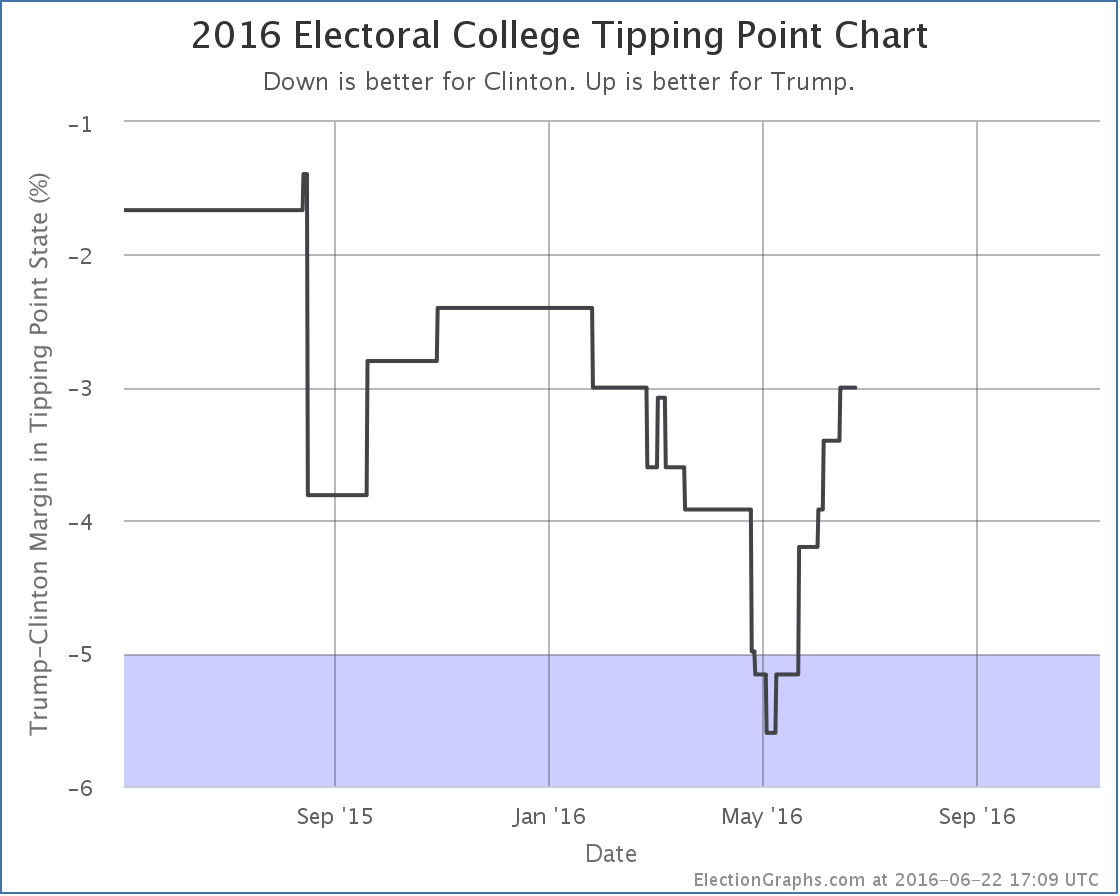
Look at the center line (the expected case) and every move since February has been toward Clinton.
Look at the top of the bubble (Trump’s best case) or the tipping point (see chart earlier in this post) and every move since early May has been toward Trump.
Look at the bottom of the bubble (Clinton’s best case) and things were moving toward Clinton until June, then started moving back toward Trump.
And of course the national polls have been moving toward Clinton for awhile now.
So what is really the trend? Well, all of them. They measure different things. Clinton’s absolute electoral college and popular vote leads are growing. But Trump is making more states close, which means his best case is improving, and the tipping point is getting closer. While meanwhile, for the moment anyway, Clinton’s best case may have hit a ceiling and be bouncing off it.
It is more complex than just looking at which direction a single number is going.
But in the end, if you have to look at only one number, it is probably the “expected” line. To win, Trump has to make that line move upward. It hasn’t been going that way for months, and it has never shown a Trump win.
Trump has 138.7 days to change that.
Note: This post is an update based on the data on ElectionGraphs.com. Election Graphs tracks both a poll based estimate of the Electoral College and a numbers based look at the Delegate Races. All of the charts and graphs seen in this post are from that site. Additional graphs, charts and raw data can be found there. Follow @ElectionGraphs on Twitter or like Election Graphs on Facebook to see announcements of updates or to join the conversation. For those interested in individual general election poll updates, follow @ElecCollPolls on Twitter for all the polls as they are added. If you find the information in these posts interesting or useful, please consider visiting the tip jar.
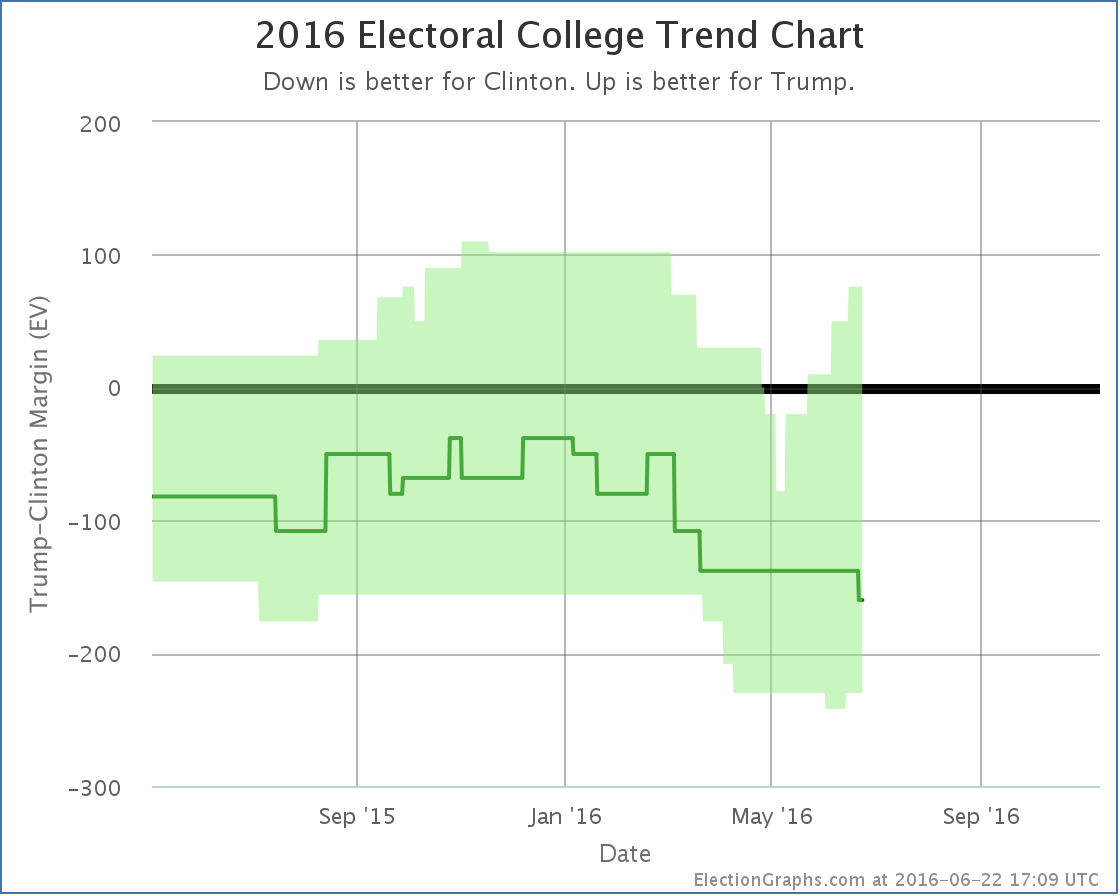
Since the last update there have been polls in New Jersey, California and Utah. The results in Utah are the ones that made a difference:
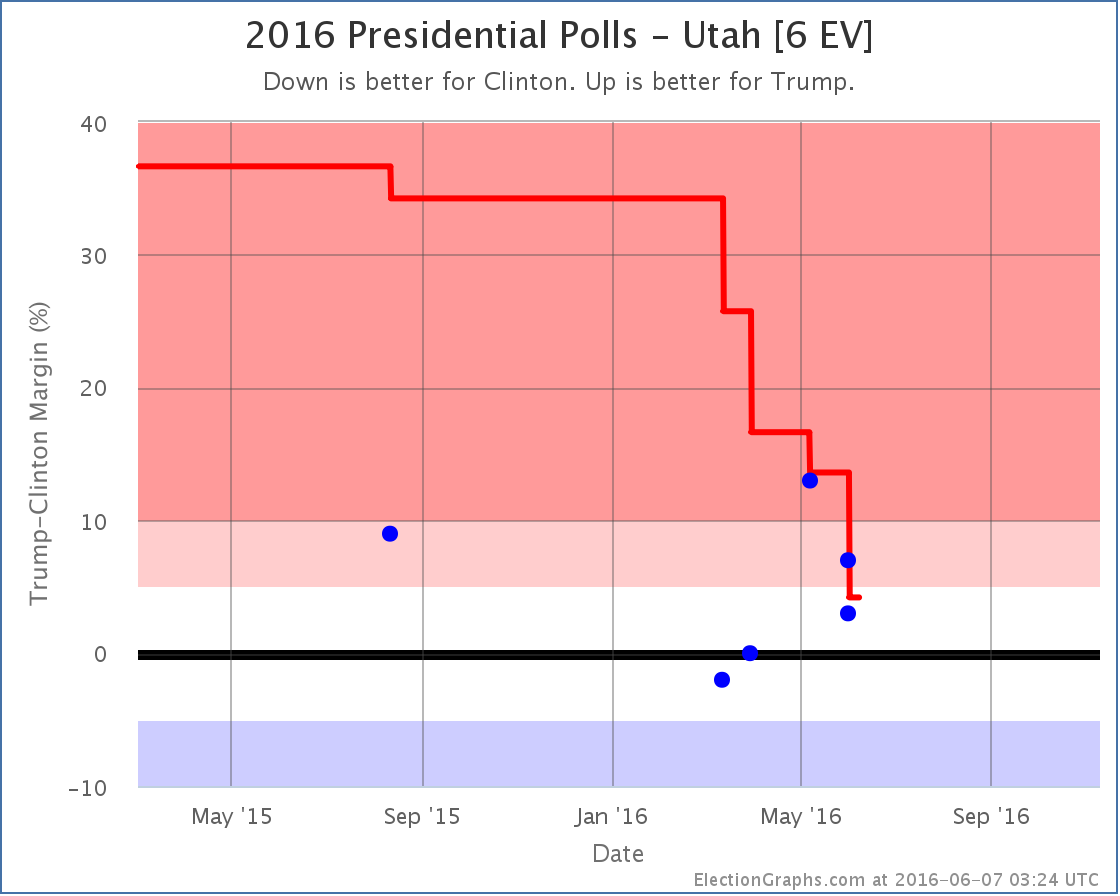
There are actually two new results logged in Utah, both from Gravis, covering the same time period. They asked the general election question twice. Once with just Clinton and Trump showing Trump leading by 7%, then again adding Johnson as a possibility, which reduces Trump’s lead to 3%. Rather than pick one or the other result, I include both.
It could be argued that this gives a single poll double weight in the average, but the way I think of it, this really is two separate results, measuring the election in different ways. So I chose to include both. This is arguable, and other people tracking poll averages may choose a different route. But this is the way I am doing it.*
In any case, these polls are within the range we have seen in all the polls this year. There is quite a bit of variability, but the one thing that is clear is that the Republican lead is much smaller than the 21% to 48% margins the Republicans saw in the 1996 to 2012 general elections. Since my poll averages are “primed” with the results of those five elections, it took awhile for the poll average to move from the huge Republican margin one would expect if Utah followed the pattern of the last few elections down to the 4.2% margin Trump now has. Put simply, this change was so large, a lot of evidence was needed before the average really believed it.
With Trump’s lead in Utah now less than 5%, it now goes into the Election Graphs “Weak Trump” category, which means it is a possible Clinton pick up. So her best case scenario improves:
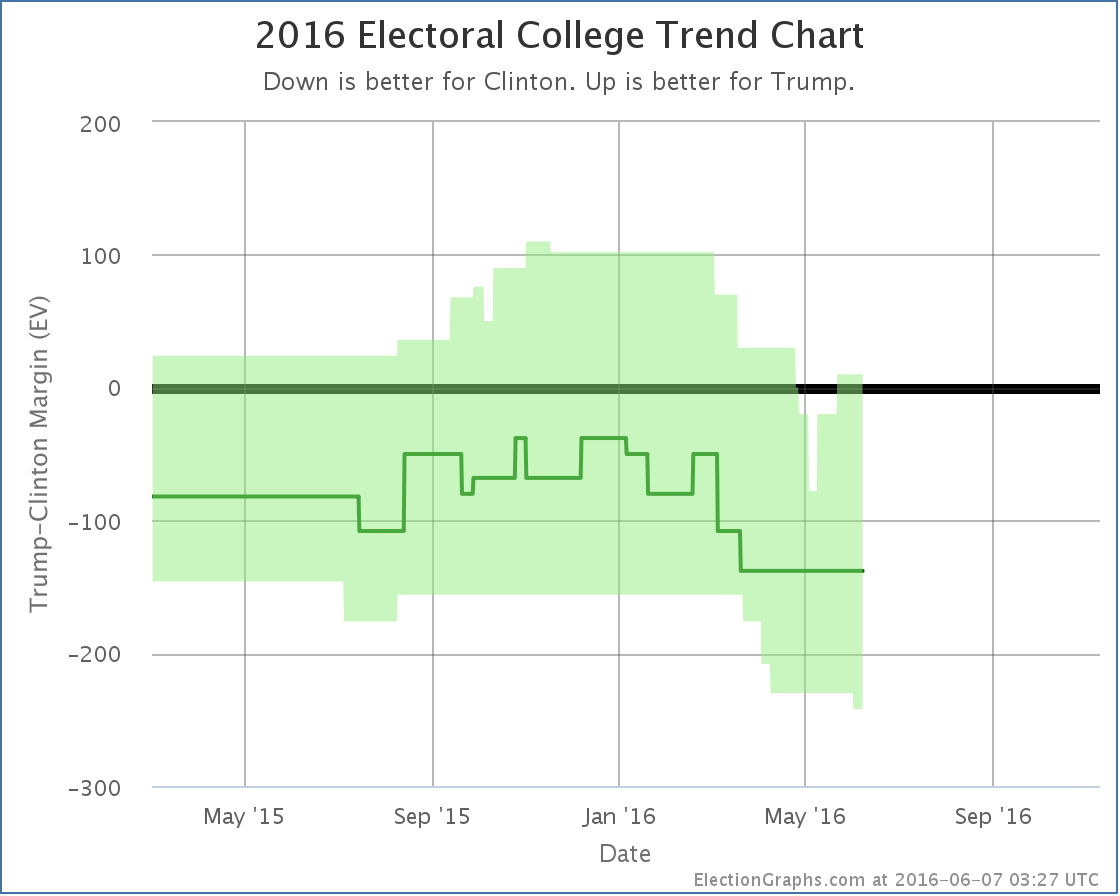
That little nub at the bottom right represents the possibility of Clinton winning Utah.
Leaving out the states where one of the candidates is ahead by more than 10%, the center of the spectrum now looks like this:
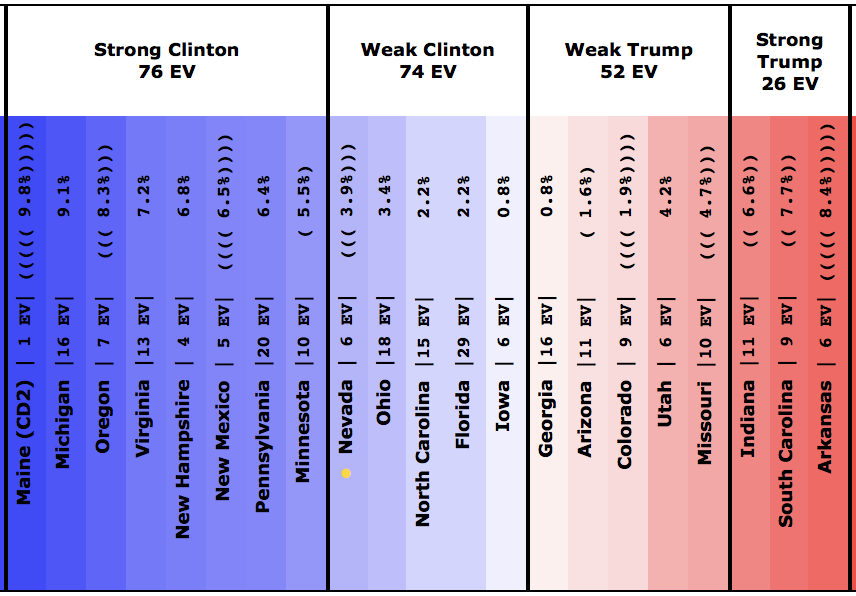
There are a lot of states here that haven’t yet had a full five polls for our average (indicated by the parentheses). But the fact that Georgia, Arizona and Utah may be competitive for Clinton show that Trump may indeed be “redrawing the map”… just not in his favor.
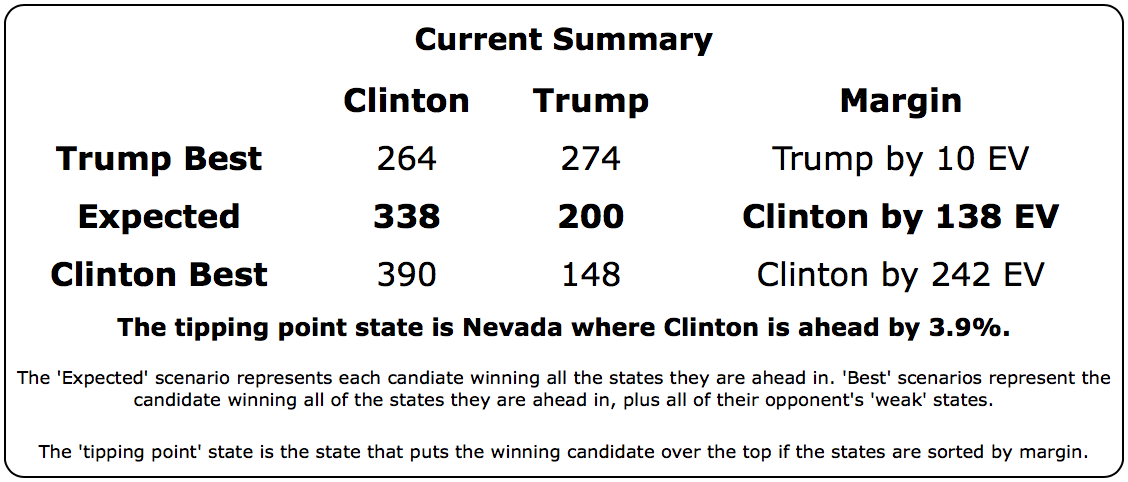
The tipping point is only a 3.9% Clinton lead on the other hand, so it isn’t an insurmountable lead by any means. Trump could still win this if campaign events go his way.
But Utah a possible Democratic stretch goal? Wow. Utah!
For reference, the last time Utah went Democratic was the Lyndon Johnson landslide over Barry Goldwater in 1964. Now, I still wouldn’t bet on Clinton winning Utah. But that it is even close is still stunning.
The overall situation summary now looks like this:
So wait, is the Trump bounce over? Well, this is a move in Clinton’s direction, so it breaks the streak of movements in Trump’s direction that had lasted for about a month. So by that measure at least the “bump” may be over.
This is just one change though, it would be premature to say that the trend is now in Clinton’s direction. As usual, we need to wait for more polls…
154.8 days until the general election polls start to close. There will be plenty of movement between now and then. Stay tuned.
* For more notes on how polls including third and forth parties will be treated on Election Graphs, see the archive of @ElecCollPolls tweets from May 29th.
Note: This post is an update based on the data on ElectionGraphs.com. Election Graphs tracks both a poll based estimate of the Electoral College and a numbers based look at the Delegate Races. All of the charts and graphs seen in this post are from that site. Additional graphs, charts and raw data can be found there. Follow @ElectionGraphs on Twitter or like Election Graphs on Facebook to see announcements of updates or to join the conversation. For those interested in individual general election poll updates, follow @ElecCollPolls on Twitter for all the polls as they are added. If you find the information in these posts interesting or useful, please consider visiting the tip jar.
Edit 14:20 UTC – Fixed typo.
When I did my last update there hadn’t been any recent polls in either Arizona or Utah, but the results there ended up matching pretty well with the results of the few polls that came out since then. Namely, Trump won Arizona which was straight up winner take all, and Cruz got over 50% in Utah, so he got all of the delegates there.
So the net for the night was Trump +58, Cruz +40.
Adding in other delegate adjustments since the March 15th results we have a net change of:
Trump +62, Cruz +43, Rubio -3
So effectively, Trump got 60.78% of the delegates since the last update. He only needed 53.07% to improve his position.
So what does this look like?
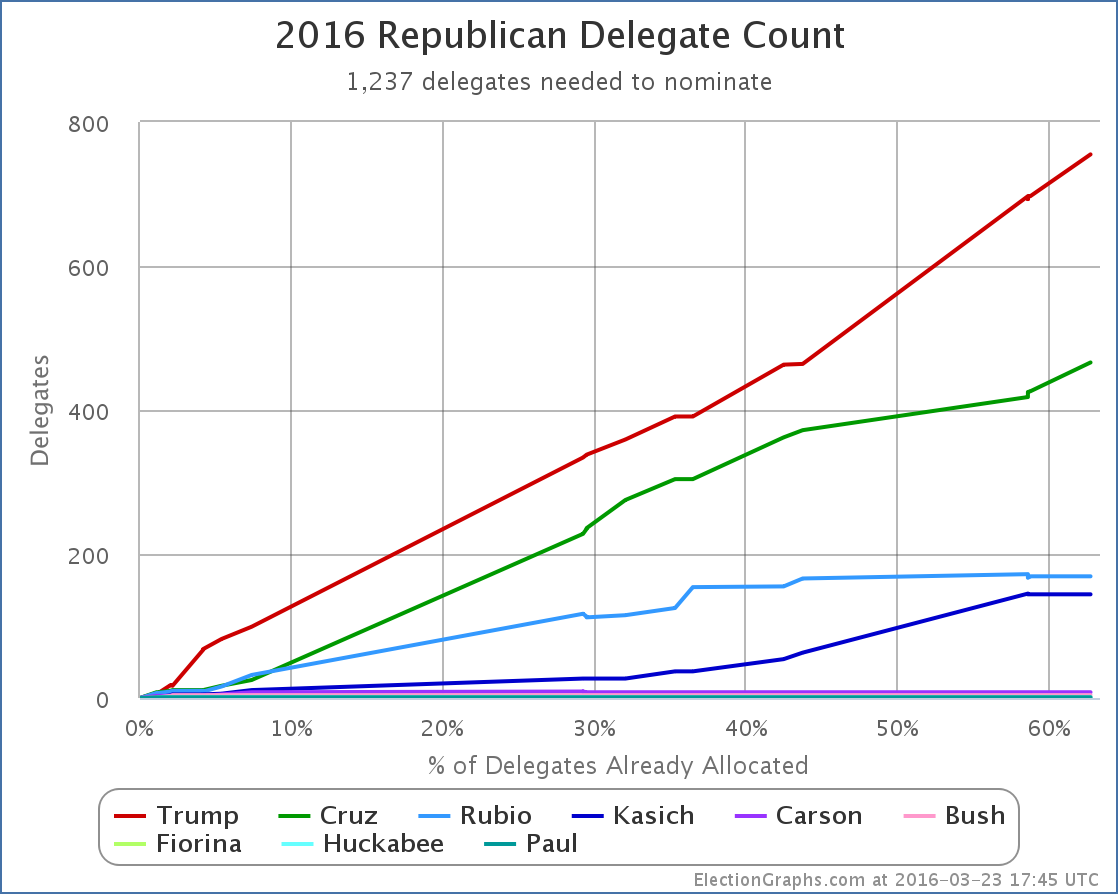
The raw delegate count is now Trump 755, Cruz 466, Rubio 169, Kasich 144, Carson 8, Bush 4, Fiorina 1, Huckabee 1, Paul 1
Trump’s pace of delegate accumulation actually looks like it has accelerated, while everybody else has slowed down.
But the raw delegate counts are not the right thing to look at.
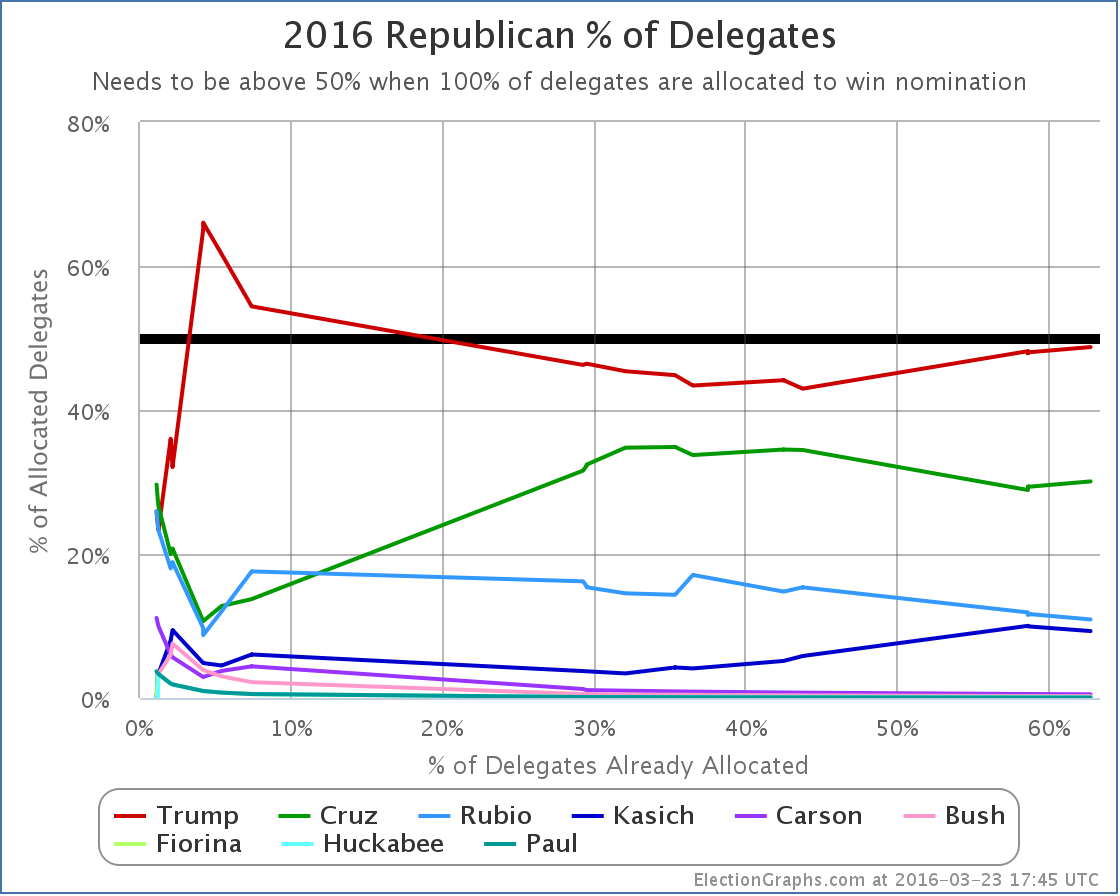
In percentages of the delegates so far, both Trump and Cruz improved. But of course Cruz is nowhere near the 50% line. Trump meanwhile is now at 48.74%. He doesn’t have a majority. Close. Very close. But not quite.
But % of delegates so far isn’t the right thing to look at either.
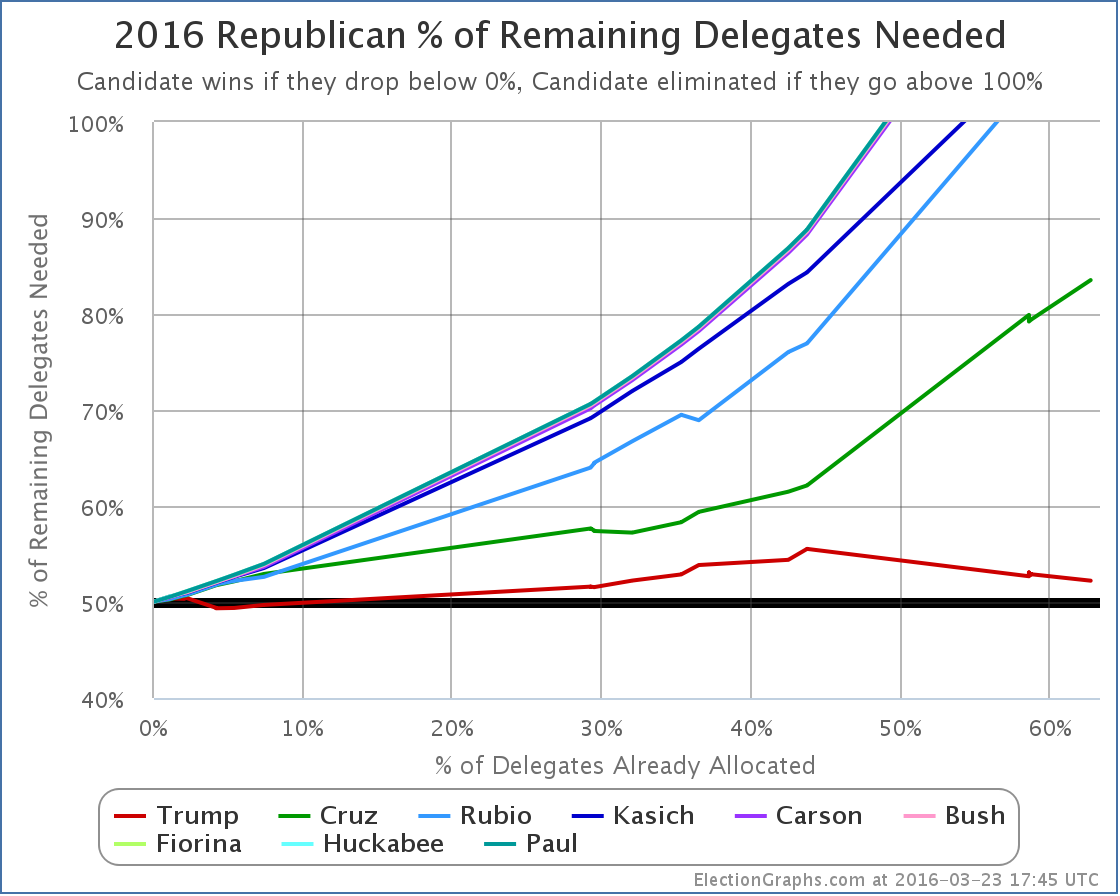
This is the real graph to watch. The percentage of the remaining delegates that Trump needs to win in order to get to the convention with a majority of delegates. This has been dropping in the last couple of contests.
Trump now needs 52.22% of the remaining delegates to win the nomination outright.
Now, some of those “remaining delegates” are 18 delegates who have already been selected as officially “uncommitted” delegates, and there will be more uncommitted delegates coming out of some of the states that have yet to vote. Probably a few dozen to as many as 100. These delegates are essentially like the Democratic superdelegates in that they can vote however they feel like and are not bound to the results of any primaries or caucuses.
If you wanted to calculate the percentage Trump would need without uncommitted delegates, it would be higher. But just like superdelegates are part of the process on the Democratic side, uncommitted delegates are part of the process on the Republican side, and to get a fair picture you need to include them.
You just have to realize that winning not only includes earning pledged delegates, but also convincing uncommitted delegates to vote for you.
It is a real possibility that we could get to the end of the primaries and caucuses in June without knowing if Trump has an outright win, or if he’ll come up short on the first ballot at the convention. It might end up depending on what those uncommitted delegates decide to do.
We are still right on the edge between a Trump win and a convention where nobody wins on the First ballot. And which way that goes may end up depending on the uncommitted delegates. What percentage of the uncommitted delegates Trump would need… if he even needs them at all… will depend on how he continues to do in getting pledged delegates between now and June.
But meanwhile, the pace of primaries and caucuses now slows down quite a bit. So there will be a lot of waiting before we know.
[Update 2016-04-01 17:15 UTC – Alaska gave back Rubio’s delegates after he asked, and Oklahoma finalized their results. Net change: Rubio +4, Cruz -2, Trump -3. This does not substantially change the analysis above.]
[Update 2016-04-04 05:43 UTC – Most of Colorado’s delegates will be determined next weekend, but the 6 representing the 1st and 6th congressional districts were determined this weekend, and all 6 went to Cruz. With this and the change above, Trump’s percentage of remaining needed to win is up to 52.83%. Adding this note here rather than doing a full post on those six delegates.]
[Update 2016-04-04 14:15 UTC – As of April 4th there were 28 “unbound” Republican delegates, with more to come soon. These are free agents like the Democratic superdelegates. I have started to track them individually when there is evidence of a known preference. So far, adding them in nets: Cruz +3, Trump+2.]
[Update 2016-04-06 02:01 UTC – Added in tentative evaluations of the uncommitted delegates from North Dakota. Net: Cruz +7, Trump +1, Kasich +1.]
Note: This post is an update based on the data on ElectionGraphs.com. Election Graphs tracks both a poll based estimate of the Electoral College and a numbers based look at the Delegate Races. All of the charts and graphs seen in this post are from that site. Additional graphs, charts and raw data can be found there. All charts above are clickable to go to the current version of the detail page the chart is from, which may contain more up to date information than the snapshots on this page, which were current as of the time of this post. Follow @ElectionGraphs on Twitter or like Election Graphs on Facebook to see announcements of updates or to join the conversation. For those interested in individual general election poll updates, follow @ElecCollPolls on Twitter for all the polls as they are added.
With Arizona, Idaho and Utah weighing in, Sanders won 74 delegates to Clinton’s 57. That’s a big win for Sanders. But it is only 56.49% of the delegates. To actually improve his overall position, Sanders would have needed 67.06% of the delegates. He didn’t reach that level, so the Sanders path to the nomination gets even harder.
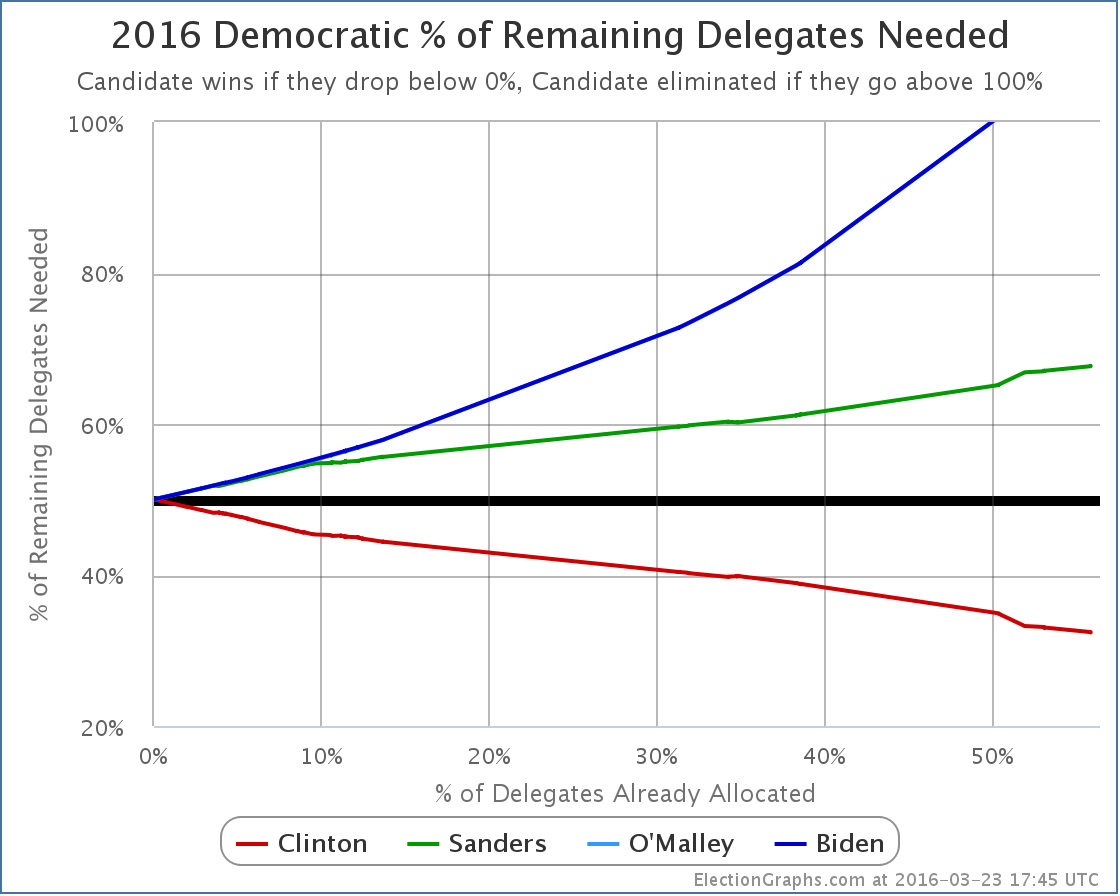
Also including an additional Sanders superdelegate that was added to the totals since the last update, Sanders now needs 67.70% of the remaining delegates to catch up and win. Or, as usual, a huge number of Clinton superdelegates changing their minds could change everything. That seems increasingly unlikely the closer Clinton gets to the nomination of course. But if it happens, you’ll see it here.
[Update 3/26 21:14 UTC – Updates in preparation for new results tonight. Superdelegate changes: Sanders +4. Updates from FL/GA/AZ net: Sanders +4, Clinton -4.]
Note: This post is an update based on the data on ElectionGraphs.com. Election Graphs tracks both a poll based estimate of the Electoral College and a numbers based look at the Delegate Races. All of the charts and graphs seen in this post are from that site. Additional graphs, charts and raw data can be found there. All charts above are clickable to go to the current version of the detail page the chart is from, which may contain more up to date information than the snapshots on this page, which were current as of the time of this post. Follow @ElectionGraphs on Twitter or like Election Graphs on Facebook to see announcements of updates or to join the conversation. For those interested in individual general election poll updates, follow @ElecCollPolls on Twitter for all the polls as they are added.
[Edit 18:14 to fix the date in the title.]


|
Romney |
Obama |
| Romney Best Case |
270 |
268 |
| Current Status |
206 |
332 |
| Obama Best Case |
190 |
348 |
There were no calls between 02:45 UTC and 03:00 UTC. Between 03:00 UTC and 03:15 UTC Utah was called for Romney, and New Hampshire was called for Obama. New Hampshire is of course the one that matters. It was one of the close states that Romney really could have used…
Romney’s best case is now hanging on to a win by the barest possible margin. He can afford to lose Maine’s 2nd congressional district, making this a 269-269 tie, which would give us Romney/Biden. But he can’t lose ANY of the other close states… unless he pulls a big surprise and wins a state where he was behind by more than 5% in the polls.
Starting at 190 with the areas he was ahead by more than 5%:
- Nebraska 2nd (1): 3.8% Romney lead
- North Carolina (15): 1.4% Romney lead
That gets Romney to 206. Then we have:
- Iowa (6): 2.0% Obama lead
- Florida (29): 2.3% Obama lead
- Colorado (9): 2.4% Obama lead
- Maine 2nd (1): 2.8% Obama lead
- Virginia (13): 3.6% Obama lead
- Nevada (6): 4.8% Obama lead
The only thing on that list Romney can afford to lose is Maine’s 2nd.
We only need any one of those remaining states called for Obama, and Obama wins his second term.
|
|

