States with new poll data added since the last update: All 50 states and DC.
Notable changes in: Ohio, Arizona, Indiana, Kansas, Pennsylvania, and the tipping point
National Summary
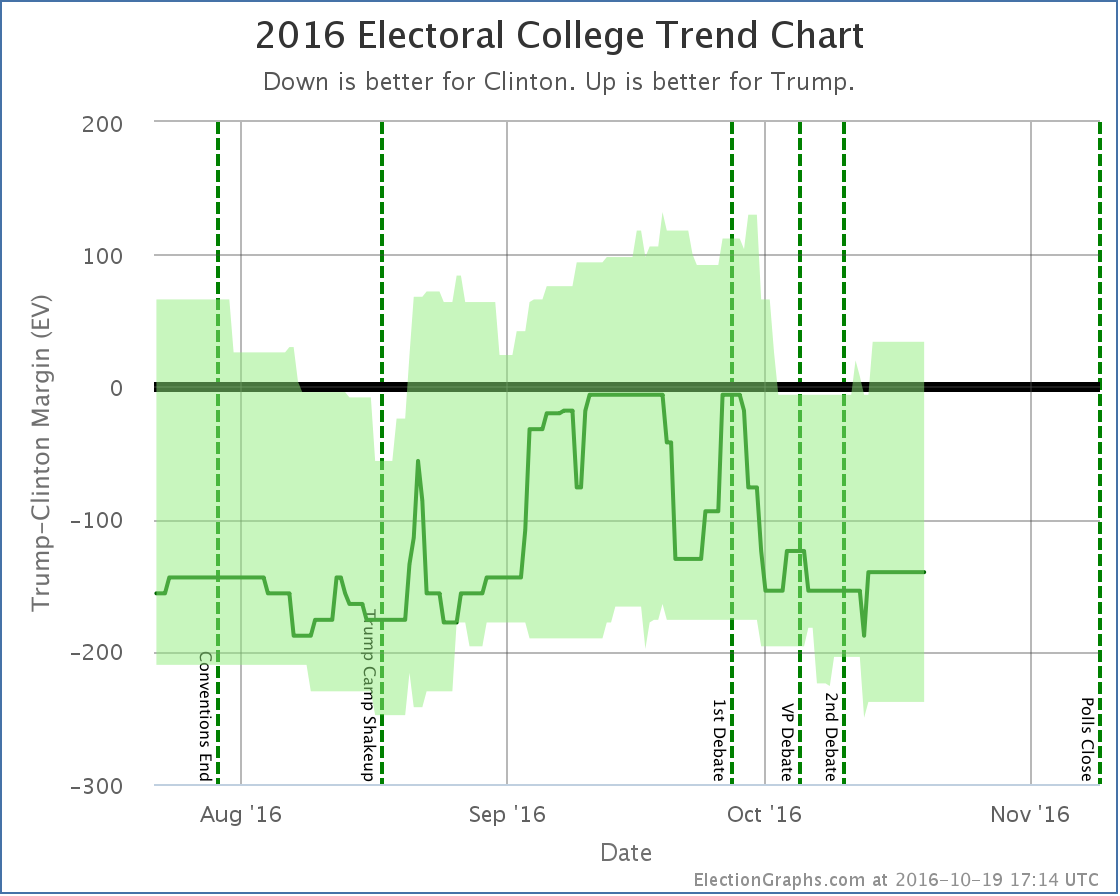
Despite the widespread view that the time between the Vice Presidential debate and the present has essentially been non-stop bad news for Trump that could only cause his number to fall, and the fact that the national popular vote numbers do show this kind of trend, the electoral college view has just plain not shown that. In fact, looking at the various electoral college numbers we track here, things have mostly been moving in Trump’s direction since the 2nd debate. In the latest update, we have these changes:
Good for Trump:
- Expected case moves from a 154 EV win for Clinton to a 140 EV win for Clinton
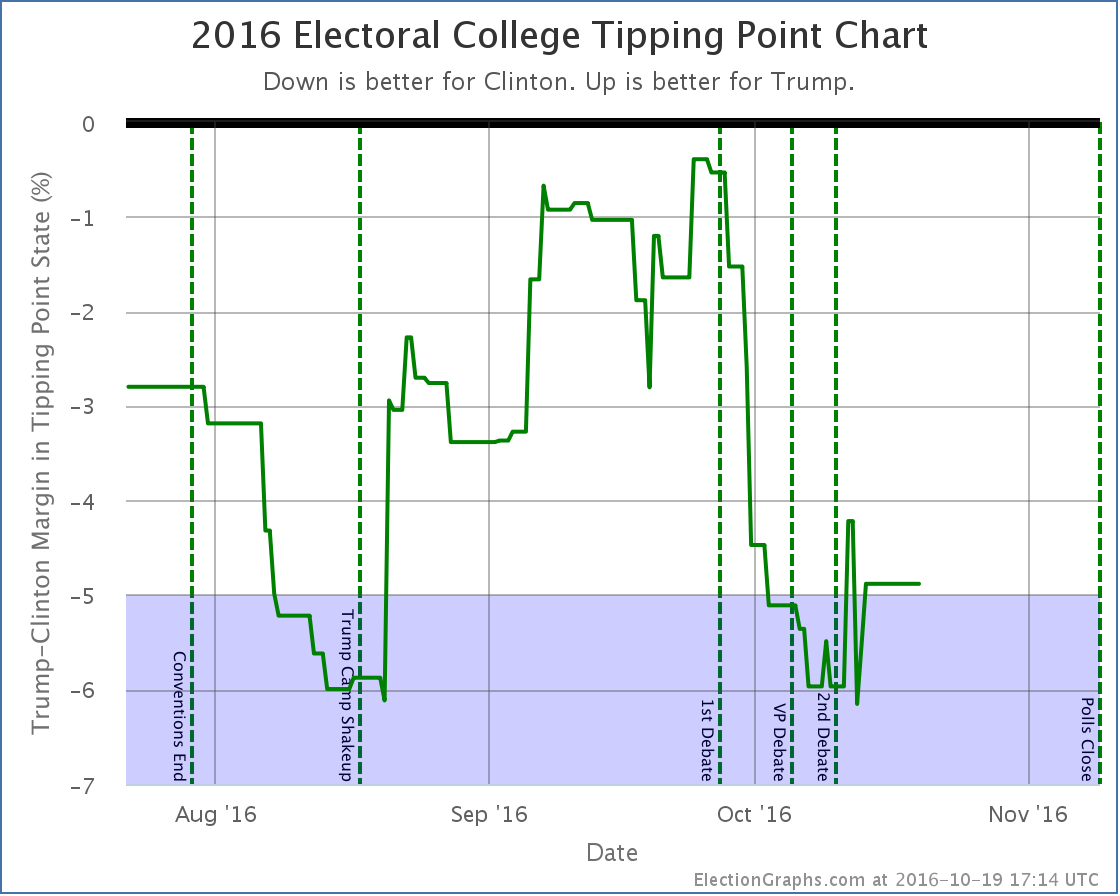
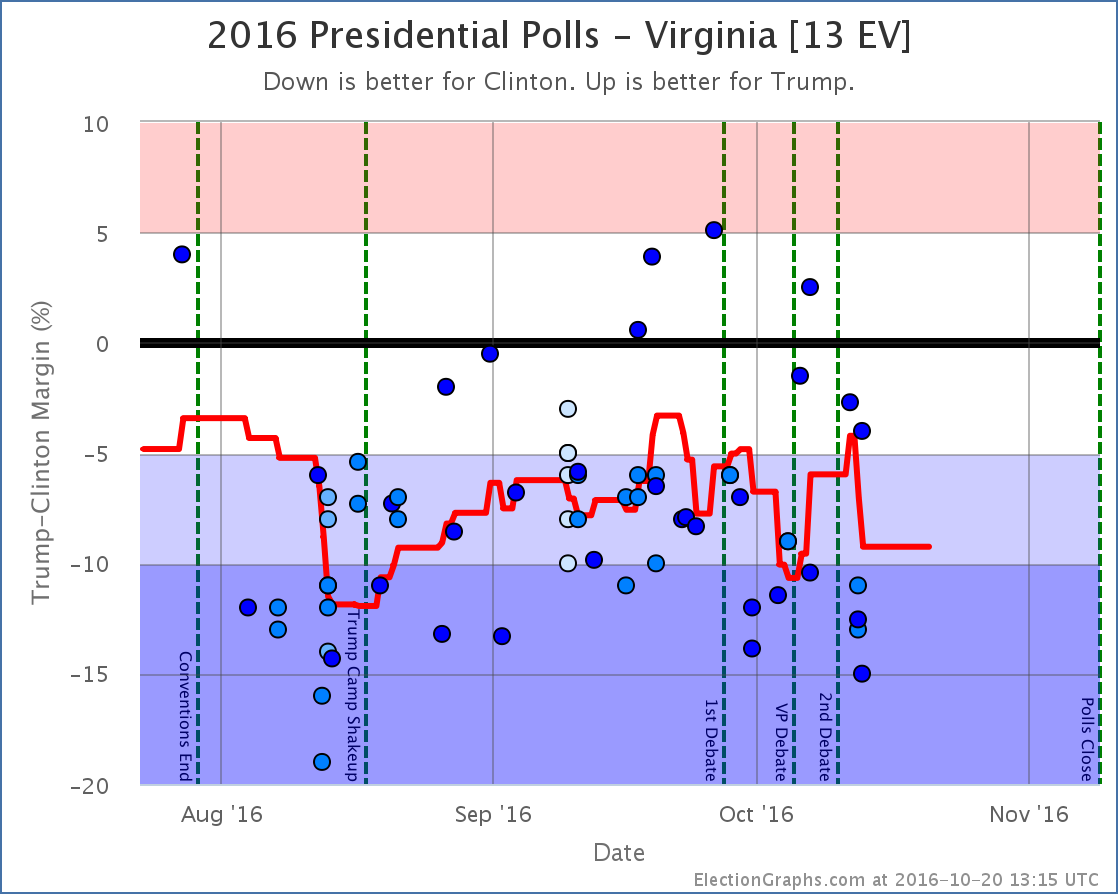
- Tipping point moves from Clinton by 5.4% in VA to Clinton by 4.9% in PA
- Trump best case improves from a 6 EV loss to a 34 EV win
Good for Clinton:
- Clinton best case improves from a 204 EV win to a 238 EV win
While Clinton’s best case does improve a bit (although this may be due to outliers, see state details below), for the most part the movement here is toward Trump. It is not a huge movement, but it also doesn’t look like Trump continuing to crash.
Here are the charts:
While we do have Indiana and Kansas moving into the “Weak Trump” category, and thus expanding Clinton’s best case, the net changes for the expected case and tipping point are both in Trump’s direction, and Trump improves his best case as well, with Clinton’s lead in Pennsylvania down from where it was at the VP debate.
Looking at both charts, while Trump may have improved a bit from his lows, what this really looks like is that we have reached a plateau and things have basically been flat since the VP debate, minus some jiggles around the edges by states that are right near my category boundaries.
There are still events that aren’t factored in here, including some of the later sexual assault allegations, and of course the third debate. So things may start moving again in the next few updates. But for now… basically flat.
The “best case”, if Trump wins all his states, plus all the states where he is within 5%, now once again registers a narrow Trump win. But that would still require either a fairly large systematic polling error, or a last minute Trump surge. The “bubble” shows the extreme range of “conceivable possibilities”, but the edges of the bubble are still very unlikely. We’re far more likely to get results closer to the “expected” line.
Looking at the expected result, we are once again we are in the zone where Trump does better than McCain, but worse than Romney. That is a solid Clinton win, but not any sort of unprecedented loss for Trump. Just a normal sort of electoral loss. At least in terms of the electoral college.
We’ll see if anything causes that to change.
19.3 days left until we start getting real vote counts instead of polls…
State Details
Weak Clinton to Weak Trump
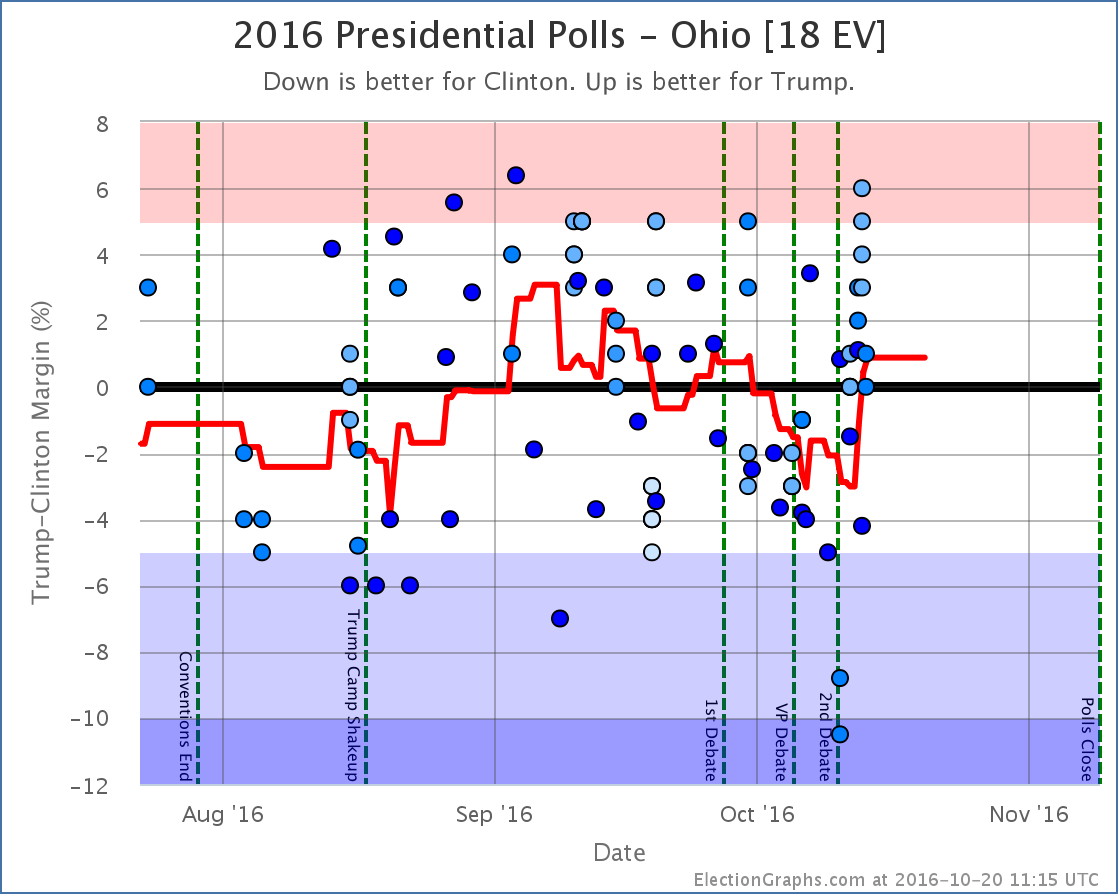
Trump now leads Ohio by 0.9%, but Ohio has been bouncing up and down right around the center line for months. It had been trending toward Clinton until a recent batch of polls that were better for Trump. Really could go either way.
Weak Trump to Weak Clinton
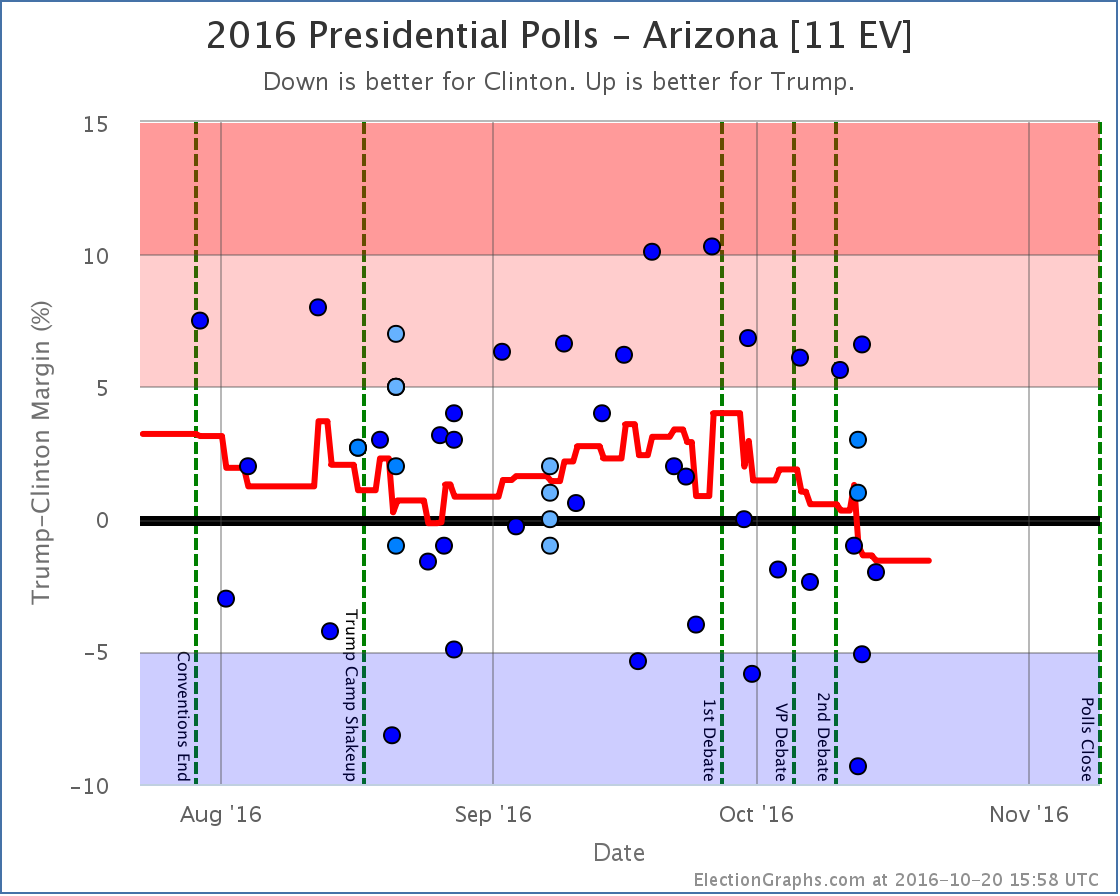
Clinton is now at +1.6% in Arizona. The state has been trending in her direction since the 1st debate. It is still close though, and this could be reversed. There is a reason we call the “weak” states weak.
Into reach for Trump
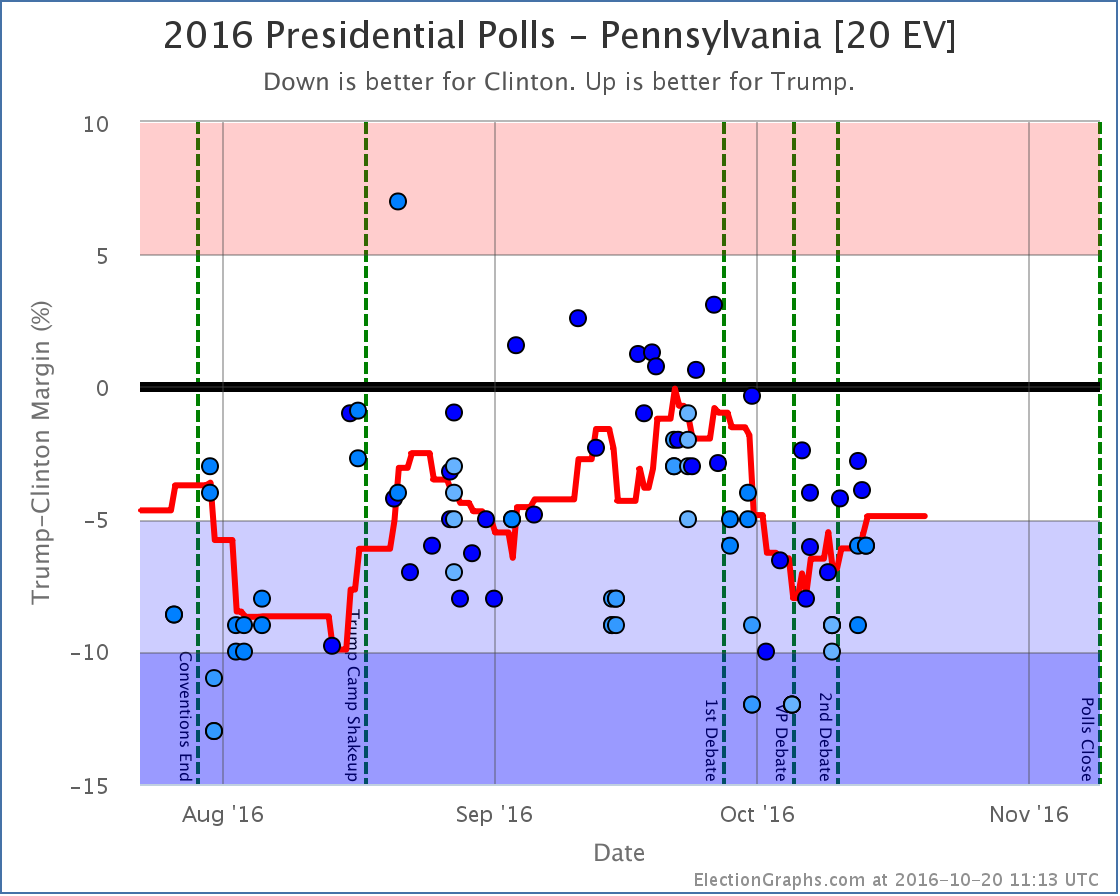
Clinton’s lead in Pennsylvania grew considerably after the 1st debate, but has been shrinking again since the VP debate. It now stands at only 4.9%, which means we once again consider it within reach for Trump. If Trump managed to stretch out and win Pennsylvania, his overall shot of winning the White House is significantly greater. But he has never led in the Pennsylvania poll average. So that will still take a significant move from where we are now…
Into reach for Clinton
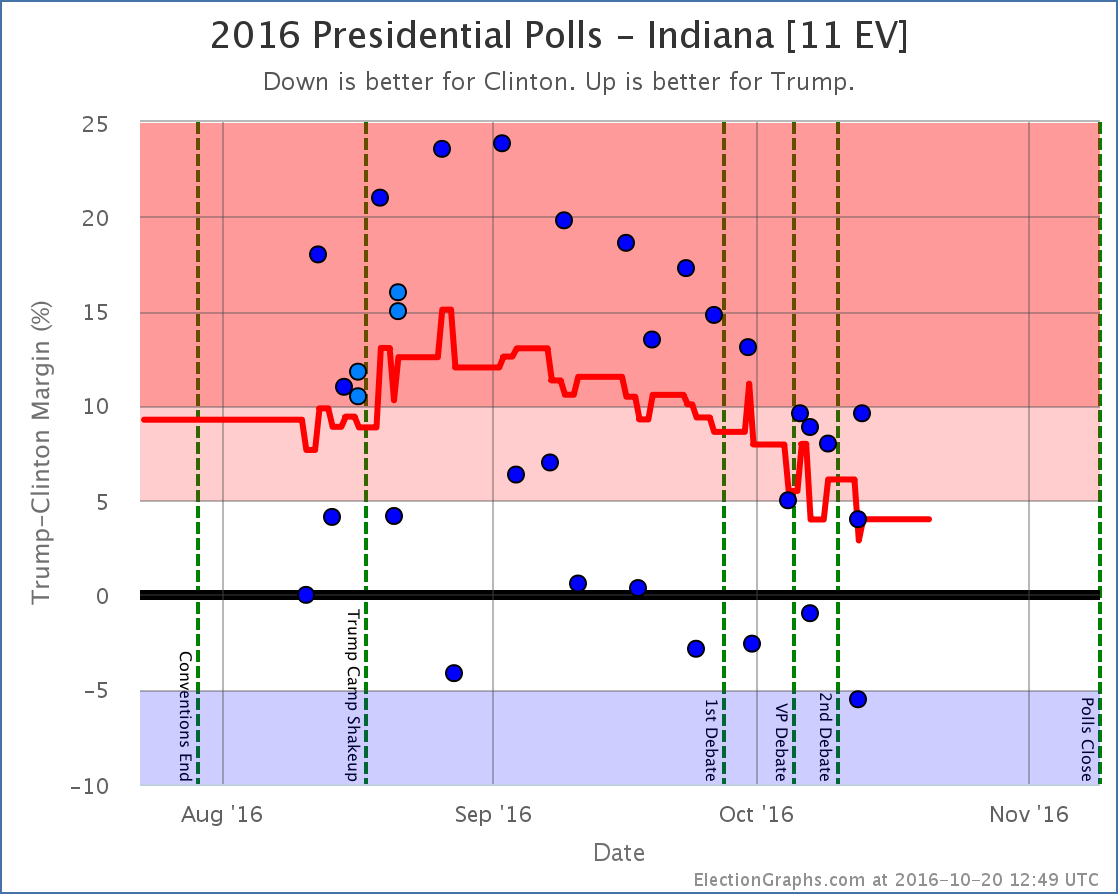
The Election Graphs average now has Trump’s lead in Indiana down to only 4.0%. This puts it in the “Weak Trump” category. I’m not sure I really believe this though. This is pulled downward by two Google polls showing Clinton actually leading in Indiana, which are outliers compared to the rest of the Indiana results. Without Google, the average would be Trump leading by 8.0%. Indiana is closer than it was a few months ago. It HAS been trending slowly away from Trump. But take Indiana as a swing state with a dose of salt until non-Google polls show it there too.
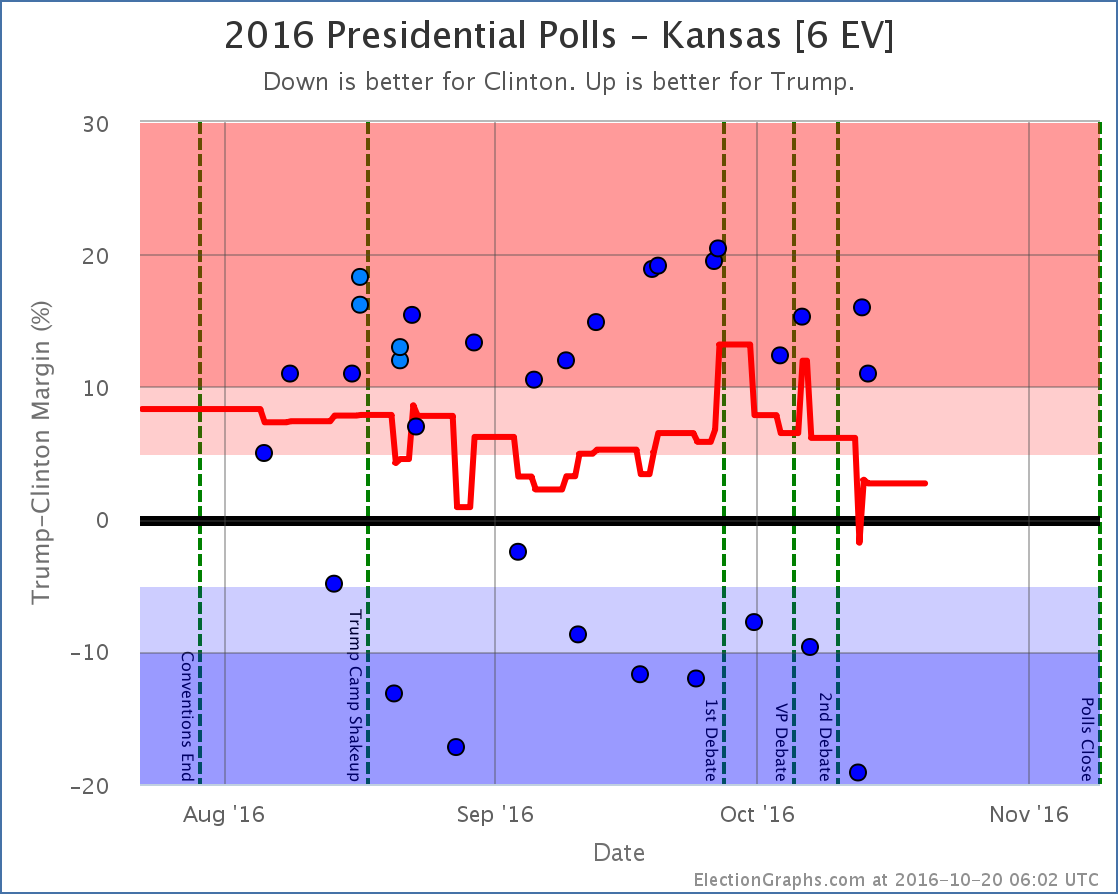
Use the rest of your salt for Kansas, and for the same reason. Google. Without the Google polls, the average in Kansas would not be Trump by 2.7%, it would be Trump by 15.0%. Kansas is lightly polled, so Google has an outsized influence. And the Google results are WAY off from what any other pollster has seen.
Also impacted the tipping point
A note about McMullin
In the last week or two McMullin has spiked in Utah. Some individual polls now even show him leading in Utah. All of the current Election Graphs metrics and charts operate under the assumption that no third party has a realistic shot at winning electoral votes. I have had the outline of a contingency plan on how to modify the site to accommodate 3rd parties that might win electoral votes for months, but activating it would take quite a lot of time and effort. If a 3rd candidate had gotten to that position a month or two ago, the site would definitely have been revamped to adjust for that possibility. As it is, there realistically is no longer time to do that before election day.
Right now the Real Clear Politics average in Utah has McMullin 6.4% behind the lead. The 538 average in Utah has him 11.1% behind the lead. If/when McMullin is within 5% according to either of these averages, I will add notes to both the Utah and National pages talking about the possibility of McMullin winning Utah’s 6 electoral votes, but I probably won’t try to revamp the site to change absolutely everything to account for the possibility. I’ll try to have something ready for 2020 just in case though. :-)
For more information…
This post is an update based on the data on ElectionGraphs.com. Election Graphs tracks a state poll based estimate of the Electoral College. All of the charts and graphs seen in this post are from that site. Additional graphs, charts and raw data can be found there. Follow @ElectionGraphs on Twitter or like Election Graphs on Facebook to see announcements of updates or to join the conversation. For those interested in individual general election poll updates, follow @ElecCollPolls on Twitter for all the polls as they are added. If you find the information in these posts interesting or useful, please consider visiting the tip jar.
[Blog Post] Electoral College: Trump improves a bit more https://t.co/AIaT7E6MfJ
RT @ElectionGraphs: [Blog Post] Electoral College: Trump improves a bit more https://t.co/AIaT7E6MfJ
The Emerson UT poll also included McMullin at 31.3%. See note on how @ElectionGraphs is handling McMullin here: https://t.co/KnZB92VzfZ
The UtahPolicy UT poll also included McMullin at 29%. See note on how @ElectionGraphs is handling McMullin here: https://t.co/KnZB92VzfZ