States with new poll data added since the last update: All 50 states, DC, and the Maine congressional districts
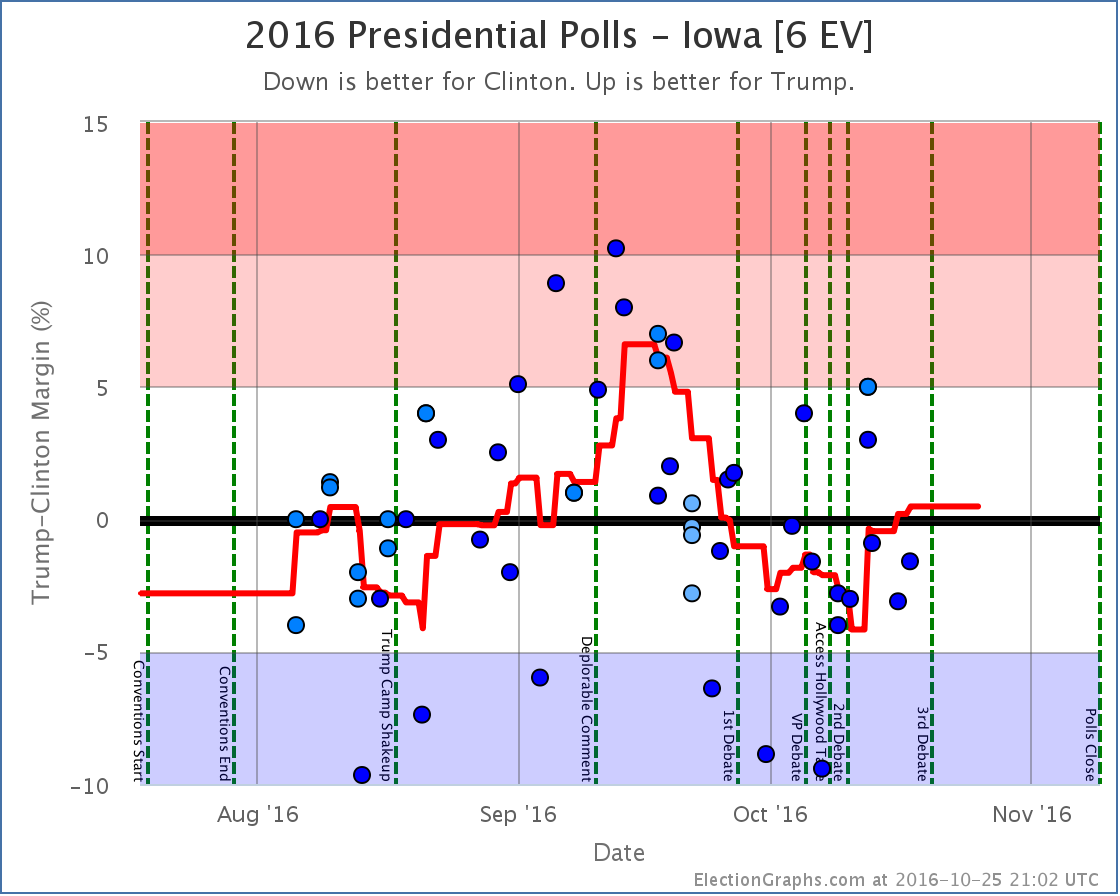
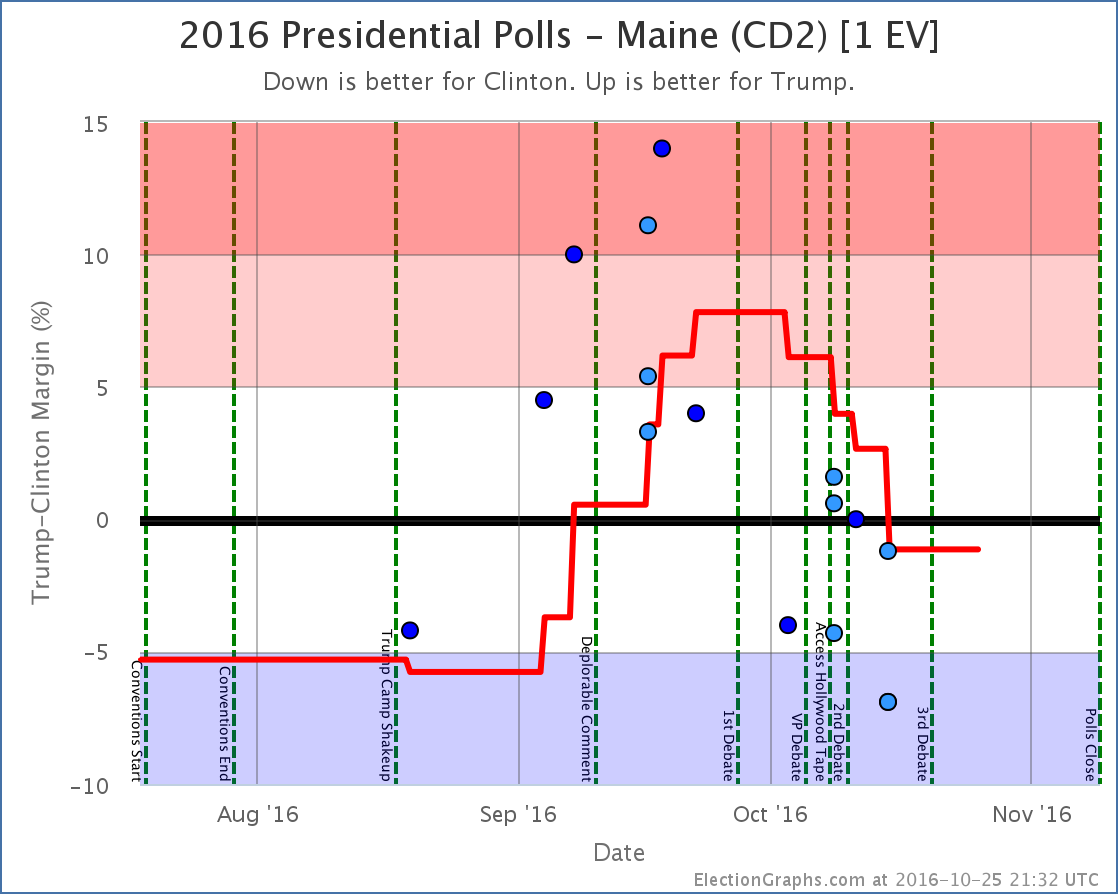
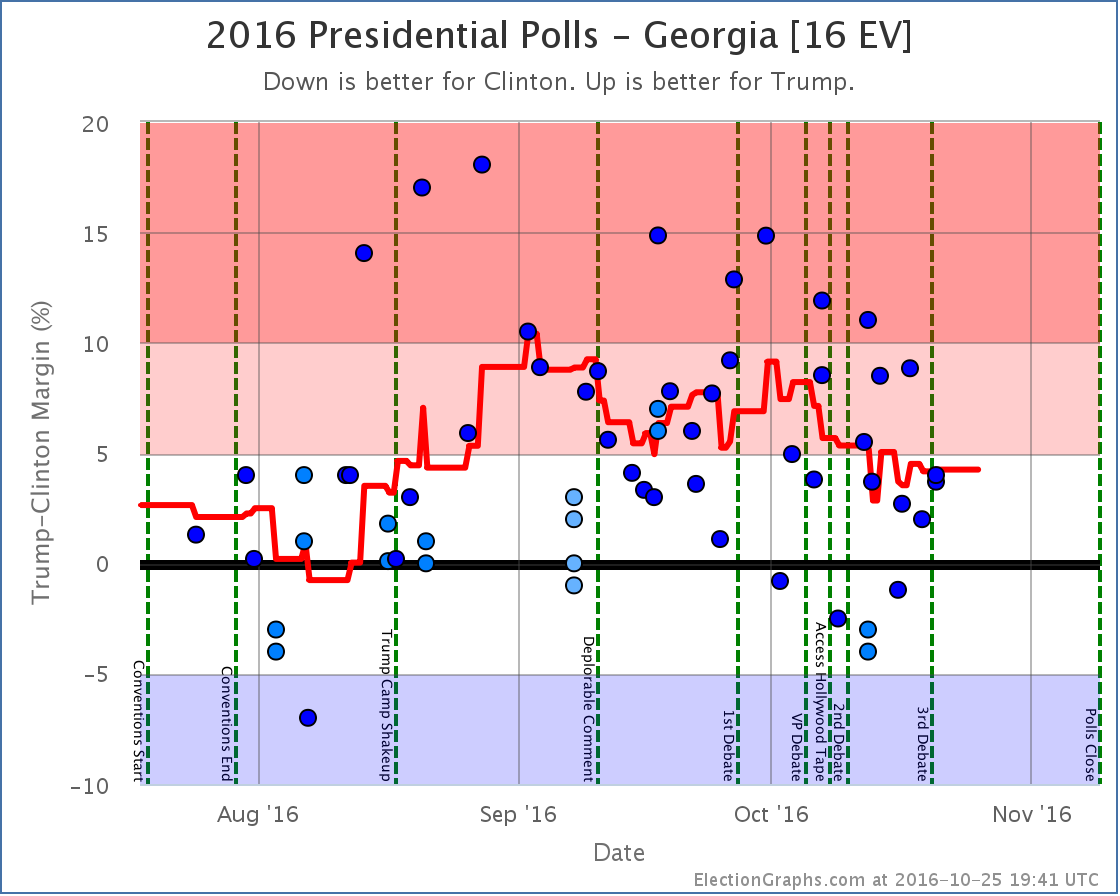
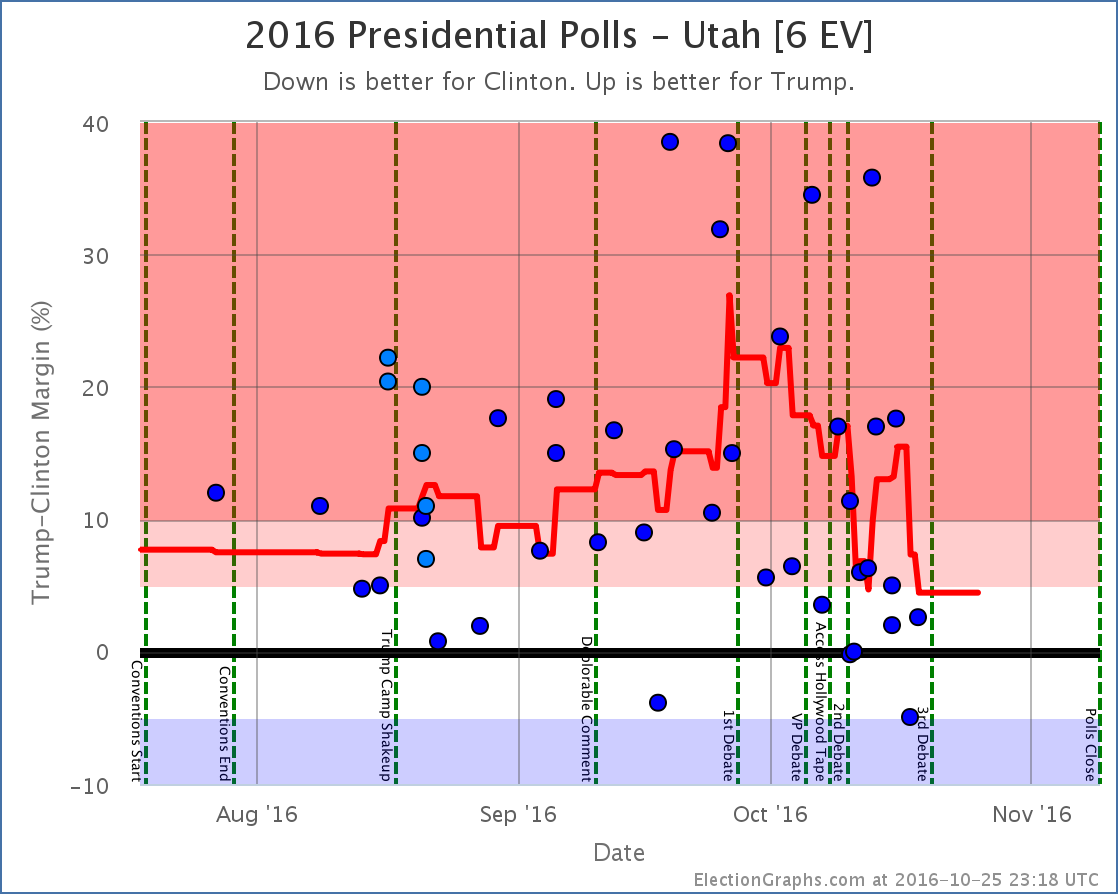
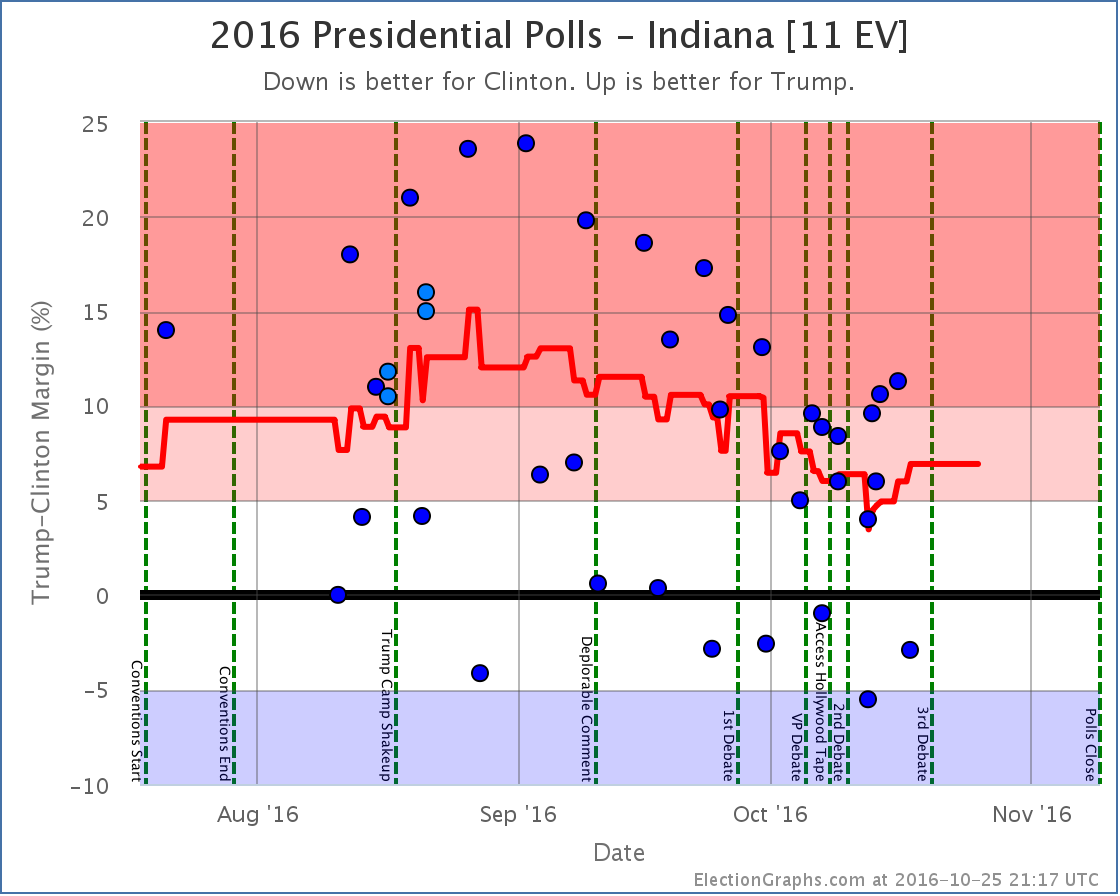
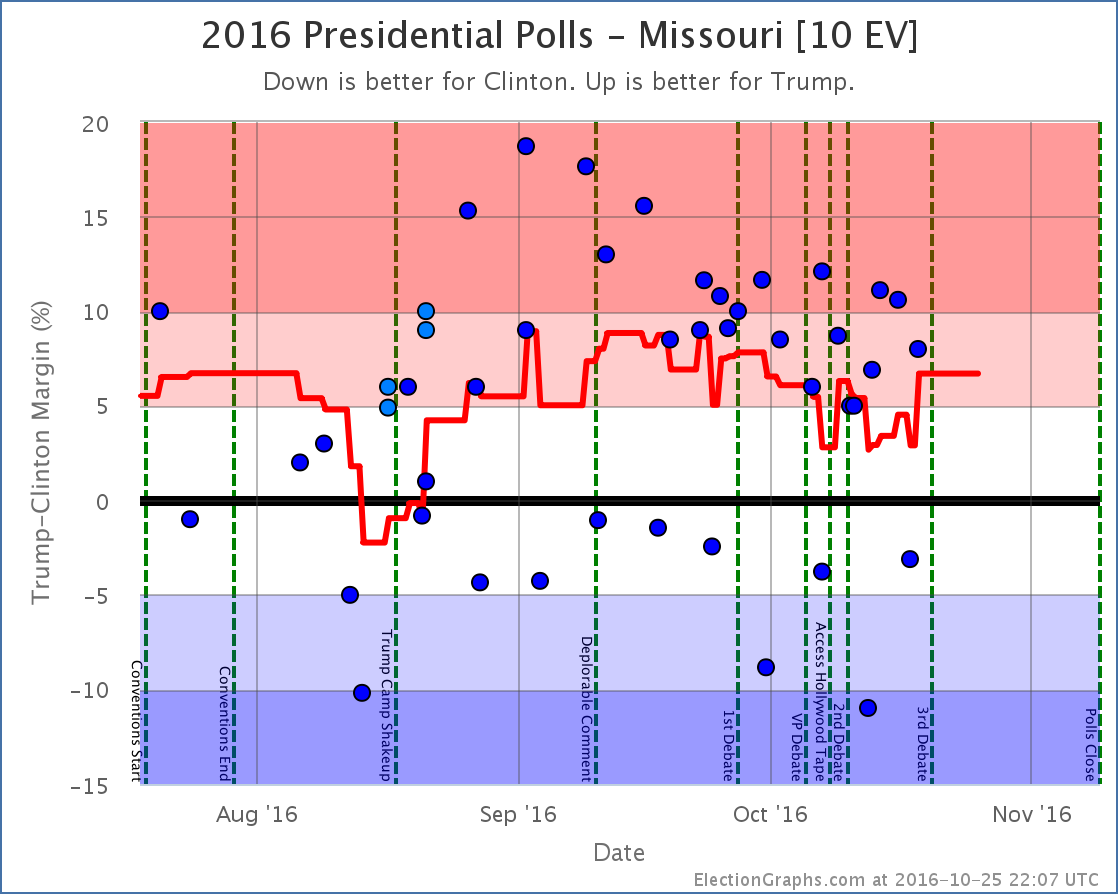
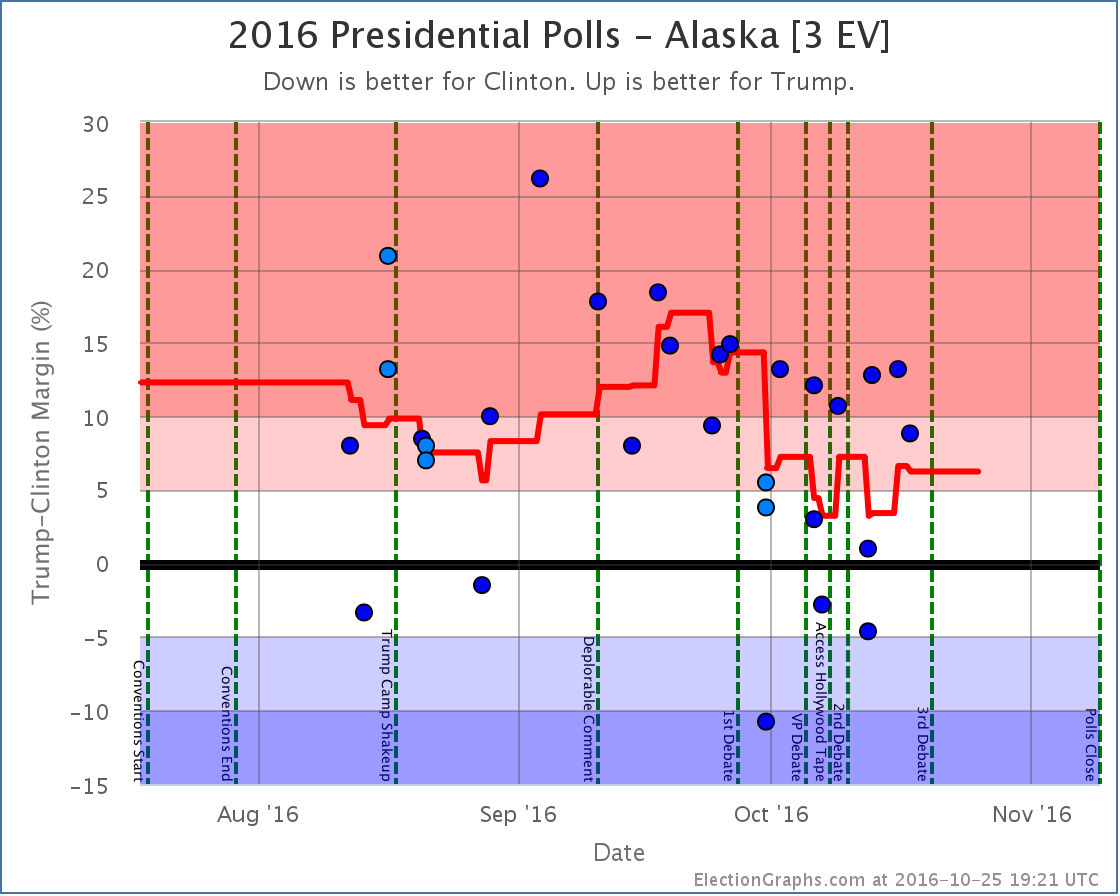
Notable changes in: Iowa, Georgia, Utah, Alaska, Indiana, Missouri, Maine (CD2), and the tipping point
National Summary
It has been about six days since my last update and the trend since then has been toward Trump. Here are the stats:
Good for Trump:
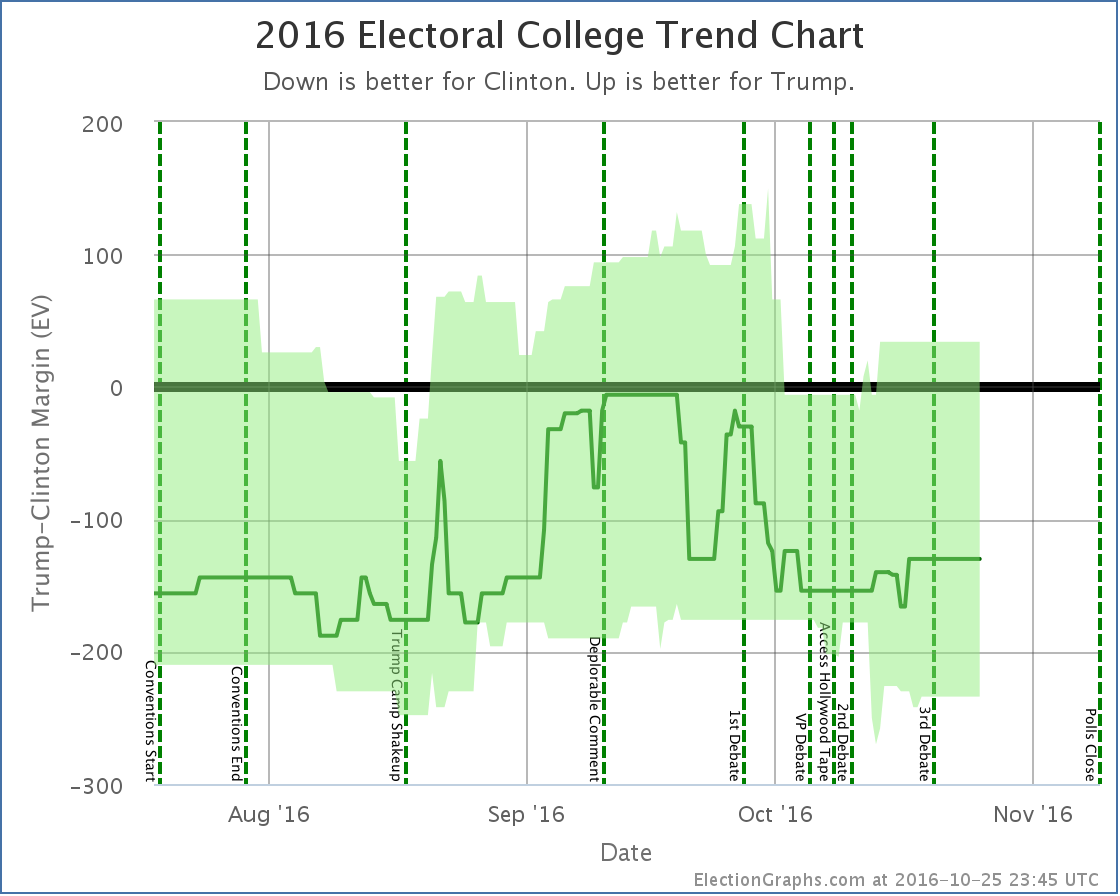
- The expected result changed from a 140 EV Clinton win to a 130 EV Clinton win
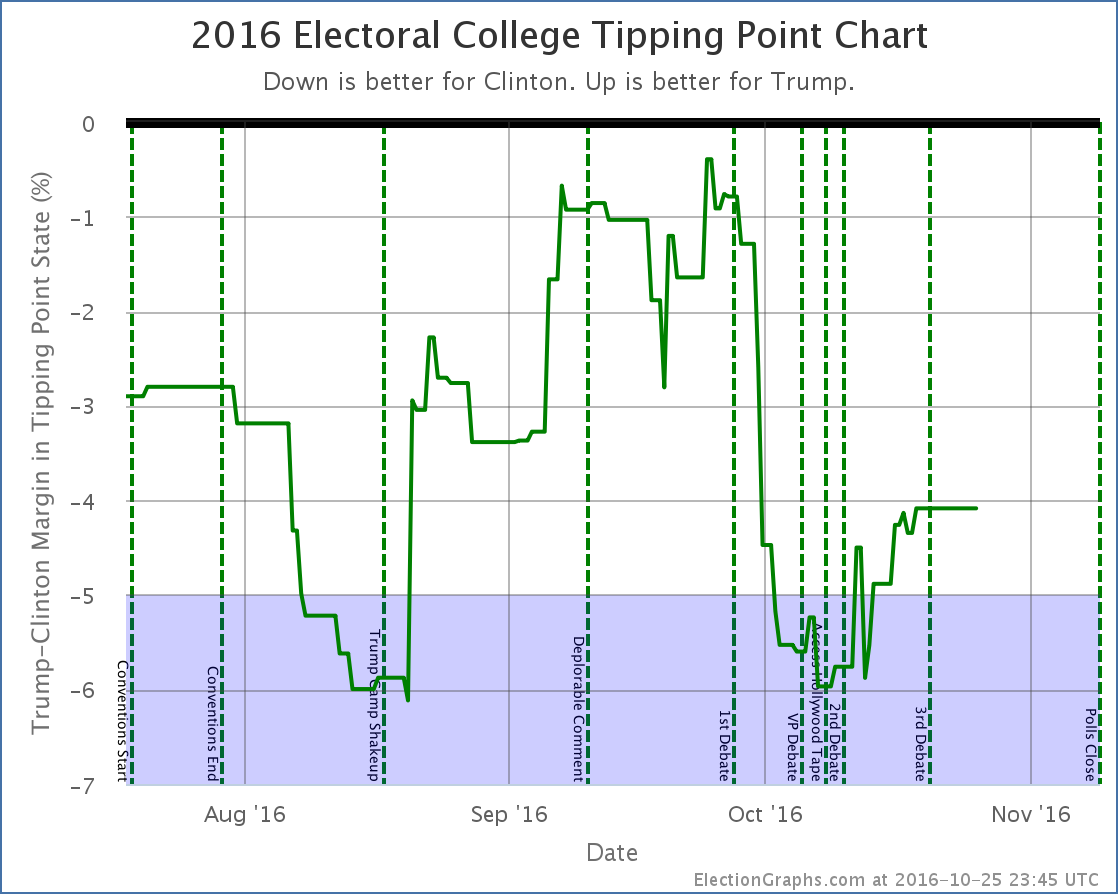
- The tipping point moved from Clinton by 4.9% in PA to Clinton by 4.1% in PA
- Clinton’s best case declined from a 238 EV win to only a 234 EV win
No change
- Trump’s best case remained a 34 EV win
Charts
Discussion
With all the data we have now, looking back to the release of “the tape” on October 7th the overall movement has been mixed. Both candidates have improved their “best cases” as states that were not close have gotten closer… on both sides. So this doesn’t show a move toward one candidate or another, but rather some red states getting less red while simultaneously some blue states got less blue.
Some of the really close states moved across the center line… in both directions… resulting in a net movement of the expected electoral college margin toward Trump by 24 electoral votes… but the most indicative sign of movement toward Trump is actually the tipping point.
Since the release of the tape the tipping point has moved from Clinton leading by 6.0% (in Virginia) to Clinton leading by only 4.1% (in Pennsylvania). So… with some of the worst news cycles for a politician in decades, with day after day after day of negative revelations… Trump improved his position by nearly 2%.
How to interpret this? My best guess… Most people were pretty well set on their Trump vs Clinton choice prior to the reveal of the tapes and the subsequent sexual assault allegations. In the wake of the first debate the part of the public that was persuadable had already swung us from near Trump’s ceiling to near Trump’s floor. With the string of additional bad news, very few die hard Trump supporters moved away from him, while some number of those persuadables viewed this as the press piling on Trump and went back to him thinking this was unfair.
But to be honest, the above is trying to make up a story to fit the numbers. Is it right? I don’t know.
In the end though, the reality is that in the face of a hurricane of bad coverage, Trump has actually improved his position.
Despite the improvement, Trump is still losing by a significant margin, but Trump’s best case does still includes a win.
If he keeps all the states he leads, then flips Arizona, North Carolina, Florida and Pennsylvania, he could still pull out a narrow win. Arizona is close enough it could flip back easily enough. North Carolina and Florida have both been back and forth over the past couple months, so seeing them go red again would not be shocking.
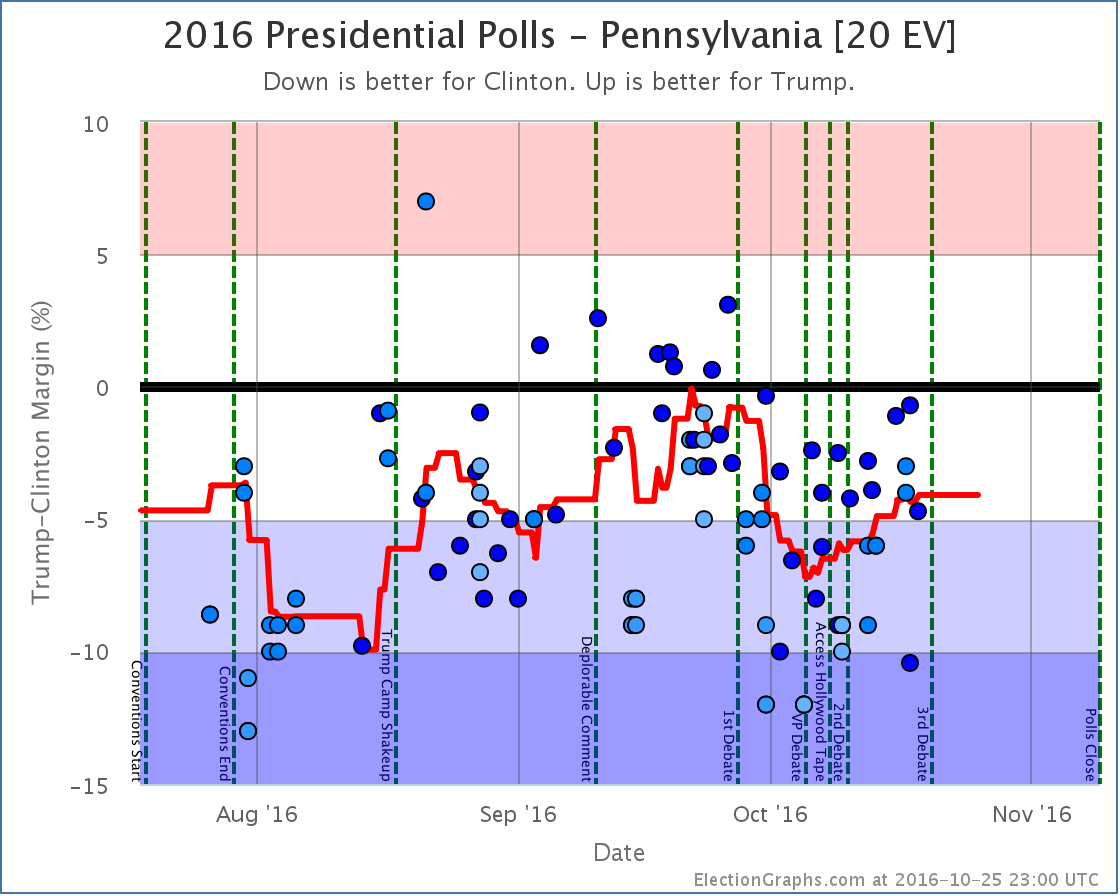
Pennsylvania is the hard pull. While he made it close in September, Trump has never led in Pennsylvania. And Trump needs Pennsylvania to win. Right now, this is Clinton’s firewall.
Clinton would clearly like to be leading in Pennsylvania by more than 4.1%… but even at that margin, it is a tall wall for Trump to climb.
There are 13.7 days left until the first polls close. With less than two weeks left to go now, it is almost certainly too late for Trump to flip all the states he would need to flip in order to win. But if he manages to continue the trend of the last couple of weeks, it is enough time for him to make it close enough that Democrats will start to panic.
State Details
The following are the detailed state charts for states that influenced the status changes since the last update.
Weak Clinton to Weak Trump
Weak Trump to Weak Clinton
Influencing the tipping point
Now possible Clinton pickups
No longer possible pickups for Clinton
A note about McMullin
Election Graphs is designed around showing the Republican – Democrat margin, and there is not enough time before the election to revamp the site to properly account for 3rd parties that are strong enough to have a shot at winning electoral votes.
Right now the Real Clear Politics average in Utah has McMullin 5.5% behind the lead. The 538 average in Utah has him 8.5% behind the lead. If/when McMullin is within 5% according to either of these averages, I will add notes to both the Utah and National pages about the possibility of McMullin winning Utah’s 6 electoral votes.
For more information…
This post is an update based on the data on ElectionGraphs.com. Election Graphs tracks a state poll based estimate of the Electoral College. All of the charts and graphs seen in this post are from that site. Additional graphs, charts and raw data can be found there. Follow @ElectionGraphs on Twitter or like Election Graphs on Facebook to see announcements of updates or to join the conversation. For those interested in individual general election poll updates, follow @ElecCollPolls on Twitter for all the polls as they are added. If you find the information in these posts interesting or useful, please consider visiting the tip jar.
[Blog Post] Electoral College: Trump improving, but not enough https://t.co/78ACReIFYz
RT @ElectionGraphs: [Blog Post] Electoral College: Trump improving, but not enough https://t.co/78ACReIFYz
RT @abulsme: [Blog Post] Electoral College: Trump improving, but not enough https://t.co/TDSkba9PXn
Rebecca Hersh liked this on Facebook.
Brittany Hollenbaugh liked this on Facebook.