This is the website of Abulsme Noibatno Itramne (also known as Sam Minter).
Posts here are rare these days. For current stuff, follow me on Mastodon
|
New Hampshire’s delegate rules are such that the winner gets a big bonus. (The details of how this works were discussed here last week.) So Trump’s approximately 36% of the vote turns into 55% of the delegates. Counting isn’t actually done yet, but if current trends hold, the delegate haul out of New Hampshire will be:
Trump 11, Kasich 3, Bush 2, Cruz 2, Rubio 2.
Adding these to the previous results in Iowa, and we have these new totals: Trump 18, Cruz 10, Rubio 9, Kasich 4, Bush 3, Carson 3, Fiorina 1, Huckabee 1, Paul 1.
In the form of a graph of the total delegates, we see this:
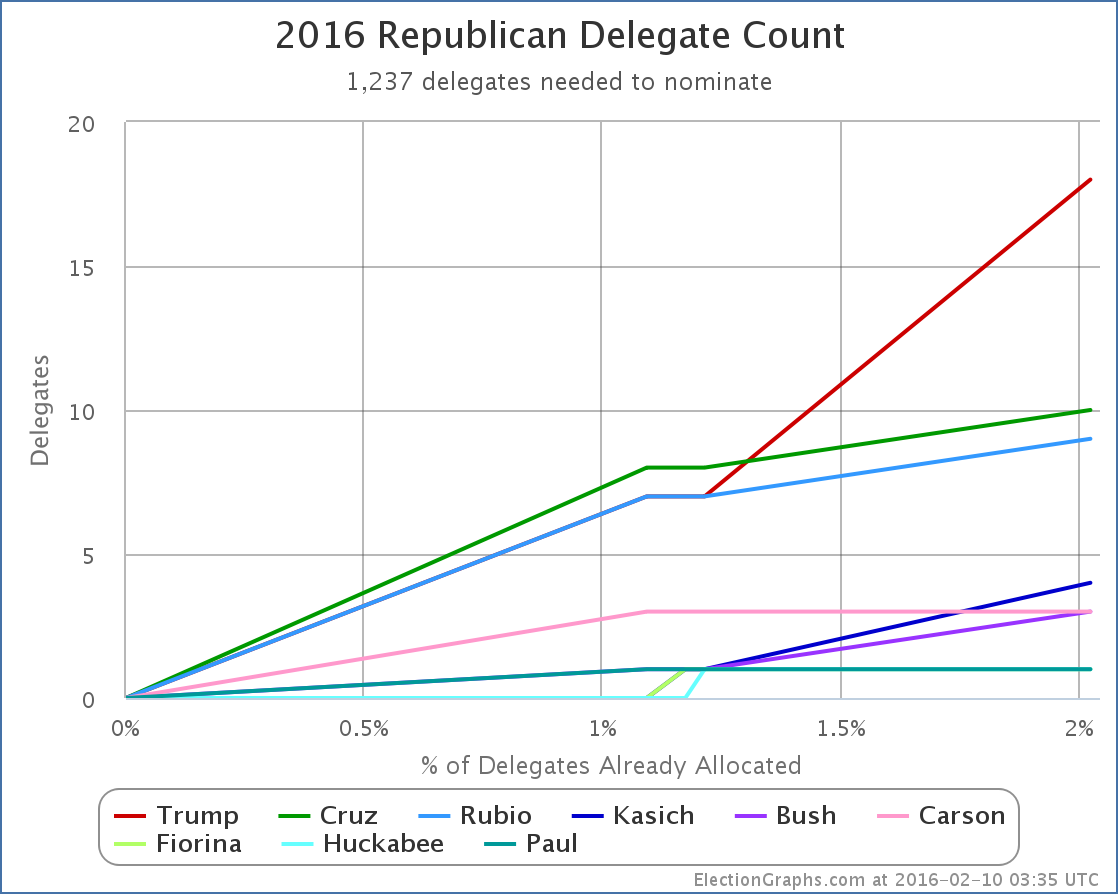
Some groupings look apparent on this chart.
Trump is out by himself in the lead.
Cruz and Rubio make up a second tier, at about half of Trump’s level.
Kasich, Bush and Carson are the third tier. Way behind, but at least with multiple delegates.
Then finally Fiorina, Huckabee and Paul bringing up the rear with one delegate each. Two of these three have already dropped out. It will be surprising if the third does not do so soon.
How does this match what we’re hearing in the spin out of New Hampshire? Well, there is wide acknowledgment that Trump did have a nice win. But the majority of the attention still seems to have been on the race for second, and how that positions the anti-Trumps going forward.
Within that, relatively little attention was paid to Cruz, and he is still in 2nd. Rubio is being dismissed because he did badly in New Hampshire, but he is still in 3rd over all. Meanwhile lots of attention given to Kasich and Bush, but they are still stuck in the third tier with Carson with less than a handful of delegates.
Time to flip this and look at this in terms of my favorite metric, the “% of remaining needed to win”:
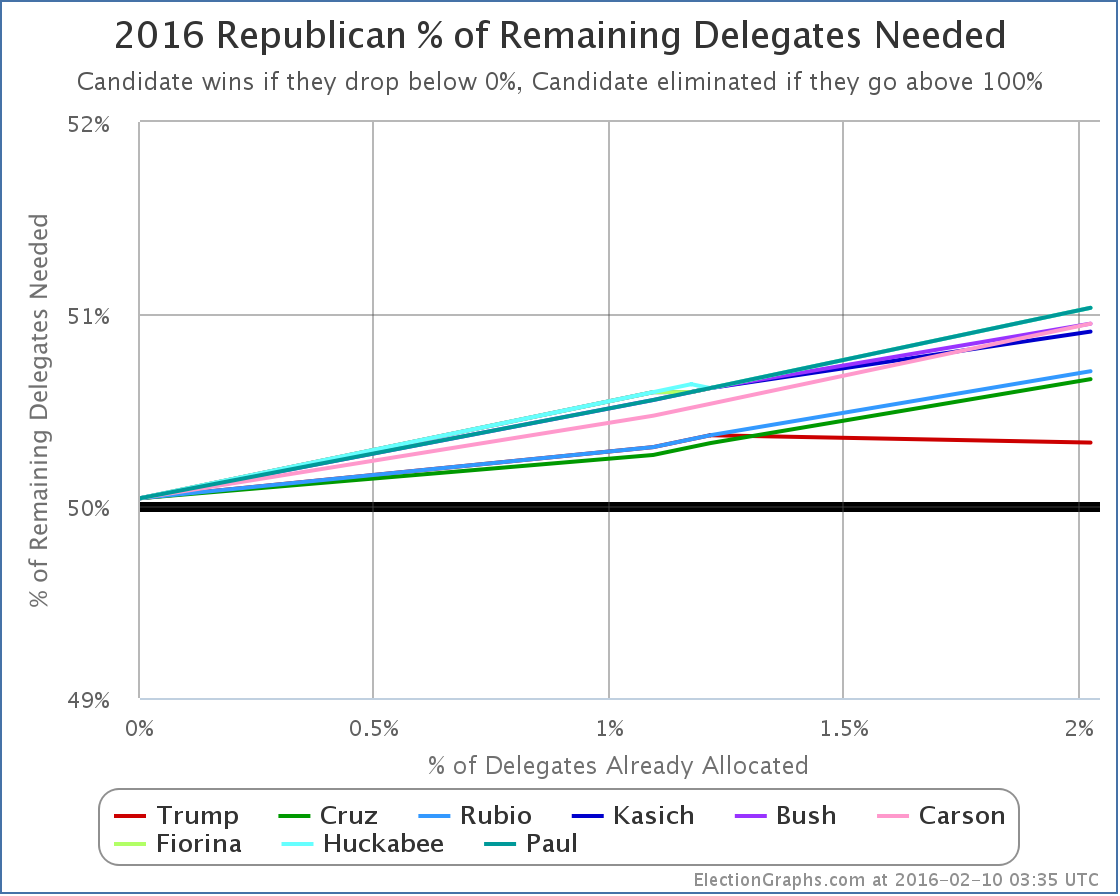
Trump exceeded the 50.37% of the delegates he needed to get to improve his position. Going forward he needs 50.33% of delegates to be on a pace to win. That is a relatively small change. With almost 98% of delegates still to be determined, there is a huge amount of flexibility available here to all the candidates.
Given that Trump got 55% of the delegates in New Hampshire, that means however that NONE of the other candidates got what they needed, or even close. Essentially, every one of the non-Trump candidates fell further behind today.
Now, Trump still doesn’t have a majority of delegates. To be on a pace to actually win, rather than just to have the most delegates going into the convention, he needs to do better than he has so far. But he is far closer to that mark than any of the other candidates. And if he continues matching his New Hampshire results, he will win.
The story here continues to be that while Trump hasn’t managed a majority in any contest so far, the opposition is so divided that Trump still easily wins (New Hampshire) or at the very least comes very close (Iowa). Does this continue? Does it get worse?
Time to look at the next contest on the Republican side, South Carolina.
There have not been any South Carolina polls since before Iowa, so new polls are eagerly anticipated, but at the moment the RCP average has Trump at 36.0%, Cruz at 19.7%, Rubio at 12.7%, Bush at 10.0% and then everybody else.
Now, that may change. Specifically if either Rubio or Bush drop out that will scramble things a bit. But that may not happen. There is a case to be made for both of them sticking in at least through South Carolina.
Trump probably wins this. But by how much? Time to look at the delegate rules in South Carolina.
From Greenpapers:
- 21 district delegates are to be allocated to presidential contenders based on the primary results in each of the state’s 7 congressional districts: each congressional district is assigned 3 National Convention delegates and the presidential contender receiving the greatest number of votes in that district will receive all 3 of that district’s National Convention delegates. [Rule 11(b)(4)]
- 26 (10 base at-large delegates plus 16 bonus delegates) at-large delegates are to be allocated to the presidential contender receiving the greatest number of votes in the primary statewide. [Rule 11(b)(5)]
- 3 party leaders, the National Committeeman, the National Committeewoman, and the chairman of the South Carolina’s Republican Party are pledged to the presidential contender receiving the greatest number of votes in the primary statewide.
If Trump wins by any margin, no matter how small, he gets 29 of the 50 delegates right up front. That already would give him 47 of the 100 delegates that would have been allocated in Iowa + New Hampshire + South Carolina.
Of course, in order to win the whole state, he would have had to have won some of the congressional districts too. Probably most of them. And so far in Iowa and New Hampshire, it doesn’t seem like there has been a lot of geographic lumpiness to Trump’s support. So he may well win ALL of the congressional districts. In that case Trump would walk out of South Carolina with all 50 of the available delegates. This is very possible.
In that scenario, after South Carolina, the overall delegate count would look like: Trump 68, Cruz 10, Rubio 9, Others 13
Trump would have a huge delegate lead. Even if he doesn’t win all 50, he will still have a very large delegate lead.
Nevada is three days after South Carolina. It is proportional, not semi-winner-take-all like South Carolina, but the latest polls still have Trump with a nice lead in Nevada. Those polls are old and out of date, but does anybody think two straight wins would hurt Trump’s position?
To “stop Trump” things have to move very quickly to a one on one with Trump vs Somebody. Maybe a three way race could do it, but might just be a recipe for a contested convention. But as long as we’re still looking at four or five candidates splitting the non-Trump vote, Trump wins.
But the non-Trumps still seem to be in a locked battle with each other for that anti-Trump one on one slot. And in doing so, they just let Trump win. The race will of course consolidate further. More candidates will drop out. Some may drop out before South Carolina. But it is unclear if that will be enough to let one of the others actually win in South Carolina.
Trump won New Hampshire. Trump looks like he will probably win the next two states. Things get more complicated once we get into March, but Trump would get there with a substantial lead.
Things are by no means settled yet. There is a long way to go. Even after we get past both South Carolina and Nevada 94.6% of delegates will still be up for grabs. There will still be time for the non-Trumps.
But if we only get consolidation down to 2 or three candidates after the March 1st contests, when 25.8% of the total delegates will be decided, the non-Trumps that are left may have a really tough uphill fight to catch up.
If consolidation doesn’t happen until after March 15th, 60% of the delegates will already have been decided, and it may just be too late. (Although if several non-Trumps are still strong at that point and Trump has the lead but not a majority, we’re looking at a contested convention, and that starts getting into completely different scenarios.)
But if the non-Trumps want to actually win, they have to stop fighting each other, some of them have to drop out, and they have to actually act like Trump is the frontrunner, and that their priority has to be bringing him down rather than each other. Otherwise they are done, and Trump ends up walking away with this.
Note: This post is an update based on the data on ElectionGraphs.com. Election Graphs tracks both a poll based estimate of the Electoral College and a numbers based look at the Delegate Races. All of the charts and graphs seen in this post are from that site. Additional graphs, charts and raw data can be found there. All charts above are clickable to go to the current version of the detail page the chart is from, which may contain more up to date information than the snapshots on this page, which were current as of the time of this post. Follow @ElectionGraphs on Twitter or like Election Graphs on Facebook to see announcements of updates or to join the conversation. For those interested in individual general election poll updates, follow @ElecCollPolls on Twitter for all the polls as they are added.
Lets jump right to it. In the last Democratic update we mentioned that to actually improve the “% of remaining needed to win” Sanders needed to get 54.36% of the delegates available in New Hampshire. That would be 14 out of 24 delegates that were available today. He got 15 out of 24, or 62.5% of yesterday’s delegates. So he did it!
In addition, since my last update, there were some superdelegate changes. The net change from those was +1 Clinton, +1 Sanders. There was also a net reduction of 1 available delegate, bringing the total number of Democratic delegates down to 4,763.
With all of that in place, here is the new chart for “% of remaining needed to win”:
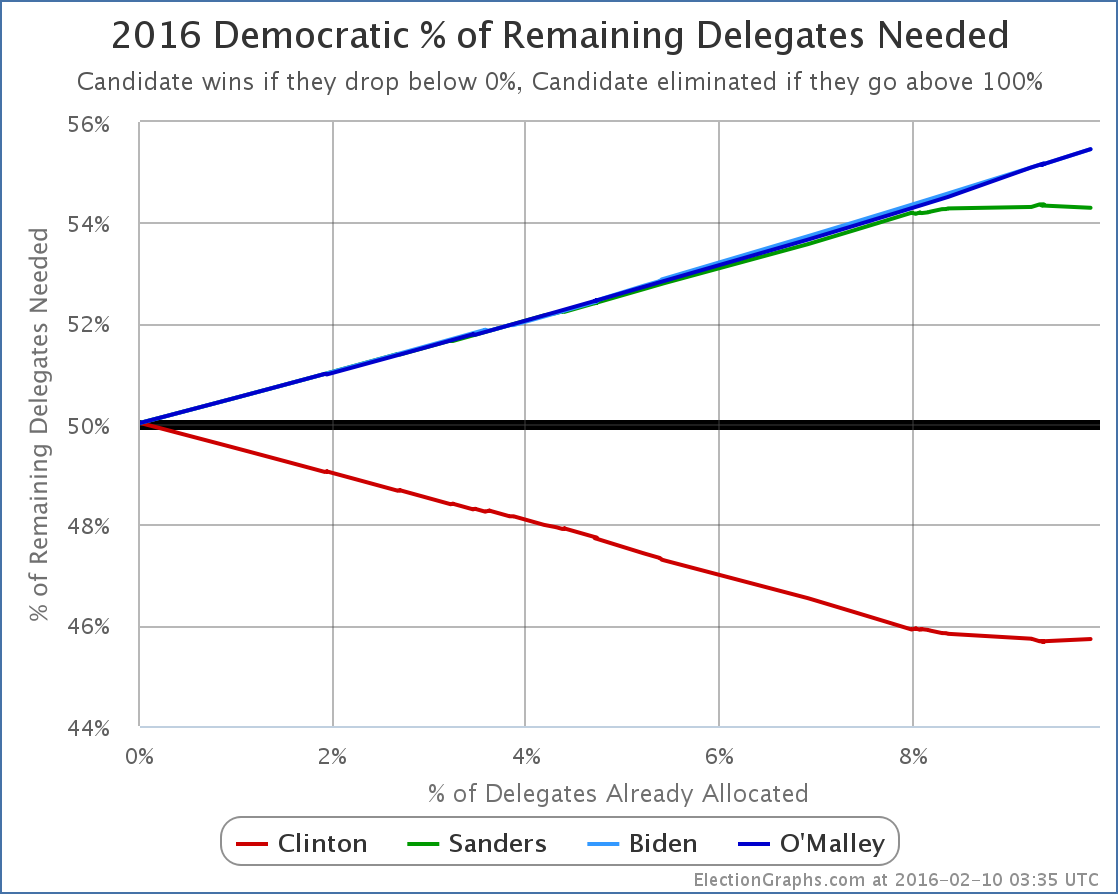
The Sanders % Needed has indeed gone down, and he made Clinton’s go up!
Sanders’ % Needed specifically moved from 54.36% to… 54.30%.
This was at 54.22% before Iowa. 54.30% matches where this was right after Iowa.
So, Sanders did improve his situation, but only enough to undo the superdelegate changes that happened after Iowa, not enough to get back even to where he was before the voting started.
Another way to look at this is to just look at New Hampshire itself. Of delegates allocated by the Primary, Sanders got 15 delegates to Clinton’s 9. But New Hampshire also has 8 superdelegates, and 6 of these had already declared for Clinton.
So the actual New Hampshire total as of today is 15 Clinton, 15 Sanders, 2 TBD.
So even with his big win, which was indeed a big win, Sanders actually has only pulled even in delegates in the state.
Now, of course, superdelegates can change their mind. It has been said that if one candidate was clearly leading absent superdelegates, the superdelegates would not go against them, and would start to change their minds and flip to the candidate leading in non-super delegates. Maybe. It could happen. And if it does, that movement will be tracked here. Certainly no such movement has been seen yet.
In the mean time, next up for the Democrats is Nevada on February 20th. Nevada often gets relatively little attention compared to South Carolina, but Nevada will actually be the next place where we see if Sanders is able to take his New Hampshire results and build anything longer term out of it.
Nevada is a caucus state, so delegates won’t actually be allocated on the 20th, but there will be results that can be used to estimate convention delegates. Nevada has 43 delegates. Of those 8 are superdelegates. Clinton already has 3 superdelegates in her column, Sanders has 1. Nevada’s caucuses will determine 35 delegates. 23 will be allocated based on results in the 4 congressional districts, 12 will be allocated based on the state wide results.
To once again have a result that keeps him on pace to catch up to Clinton and win, Sanders needs to get 20 of the 35 delegates available on caucus day, assuming no additional superdelegate declarations or other adjustments between now and then.
At the moment, Nevada poll averages show Clinton leading 50.0% to 30.5%… but there has been no polling there since December. Expect a variety of new polls in the next week. Watch them carefully. For Sanders to be on track, these numbers have to flip… and then Sanders has to build an even larger lead.
In South Carolina, a week after Nevada, Clinton is even further ahead, although again polls there are stale and new ones taken post-Iowa post-New Hampshire are eagerly awaited.
Between now and Nevada, and probably between now and South Carolina, there will be almost non-stop talk about Sanders’ threat to Clinton, how Clinton is a lot weaker than expected, how vulnerable she is. A lot of this is true. To a degree.
But to evaluate if Sanders is actually a threat to Clinton eventually taking the nomination, as opposed to just being a temporary speed bump in her way, Sanders has to not only take the lead in Nevada, South Carolina and beyond, but be ahead by a significant margin, not just a little bit. This is a tall order. Maybe it is possible.
But if there is talk about how Sanders is “closing the gap” or “making it closer than expected” in Nevada or South Carolina, keep in mind that isn’t enough. He needs to actually win and win by a large enough margin to get more than 54.30% of the delegates to be on pace to catch up and win. Otherwise, the task in later states just becomes even harder.
Note: This post is an update based on the data on ElectionGraphs.com. Election Graphs tracks both a poll based estimate of the Electoral College and a numbers based look at the Delegate Races. All of the charts and graphs seen in this post are from that site. Additional graphs, charts and raw data can be found there. All charts above are clickable to go to the current version of the detail page the chart is from, which may contain more up to date information than the snapshots on this page, which were current as of the time of this post. Follow @ElectionGraphs on Twitter or like Election Graphs on Facebook to see announcements of updates or to join the conversation. For those interested in individual general election poll updates, follow @ElecCollPolls on Twitter for all the polls as they are added.
In my update today I added polling data from Quinnipiac (7 candidate combinations in Florida, Ohio and Pennsylvania), Gravis (5 candidate combinations in Nevada), and Saint Leo (5 candidate combinations in Florida). This resulted in a variety of status changes, but only a handful that meet my threshold for talking about here, which is that either the electoral college summary or the tipping point needs to change for one of the five best polled candidate pairs.
First off, there has been very little polling in Nevada thus far, but the new polling in Nevada moved both Clinton vs Paul and Clinton vs Christie from “Weak Clinton” to “Strong Clinton” as the polling average moved to a greater than 5% Clinton lead. They join Clinton vs Bush, which was already in that zone. (Clinton vs Huckabee and Ryan, the other two of the top five best polled candidate combinations, have not been polled at all in Nevada.)
So here’s what Paul’s electoral college trends look like at the moment vs Clinton:
And here’s Christie vs Clinton:
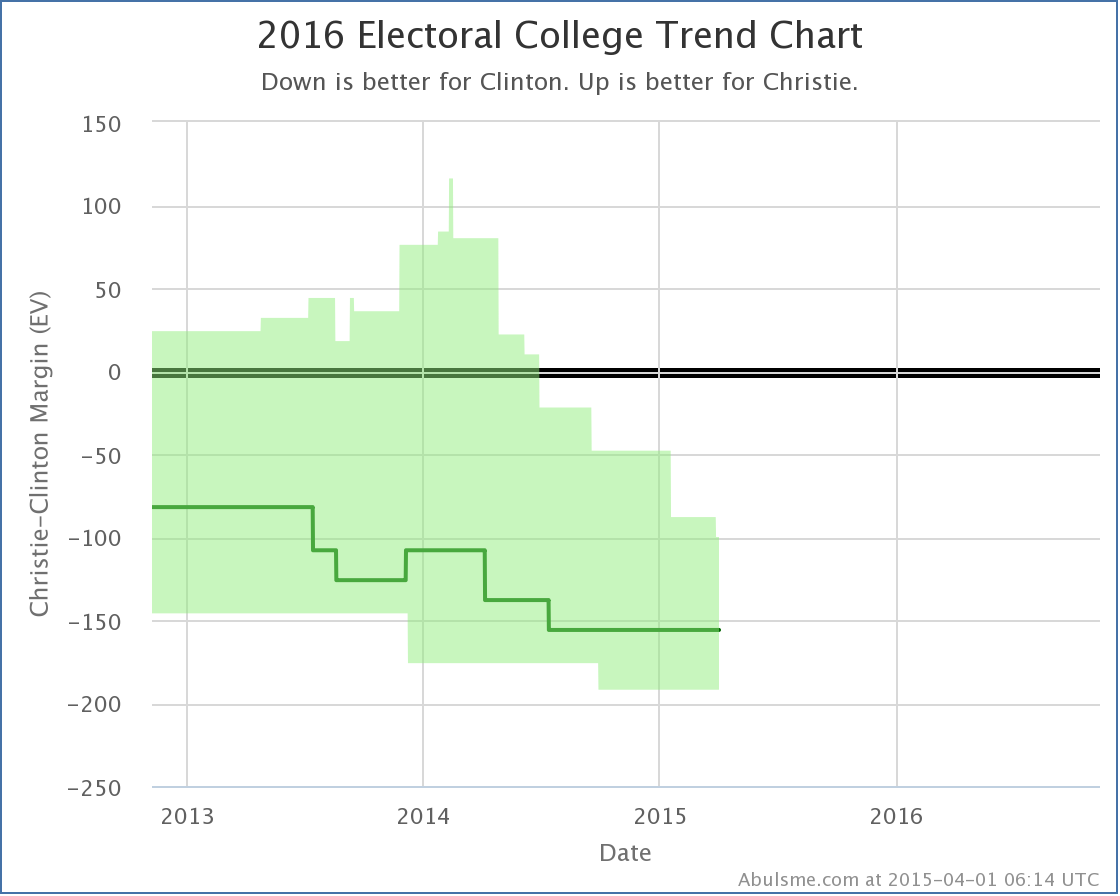
In both of these, you can see the slight dip at the top right of the “envelope of possibility” representing Nevada no longer being included in the “best case” for the Republican.
The moves mentioned above for Nevada are the only two cases in today’s updates where the actual electoral college summaries changed. (Well, of the top five best polled candidate combinations anyway.)
But we’ll also mention it here if there are changes to the tipping point margin. As a reminder, the tipping point margin is basically how much you would have to shift the results in ALL states in order to change the electoral college winner. Basically, it is like looking at the national popular vote, but taking into account the structure of the electoral college, so you’re looking at how much things have to move to change the electoral college outcome, not just the winner of the popular vote. (Which as 2000 showed, do not necessarily go together.)
So, those changes…
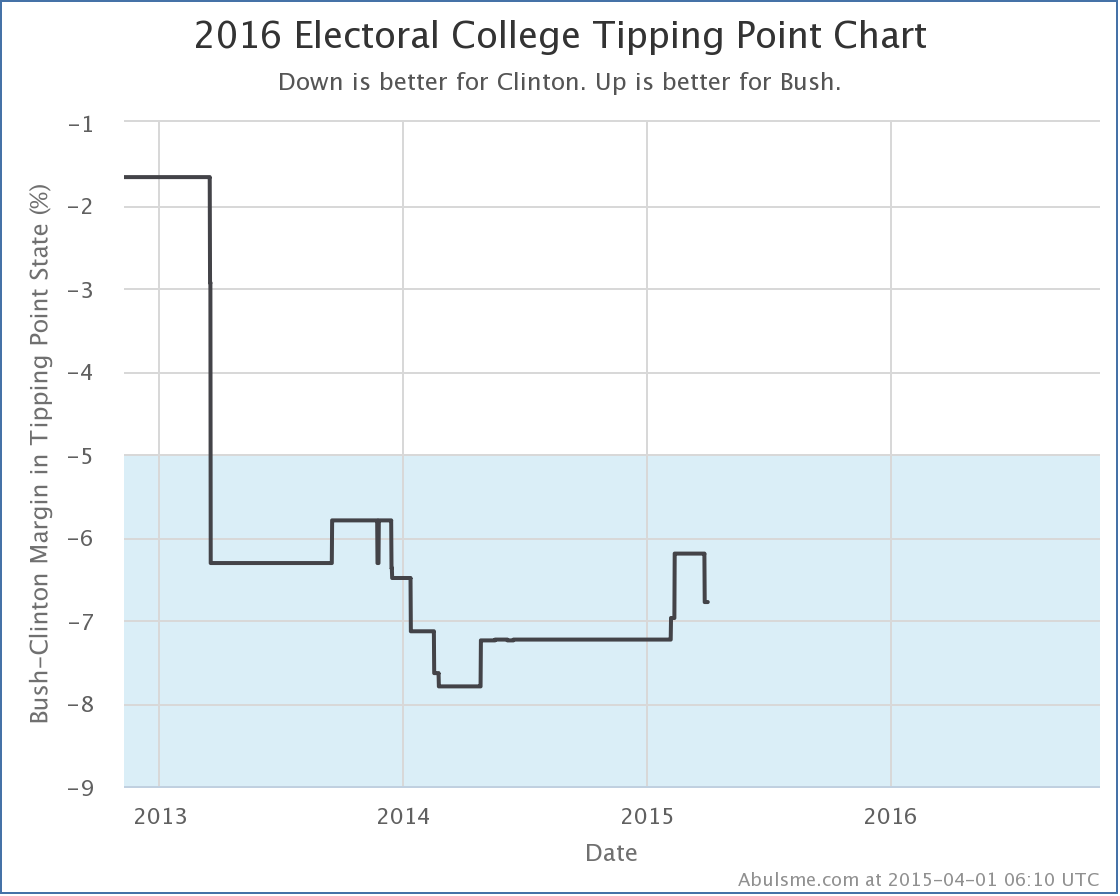
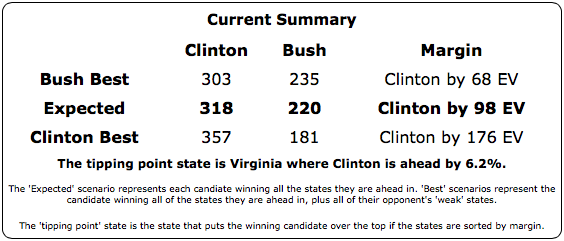
First off Clinton vs Bush. With today’s added polling and Nevada getting bluer, the tipping point moves from Clinton by 6.2% in Virginia, to Clinton by 6.8% in Minnesota.
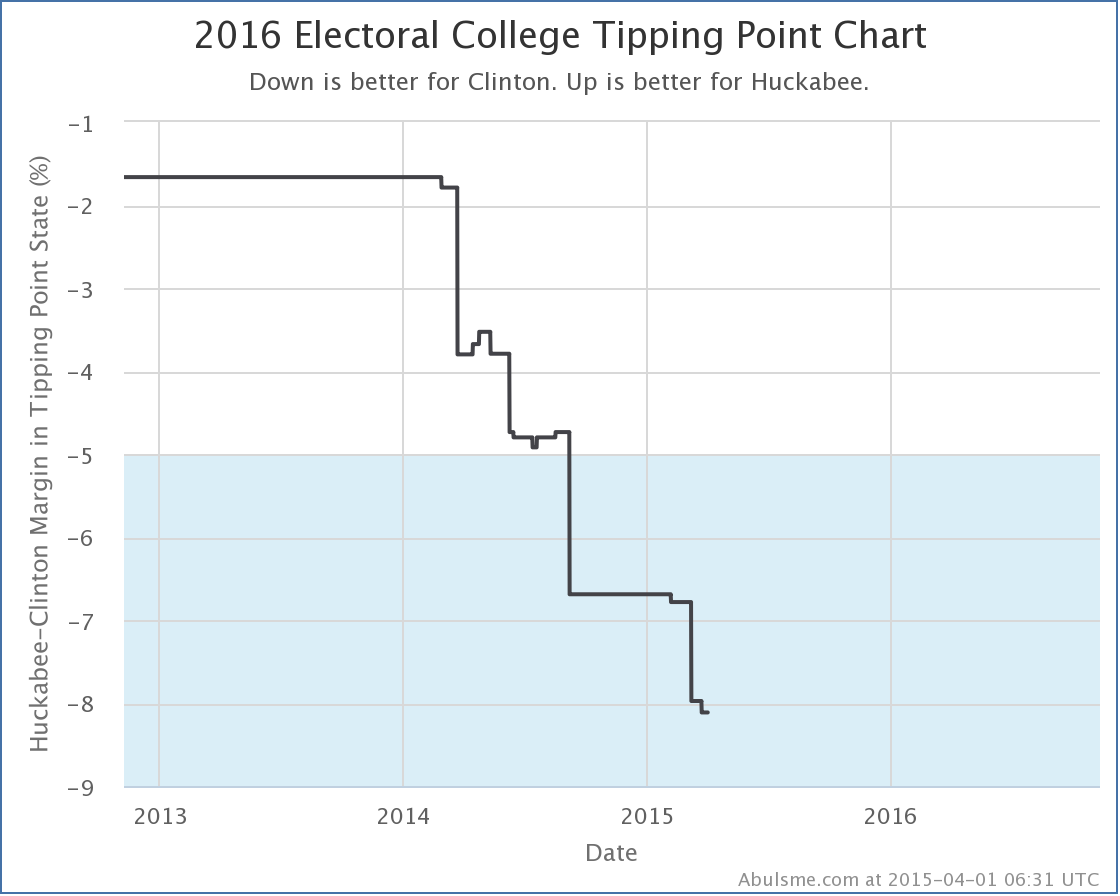
Then Clinton vs Huckabee. Ohio moves further toward Clinton, and the topping point shifts from Clinton by 8.0% in Virginia, to Clinton by 8.1% in Ohio.
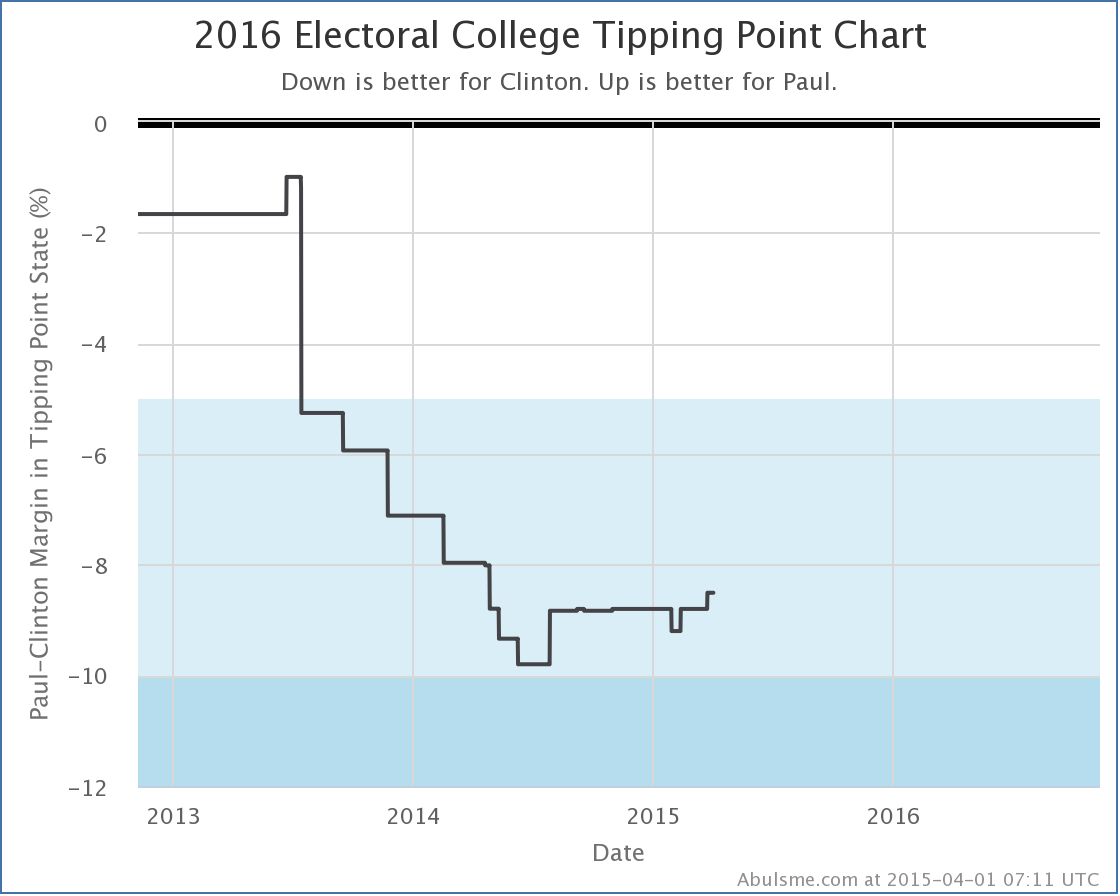
Finally, the one move in the directions of the Republicans today. Ohio moved in Paul’s direction with todays update… the poll average went from a 9.2% Clinton lead to a 7.6% Clinton lead, which was enough to move the tipping point from Clinton by 8.8% in Virginia to Clinton by 8.5% in Wisconsin.
Lets look a second at the comparison of the tipping point for all five of the best polled candidate pairs:
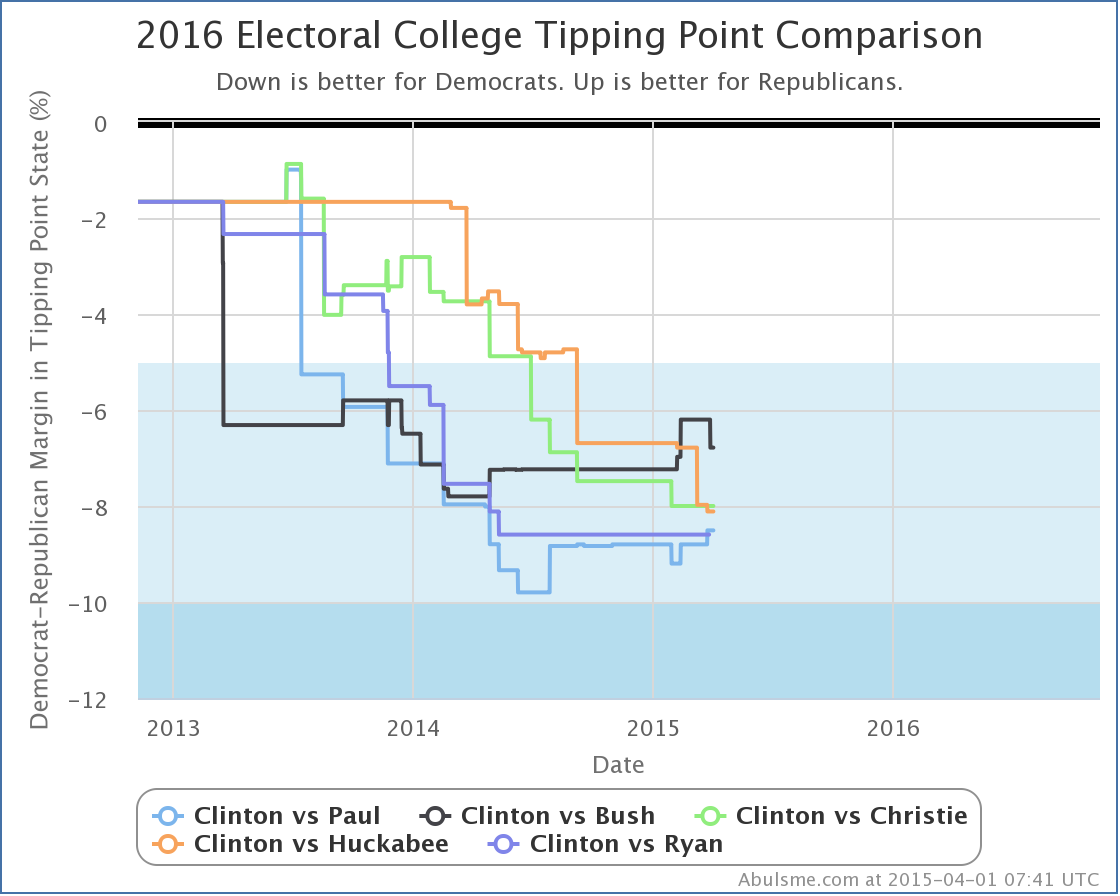
Since the November elections, we have Bush and Paul up while Christie and Huckabee are down. (No movement on Ryan, but there has been sparse polling on him since he said he was not running… we still have better polling on Ryan than on Cruz, Rubio or Walker though.)
So, there has been some press lately on how Clinton’s email issues have hurt her at the polls. There has also been press saying it hasn’t had any significant effect. National polls would of course register short term changes much much more quickly that the state polling I look at here, where even the best polled states only get polled a little more than once a month. It really is too soon for effects of that particular thing to show strongly in the kind of analysis I do here. Until we get to the last few months before the election, you’ll be able to see long term trends here, but not short term reactions to individual events in the news cycle. For the moment, there aren’t any strong trends here to call out. There has been movement, but not a whole lot, and it depends on which Republican you look at.
For the top five candidate pairs, the overall situation now looks like this:
One comparison that I haven’t done in awhile here is looking at these numbers vs 2012. The final result in 2012 was Obama 332 to Romney 206, or Obama by 126.
So while all five Republicans here are currently well behind Clinton in the expected electoral college outcome, both Bush and Paul are doing better against Clinton than Romney did against Obama!!
So while Clinton still has a healthy lead here, we’re nowhere near landslide territory or anything like that. Remember that a 10% tipping point margin (a relatively huge lead) still means the results of the election can be flipped if just 5% of the people change their minds (or don’t turn up to vote, or whatever).
If this was a few days before the election and Clinton had these kinds of numbers, it would be foolish to bet against her winning. But it is 587 days until the election. There is a long long way to go. Polls at this stage are NOT predictive of the results at the end of the process. They are only a snapshot of what things look like TODAY, which gives you an idea how much work the candidate that is behind would have to do to win. (Or alternately, how much the candidate who is ahead can afford to screw up.)
As I mentioned in my last update there is a lot of interest in a few other candidates too. Right now Clinton vs Cruz is the 6th best polled combo, Clinton vs Rubio is at #7, and Clinton vs Walker is at #8. You can click through on those links if you want to see what those look like at the moment. But the amount of state level polling on those guys still isn’t that great (although they are catching up), so take what you see there with a big lump of salt.
Note: This post is an update based on the data on my 2016 Electoral College Analysis Site. All of the charts and graphs seen here are from that site. Graphs, charts and raw data can be found there for the race nationally and in each state for every candidate combination that has been polled at the state level. In addition, comparisons of the best polled candidate combinations both nationally and each in each state are available. All charts above are clickable to go to the current version of the detail page the chart is from, which may contain more up to date information than the snapshots on this page, which were current as of the time of this post.
There were six states where the average margin over the last five presidential elections was less than 5%. Those states were Nevada, Ohio, Florida, Colorado, Virginia and Missouri. Since the 2012 election we’ve had lots of 2016 general election match up polls in Ohio, Florida, Colorado and Virginia. But nothing in Nevada or Missouri. No polls at all.
Today I added the first Nevada results for the 2016 cycle, a recent poll from Gravis.
The only category change coming out of this was for Clinton vs Bush.
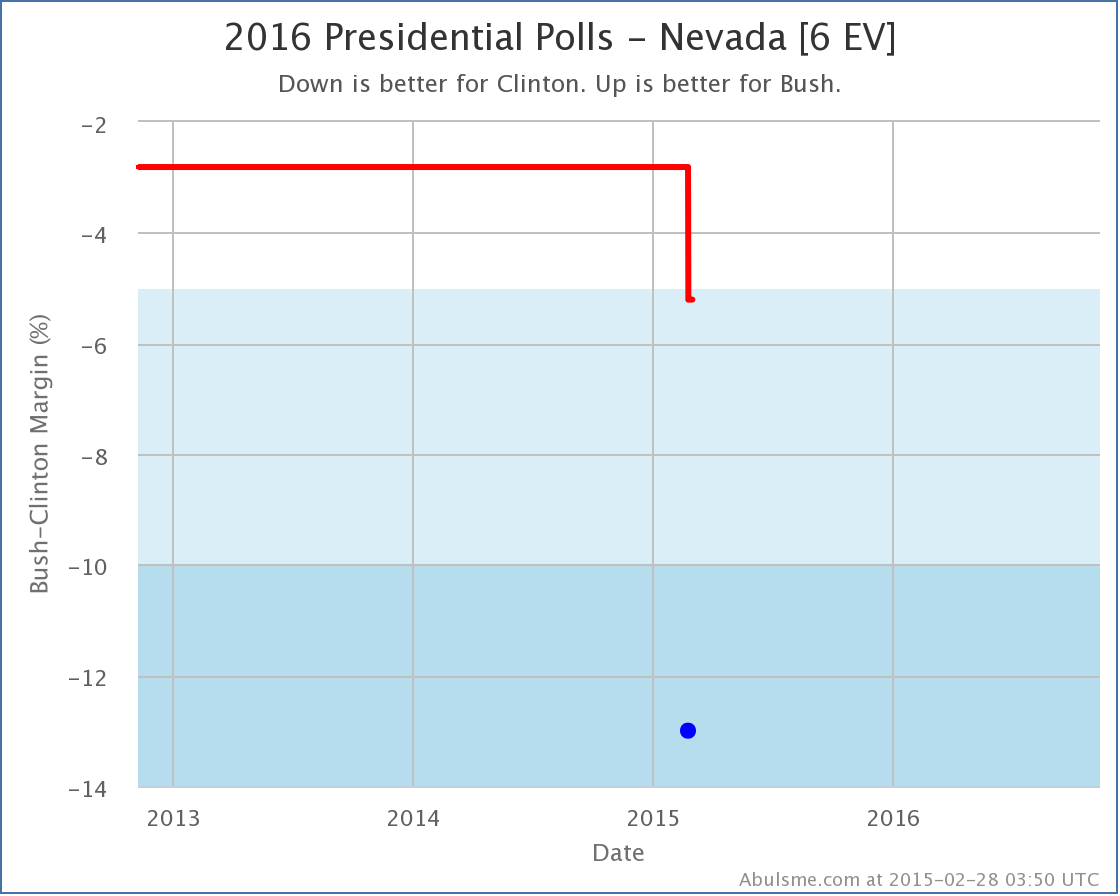
The margin over the past five elections in Nevada had ranged from the Republican by 3.5% (in 2000) to the Democrat by 12.5% (in 2008), but the average was Democrats by 2.8%, which gave Nevada an initial classification of “Weak Clinton”.
Gravis polled five different Republicans against Clinton. One of them (Sandoval) actually beat Clinton. The rest lost, and generally by a worse margin than the old average, but not by enough to push the average into a new category. Bush on the other hand did VERY badly in this poll, losing to Clinton 50% to 37%, or a 13% margin.
As the first actual head to head polling in Nevada, we’re still basing things primarily on old presidential election results, but that bad a result was able to single handedly move the the average to a 5.2% Clinton lead, and thus moved Nevada into the “Strong Clinton” category.
According to my simple model, this takes the state out of the list of possible Bush wins. At least for now… Perhaps this poll is an outlier and the next poll will make the state closer again. With one real poll, you wouldn’t want to feel too confident of what this stare really looks like quite yet.
For now though, this of course further lowers Bush’s “best case”:
This makes the full national summary for Clinton vs Bush look like this today:
Now, this doesn’t look great for Bush, but he may start improving in Nevada (and other states) as we start getting into real campaigning. Maggie Haberman is reporting in the New York Times that the first TV ads specifically targeting Clinton will air this weekend. These of course will not be the last. It will not be surprising to see things move toward the Republicans as this process gets into full swing.
And of course we still need polls in Missouri. :-)
So… stay tuned.
Note: This post is an update based on the data on my 2016 Electoral College Analysis Site. All of the charts and graphs seen here are from that site. Graphs, charts and raw data can be found there for the race nationally and in each state for every candidate combination that has been polled at the state level. In addition, comparisons of the best polled candidate combinations both nationally and each in each state are available.
[Edit 06:06 UTC to add note at end which will become standard on these update posts.]


|
Romney |
Obama |
| Romney Best Case |
258 |
280 |
| Current Status |
206 |
332 |
| Obama Best Case |
205 |
333 |
At 04:49 UTC CNN called Nevada for Obama. The five poll average still hasn’t missed, but there are still a few states left.

One state changes categories today. It is Florida.

As I’ve cautioned before with Florida (and a couple other states), the state is close, the five poll average has bounced back and forth across the line repeatedly. The average today moves slightly to the Obama side of the line. But it could easily go back to the Romney side of the line tomorrow. There have been no moves that indicate Florida is moving definitively toward one candidate or the other. Absent such a move in the next few days, we’ll basically just need to wait for the actual vote count.
So, new map and summary:

|
Romney |
Obama |
| Romney Best Case |
321 |
217 |
| Current Status |
206 |
332 |
| Obama Best Case |
190 |
348 |
Hello old friend, it is nice to see you again! Once again we have a 332-206 Obama victory, which is where the “Current Status” line has been more often than anywhere else all year long. There have been moves above this, and moves below this, but so far, things have always come back here. I guess we’ll see if that holds through election day.
Once again though, lets dig deeper. Winning is possible for Romney here. But just how far away is he? Lets look again at the “Tipping Point Margin” chart I debuted yesterday:

What looked like a slight trend in Obama’s direction looks more significant today. With today’s update Obama’s lead in Ohio increased to 3.3%. This actually moved Ohio past Nevada, where Obama’s margin is now 3.2%. This makes Nevada the new “tipping point state”. Romney’s easiest path to victory is now holding on to all the areas he is ahead in, then erasing Obama’s advantage and taking the lead in Virginia (13 ev, 0.9% Obama lead), Florida (27 ev, 1.0% Obama lead), Iowa (6 ev, 1.2% Obama lead), Colorado (9 ev, 2.0% Obama lead), New Hampshire (4 ev, 2.2% Obama lead) and then Nevada (6 ev, 3.2% Obama lead).
Ohio may well return to the tipping point position tomorrow, but for now that is where we are.
The tipping point margin is a metric that looks pretty noisy over the past few weeks, so I would urge caution reading much into individual daily ups and downs. A lot of that is just going to be statistical noise. However, this represents the best margin in the tipping point state Obama has seen since October 7th in the midst of his downward plunge after the first debate. The upward trend in this measure of the state of the race is now looking more clear.
Tick tock. The time left for Romney to make a move in the polls is diminishing quickly. Will something gain traction? If not, then Romney’s main remaining hope is that all the polls, not just those from Democratic leaning pollsters, but all of them, are actually wrong and are systematically tilting toward Obama. This is not impossible, and along with the possibility of a last minute event that changes things, is likely a big part of why sites like 538 give Romney a 20%+ chance of winning. Views of this using just the raw polling data, like that done by Darryl at horsesass.org give a much lower chance of a Romney victory.
But then there is Sandy. Michael, A commenter on yesterday’s update, brought up the possibility of reduced voter turnout in areas of Pennsylvania affected by Hurricane Sandy making the state winnable for Romney. Unlike potential effects on popular opinion of Obama due to how he responds to the hurricane, turnout effects due to the storm may simply not be measurable by the polls. First of all, the degree to which any remaining issues from the storm may impact voting on Tuesday may not be clear until almost Tuesday. Second, because people in effected areas are busy dealing with the storm impact itself, they may be more reluctant to participate in polls, and some pollsters may not even bother trying.
Now, most people seem to think that the effects of the storm on actual voting next Tuesday will be minimal, as most services will have been restored by then, etc. But for argument’s sake, lets imagine that turnout in the Philadelphia area is significantly reduced, giving Pennsylvania to Romney despite Obama’s 4.6% lead in current polling. Let’s also give Virginia to Romney on the same basis… reduced turnout in Northern Virginia breaking what is essentially a tie in Virginia at the moment, and giving the state to Romney.
With those two states as well as the states he is already ahead in, we have Romney with 239 electoral votes. That is still 30 electoral votes short. If we start adding states in again based on how close Romney is… Florida… which is essentially tied right now… brings Romney to 268 electoral votes. Just one electoral vote short of a tie. Iowa would then be the tipping point state. With it’s 6 electoral votes, Romney would win 274 to 264. Romney is currently behind in Iowa by only 1.2% in my five poll average. (Only 2 of those 5 polls were concluded after the last presidential debate, and those last polls look better for Obama, but lets call it 1.2% for now.)
If Hurricane Sandy was indeed able to deliver Pennsylvania and Virginia for Romney, Obama would STILL be ahead… but it would be a LOT closer!
For the moment though, as long as that scenario does not develop, Obama’s position seems to be better now than it has been in weeks. He is increasing his lead in Ohio and other swing states. Even if you grant some movement toward Romney in Pennsylvania and Virginia that isn’t visible in the polls, it seems like Romney still needs something else to move things in his direction.
Before the hurricane, Romney’s camp seemed to be trying (but failing, at least in the critical states) to gain traction based on the Obama administration’s handling of the attacks in Benghazi on September 11th. Maybe a renewed push on that issue in the remaining days will do the trick? The Romney campaign has also been pushing hard in Ohio with an attack implying Obama’s policies are resulting in Jeep moving jobs from Ohio to China. Fact checkers have called these claims misleading at best, but that doesn’t necessarily stop the attack from being effective. Maybe that will start reversing the polling trend in Ohio? Or will there be some new event that moves things dramatically toward Romney?
Watch this space in the next few days. We’ll find out… :-)
(And of course, Romney’s apparent lead in national polls continues… so if the polling is correct and nothing changes before election day, the possibility of Romney winning the popular vote while losing the electoral college remains very strong.)
Note: I actually finished my daily sweep of the polls about 10-11 hours prior to making this blog post. I usually try to keep that gap shorter, but it is what it is. There have of course been new polls released in that time. Those will be included in tomorrow’s update.
Note: Chart and map from the Abulsme.com 2012 Electoral College Prediction page. Both assume Obama vs Romney with no strong third party candidate and show polling as it currently exists. Things will change before election day. On the map red is Romney, blue is Obama, gold states are too close to call. Lines on the chart represent how many more electoral votes a candidate would have than is needed to tie under several different scenarios. Up is good for Obama, Down is good for Romney.


Two states change categories today. One moves toward Obama, the other moves toward Romney. Lets take a look:

Last Friday the five poll average moved to a 5.2% Obama lead in Nevada. With today’s update, it drops back down to 4.6%. With that I put Nevada back in the list of “Lean Obama” close states. In the last year, Romney has NEVER held a lead in Nevada in the five poll average. Winning Nevada would be a stretch for him. But it is once again somewhat close. There ARE situations you could imagine, even with less than two weeks to go, that would erase Obama’s advantage in Nevada. As we get closer though, a 4.6% lead looks a lot bigger than it might have a month ago.

After a brief dip into Romney territory in the middle of October, Virginia returns to where it has been for most of the last year… a small Obama lead. As of now, the five poll average has Obama with a 1.0% lead in Virginia. This moves Virginia back to Obama’s column. The lead is narrow, this could change, but the movement lately has been toward Obama.
If you look specifically at the state charts such as the two above, this is actually the picture in most of the states that are in contention. You see an Obama decline starting about a week before the first debate, which accelerates into more of an implosion after the first debate. That decline hits bottom sometime between the VP debate and the second presidential debate, and then Obama has been trending upward ever since, but is still quite a long way from his highs at the end of September.
Now where does this put our summary?
|
Romney |
Obama |
| Romney Best Case |
301 |
237 |
| Current Status |
206 |
332 |
| Obama Best Case |
191 |
347 |
That is right. Our old friend is back. Obama winning by 332 to 206. This is where the “Current” line has been more often than any other position. If you look at the chart showing the history of the race for the entire year you can see that the most time has been spent here, and while there have been occasional movements in both directions away, time after time things have just reverted to 332 to 206. This just seems to be where this race “wants” to be. This seems to be the “mean” that the race always reverts back to after one event or another moves it away.
This looks like a pretty strong position for Obama, right? Romney is only ahead in ONE of the close states at the moment. He has to move several back over to his side to win. This does not look great for Romney.
Well, no, this isn’t great for Romney. His situation is considerably worse than it was right before the second debate. He clearly peaked and is now declining again… at least in terms of the electoral college. There have been some people saying that they are seeing Romney momentum right now. Uh, no.
But… it is still close. Time to look again at the individual close states:
- North Carolina (15 ev) – 2.0% Romney lead – 0/5 polls after last debate
- Florida (29 ev) – 0.6% Obama lead – 0/5 polls after last debate
- Virginia (13 ev) – 1.0% Obama lead – 0/5 polls after last debate
- New Hampshire (4 ev) – 1.0% Obama lead – 1/5 polls after last debate
- Colorado (9 ev) – 1.2% Obama lead – 0/5 polls after last debate
- Ohio (18 ev) – 1.6% Obama lead – 1/5 polls after last debate
- Iowa (6 ev) – 2.2% Obama lead – 0/5 polls after last debate
- Wisconsin (10 ev) – 3.5% Obama lead – 0/5 polls after last debate
- Nevada (6 ev) – 4.6% Obama lead – 0/5 polls after last debate
We still have Romney with 191 electoral votes without any close states. Add in the one close state he is ahead in, North Carolina, and you get to 206 electoral votes. That is 63 electoral votes short. In yesterday’s update if you moved all states toward Romney by more than 1.2%, you would have a Romney win. The tipping point was Ohio. The tipping point is still Ohio.
The easiest way for Romney to win is to hold North Carolina, then pull Florida, Virginia, New Hampshire, Colorado… and Ohio… to his side of the fence. This is looking like a much harder job than it was before. More states are slipping away from Romney… but they are still close… they are not out of reach.
Not as close as they were though. Obama’s lead in Ohio is increasing. It is now 1.6%. But 1.6% is still tiny. You can easily imagine events that would cause a 1.7% or 2.0% move in the polls across all the close states. If Obama pulls ahead by a bit more in Ohio, then maybe we can say he starts to look like a clear winner. But at the moment, it is still close.
Obama is ahead. If the election was held today, he would be the favorite by a decent margin. As of today, FiveThirtyEight has Obama at a 68.1% chance of winning. I’ve seen higher estimates elsewhere, up to 93.4%. My gut says it is somewhere in between. Maybe 80%.
But there is another interesting possibility percolating that I’ll mention before I close. For the last two weeks or so, most of the places doing poll averaging of national polls have shown Romney ahead. I don’t believe ANY of the sites that I track that are doing analysis of the electoral college have shown Romney ahead at any point. Obama has always been ahead.
If this situation persists through election day, we may have a repeat of 2000, but with the parties reversed and the key state being Ohio instead of Florida. Romney wins the popular vote, but Obama wins the electoral college and therefore the presidency.
This kind of situation happens when you have something like Romney building up increasingly large margins in states he was going to win anyway, like Texas. These additional gains make no difference to the electoral college, but they do matter to the electoral vote.
I would find this extremely entertaining for no reason more than being able to watch all kinds of people in both parties suddenly have a completely opposite opinion on the value of the electoral college than they espoused 12 years previously.
This is still not necessarily an expected outcome… FiveThirtyEight puts the odds of the scenario above at 6.5%. (For completeness, they give 1.8% odds to the reverse scenario where Romney wins the electoral college and Obama wins the popular vote.) 6.5% isn’t exactly super likely, but it is nothing to sneeze at. If there was a 6.5% chance of a hurricane hitting your city, you would be starting to make preparations.
Meanwhile though, other analysts put these odds much higher… specifically, Sam Wang puts the chances of this at 25%.
I normally say you can basically ignore the popular vote except as an early indicator to moves in the states… but this is a situation where watching the popular vote is worth it. If we continue to see a popular vote / electoral vote split it will make for a very interesting election night.
Note: Chart and map from the Abulsme.com 2012 Electoral College Prediction page. Both assume Obama vs Romney with no strong third party candidate and show polling as it currently exists. Things will change before election day. On the map red is Romney, blue is Obama, gold states are too close to call. Lines on the chart represent how many more electoral votes a candidate would have than is needed to tie under several different scenarios. Up is good for Obama, Down is good for Romney.
Edit 2012 Oct 24 18:53 UTC to fix a few wording issues.


Two states move today, one toward Obama, one toward Romney. As usual, in order of Electoral College strength:

In the last three months Nevada has usually been “Leaning Obama”, meaning Obama has the advantage, but not by very much. In September Obama’s lead headed higher for a little bit, then dove again after the debates. Now it heads up again, with Obama’s lead in the five poll average now at 5.2%. Given this, Nevada now is classified as “Weak Obama” meaning it would take a pretty significant move for Romney to take the lead and win the state. So Nevada is no longer included in Romney’s “best case” scenario.

Pennsylvania is a bit odd. Three days ago Obama’s lead topped 5% in the five poll average. But today we add a new poll that arrived out of order. It was still in the five most recent polls by the last day of polling, so it counted as a “recent poll” for us, but it was also the first poll since February showing Romney ahead in Pennsylvania, and showing him ahead by a relatively substantial 4% at that. This is way out of line with other recent polling in the state, so certainly LOOKS like an outlier. Especially since by the time it was released there were already polls taken after it that did not show that kind of movement.
But I don’t do any outlier removal here. I just let the five poll average do what the five poll average does. For the moment, this means that Obama’s lead in Pennsylvania is now down 2.8%, with the peak above 5% erased. Because this was still a “current poll” I do not retroactively adjust the overall historical trend however.
This potential outlier is now the 5th oldest poll I have in Pennsylvania, so it will age out with the very next Pennsylvania poll. Pennsylvania may or may not pop back to “Weak Obama” at that point depending on the results of that next poll.
So this puts Pennsylvania back in play, with the possibility of Romney winning the state now back in his best case scenario.
Which brings us to the updated summary:
|
Romney |
Obama |
| Romney Best Case |
301 |
237 |
| Current Status |
248 |
290 |
| Obama Best Case |
191 |
347 |
We still have a close race. Obama is ahead, but Romney only needs to pull 21 more electoral votes over to his side to win.
Right now the easiest way to get there is to hold North Carolina (15 ev, 3.8% Romney lead), Virginia (13 ev, 2.6% Romney lead), Florida (29 ev, 0.4% Romney lead) and then to pull ahead and take New Hampshire (4 ev, 0.5% Obama lead) and Ohio (18 ev, 2.8% Obama lead).
There are many other combinations that will do it too. That just looks like the easiest to me at the moment.
Note: Chart and map from the Abulsme.com 2012 Electoral College Prediction page. Both assume Obama vs Romney with no strong third party candidate and show polling as it currently exists. Things will change before election day. On the map red is Romney, blue is Obama, gold states are too close to call. Lines on the chart represent how many more electoral votes a candidate would have than is needed to tie under several different scenarios. Up is good for Obama, Down is good for Romney.


Two states changing status today, and both are bad news for Obama. Lets get right to it:

Prior to the debate last week, Obama’s lead in the five poll average in Nevada was 5.9%, which was a substantial enough lead for Obama that Nevada was not in the list of states that were within reach for Romney. We now have the first post-debate poll, and it shows a tied race in the state. This is just one poll out of five, but it causes the five poll average to drop to a 4.1% Obama lead. So once again I list Nevada as just “Lean Obama” and it contributes to Romney’s best case.
Although it is a drop from where the state was before the debate, “Lean Obama” is actually where Nevada has been most of the last year, so to some degree this is reversion to the mean. Obama had a bunch of strong polls in September, but those are now in the rear view mirror, replaced by the worst numbers he has had in the state all year. (It is important to point out that some of these bad numbers were from polls taken BEFORE the debate.)
The five poll average is still buoyed by some strong late September polls. Unless Obama gets a quick bounce back in the next few polls, I expect Obama’s lead in Colorado will diminish further as those polls age off.

In Colorado before the debate Obama was 3.3% ahead in the five poll average. There have now been four polls that ended after the debate and the state flips to a 1.3% Romney lead. This is the first time in the last year that Romney has been in the lead in Colorado according to the five poll average. Unlike Nevada, where the state was down from a spike toward Obama, but had so far only returned to well traveled territory, in this case Romney is breaking new ground. Romney adds what had been a narrow but consistent Obama state to his column.
So, the new summary:
|
Romney |
Obama |
| Romney Best Case |
287 |
251 |
| Current Status |
244 |
294 |
| Obama Best Case |
191 |
347 |
Before any discussion, time to eat some crow. On September 6th I said:
…my gut is saying the beginning of September will have marked Romney’s post-primary high water mark in my models. So write that down. I’m going out on that limb. You can all call me on it when it proves to be completely wrong.
So what is the comparison between now and the beginning of September?
- On September 1st, Romney got 180 electoral votes in Obama’s best case. He now gets 191.
- On September 1st, Romney got 235 electoral votes in the “Current” case. He now gets 244.
- On September 1st, Romney got 317 electoral votes in his own best case. He now gets 287.
Well, OK. I never specified how exactly to judge this, but two out of three of the lines being better than they were seems like it should qualify, especially since one of them is the “current” line. By that mark, Romney is now at the best point he has been since the very beginning of January.
To be fair to myself, from that moment onward, in almost every update, I did mention that there was one way for Romney to come back again, and that was for Obama to majorly screw up. I perhaps stated this most clearly in my update from September 27th, which turned out to be Obama’s peak:
Yes, there could be more bad economic news. Yes, Obama could start making huge mistakes and somehow screw this up. But the magnitude of what would be necessary to reverse this gets larger by the day and the scenarios less likely.
At this point Romney needs Obama to catastrophically implode. That is unlikely.
This is done. Obama wins.
Uh… umm…. unless Obama himself screws it up, or something completely unexpected of epic proportions happens.
Gotta always add the caveats. :-)
If you believe the most hyperventilating reports out there, a catastrophic Obama implosion is indeed what seems to have happened at the first debate. It seems it was not as unlikely as I expected. I presumed both Obama and Romney would put in not great but competent debate performances and the net effect would be essentially zero. Instead we saw a brand new Romney, hitting his stride in a way he never had in the previous year, and an Obama who looked like he didn’t want to be there and was phoning it in at best.
Although Obama peaked before the debate, as each post-debate poll comes in, what a couple of weeks ago seemed like an insurmountable lead for Obama is getting transformed into a genuinely close race. A number of people doing detailed analyses of the polls have pointed out that if you look carefully at the dates on both state and national polls, there is tentative evidence that Romney’s debate bounce may have already peaked and is now starting to recede. So this may be a good time to do another detailed look at where the swing states stand, and what it would take for Romney to win.
First thing to point out… despite the fairly significant drop Obama has seen since his peak… he is still ahead! (For the moment anyway.) Some national polling averages now show Romney ahead in the popular vote, but remember we do not have a national election, we have 51 smaller elections. Looking at the states using my five poll average, here is where we now stand, looking not just at my categories, but also specifically at the magnitude of the candidate leads in the close states.
With only the states where Romney is ahead by more than 5%, Romney gets to 191 electoral votes.
Then we add in the close states where he is ahead:
- North Carolina (15 ev) – Romney leads by 2.9% – 1/5 polls after the debate
- Colorado (9 ev) – Romney leads by 1.3% – 4/5 polls after the debate
- Florida (29 ev) – Romney leads by 0.2% – 2/5 polls after the debate
That gets Romney to 244 electoral votes if he can hold his lead in those three states. You need 269 electoral votes to tie (a situation Romney would probably win in the house) or 270 electoral votes to win outright. So Romney needs 25 more electoral votes to tie, 26 to win. To get there he needs to start pulling ahead in states where Obama is currently ahead.
- Ohio (18 ev) – Obama leads by 0.4% – 5/5 polls after the debate
- Virginia (13 ev) – Obama leads by 1.0% – 4/5 polls after the debate
- Iowa (6 ev) – Obama leads by 3.2% – 1/5 polls after the debate
- Nevada (6 ev) – Obama leads by 4.1% – 1/5 polls after the debate
There are a number of combinations that will get Romney to 270, and any of those four close states could easily flip. They are all close enough that the lead can disappear overnight. With the current state of the polls though, the easiest way for Romney to win seems to be to flip Ohio and Virginia, both of which are now looking exceptionally close. Prior to the debate, Obama had a 7.8% lead in Ohio… now down to 0.4%. That is a massive move in such a short time. Prior to the debate, Obama had a 4.3% lead in Virginia, now down to 1.0%. That’s a smaller move, but not insubstantial. If Romney can move each of those just a LITTLE bit further, then it would put him ahead in my “current” electoral college model for the first time ever.
For almost all of the last year, while Romney’s best case was to win, I’ve been able to repeatedly say that hitting the best case was difficult. Romney would have to almost sweep the close states, and during most of that time, Romney was behind in most of those close states. It was a tall order.
Not so much any more. Romney is still behind. But both Ohio and Virginia are in easy spitting distance. A very slight move in those states, and he pulls ahead. Then if he manages to stay ahead, perhaps even consolidating those leads, then he wins on election day. For the first time since January, this looks like a close race.
The question of course is how long lasting this “debate bounce” is. Can Romney hold onto his gains… and extend them a little further to eke out a narrow win? Or do we start reverting back to where the race has been most of the year? Do we end up back at the “everybody wins the states they are ahead in” line being at Obama 332 to Romney 206 where it has been more often than anywhere else?
The “feel” of the race has certainly changed. Obama was knocked on his heels and is now on defense. At long last, Romney has repositioned himself toward the center, making a play for the voters he needs to win over to win. To win though, he needs to not just hold his gains so far, but pull things a bit further toward him.
If Obama on the other hand can just hold on and prevent any further losses, he wins. If Romney’s bounce recedes (as some say is already happening) then once again Obama wins.
It seems likely that we will indeed see some reversion to the mean, which would favor Obama. But if Obama has another bad debate, or in general if he can’t shift the narrative back in his favor in the next few weeks, he is in big trouble. Romney isn’t in the lead yet according to my classifications… but a few more good polls and he is there. He is close. Really close.
Note: Chart and map from the Abulsme.com 2012 Electoral College Prediction page. Both assume Obama vs Romney with no strong third party candidate and show polling as it currently exists. Things will change before election day. On the map red is Romney, blue is Obama, gold states are too close to call. Lines on the chart represent how many more electoral votes a candidate would have than is needed to tie under several different scenarios. Up is good for Obama, Down is good for Romney.


Three states change categories today. Two states move toward Obama, one state moves toward Romney. But Romney’s state is bigger than the other two combined, so he wins the day. Lets look at them each, from smallest to largest:

The five poll average in New Hampshire had been generally sticking at an Obama lead less than 5%, but with two related polls (both from WMUR/UNH with and without pushing leaners to express a preference) showing Obama with a 15% lead in the state, the average spikes upward These data points may well prove to be outliers, they certainly seem like it initially, but for the moment they move Obama’s lead well out of the “Leaning” category, and indeed almost all the way to the “Strong” category. For the moment though, Obama’s lead stands at 9.8% and we put New Hampshire into the “Weak Obama” category. (Note that even if we’d only counted one of these two polls, the state would still end up as Weak Obama.) This has the effect of moving New Hampshire out of Romney’s reach for the moment.

In Nevada things look less like they are being influenced by an outlier. Instead three of the last five polls in the state now show leads over 5% and the average now jumps to a 5.7% Obama lead. There does seem to be some real movement toward Obama in those last few polls. Will it last? Who knows. But for the moment Nevada also moves out of Romney’s reach as well.
This would all look pretty bad for Romney today, except for the third state:

Florida, where the five poll average had just hit 5.0% exactly last Thursday causing me to move Florida to “Weak Obama”, now drops back below 5% again, putting Florida back into the much more familiar “Weak Obama” category where it has been for most of the last year. The spike upward appears to be over, and Florida has reverted to form as being a close state. Well, sorta close. The five poll average still has Obama at a 4.1% lead in Florida, which is not insubstantial. And he has been “slightly ahead” in the state for most of the year. But this is still a small enough lead that given the right sorts of events it could disappear quickly. So once again, I list Florida as being in play.
And that makes the current status:
|
Romney |
Obama |
| Romney Best Case |
263 |
275 |
| Current Status |
191 |
347 |
| Obama Best Case |
191 |
347 |
So Romney’s best case if he wins all the close states… now once again including Florida… is still to loose, but now by a pretty small margin. Obama 275 to Romney 263. If he can get Nevada back in play and win that, we could have a 269-269 tie, which would probably end up going for Romney in the House. A tie would be a lot of fun. Still an unlikely scenario though.
In general, to win, Romney has to win Florida (29), North Carolina (15), Virginia (13), Colorado (9) and Iowa (6) for sure. All of those are “must win”. And Romney is currently behind in all of them to various degrees. They are all pretty close though and flipping them is not unrealistic. On top of that he then needs to get at least one of the big states in the “Weak Obama” category, or two of the smaller ones. Those are all states where Romney is behind by more than 5%.
Although the map looks a bit better than it did a few days ago, it is still a very bleak picture for Romney at the moment.
Note: Chart and map from the Abulsme.com 2012 Electoral College Prediction page. Both assume Obama vs Romney with no strong third party candidate and show polling as it currently exists. Things will change before election day. On the map red is Romney, blue is Obama, gold states are too close to call. Lines on the chart represent how many more electoral votes a candidate would have than is needed to tie under several different scenarios. Up is good for Obama, Down is good for Romney.
Edit 2012 Oct 3 09:44 UTC to add final note.
|
|


