This is the website of Abulsme Noibatno Itramne (also known as Sam Minter).
Posts here are rare these days. For current stuff, follow me on Mastodon
|
States with new poll data added since the last update: Wisconsin, New York, North Carolina, Pennsylvania, Ohio, Michigan, Virginia, West Virginia, Arizona, New Hampshire, Missouri, Kansas
With the logic change out of the way, the race moves on. With the latest batch of polls, one state changes category, and two more contribute to a change in the tipping point.
Electoral College Trend
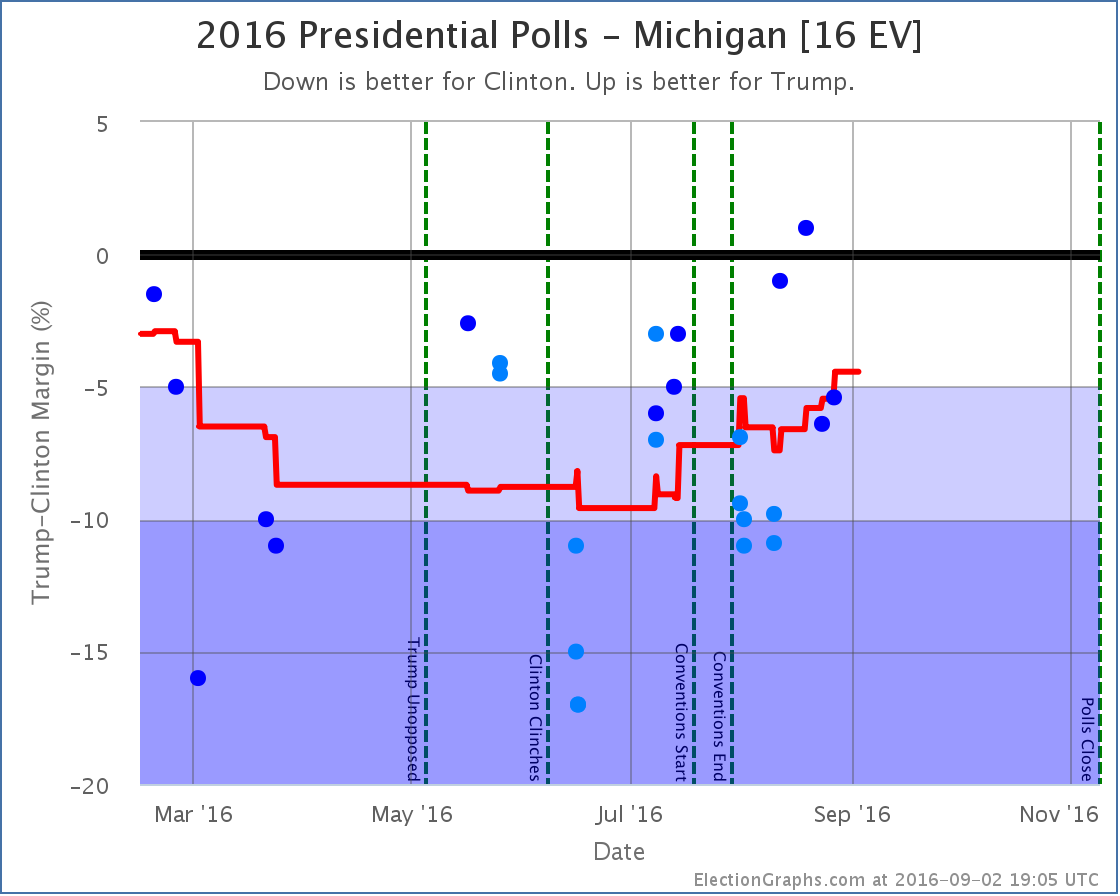
Despite a few bad polls for Trump right after the convention, the general trend in Michigan has been a tightening race since the beginning of July. With the latest, Clinton’s lead falls to only 4.4%. For the first time since March, Michigan is looking possible for Trump, so we now include it in his best case.
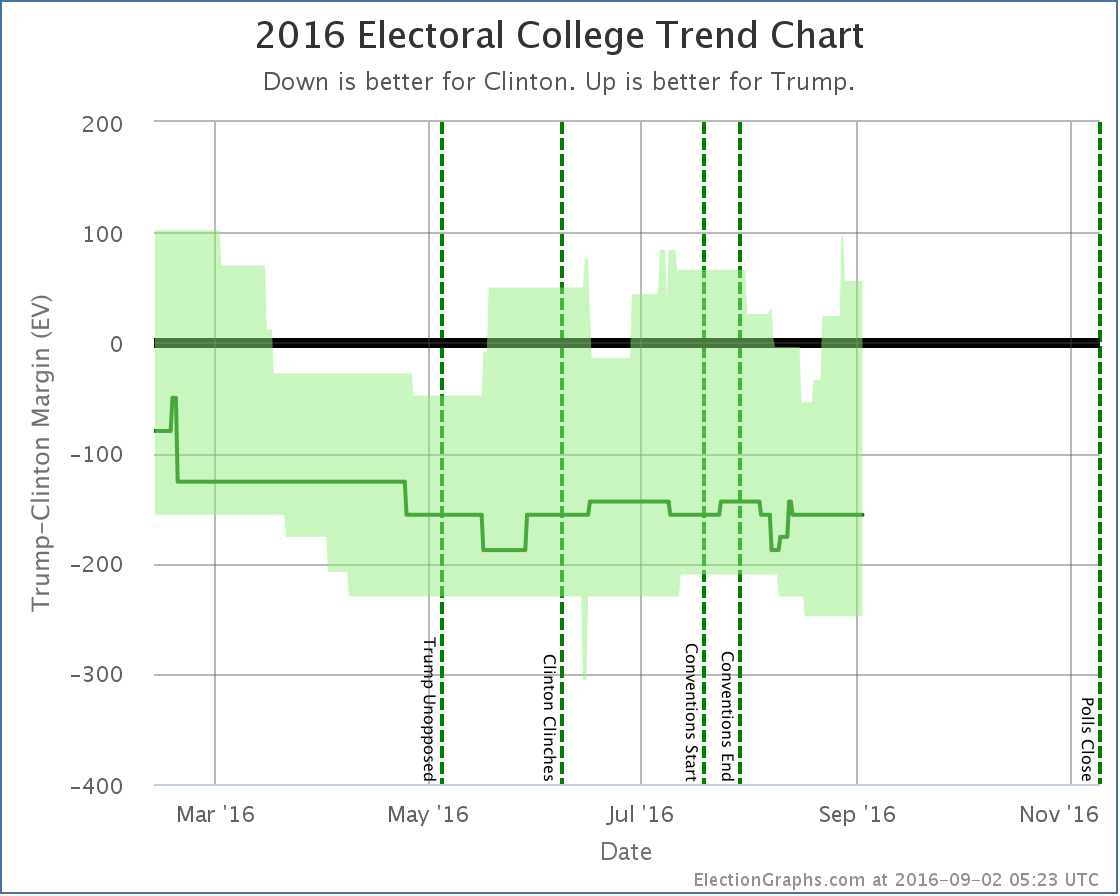
If Trump wins all the states he is ahead in, plus all the states where Clinton leads by less than 5%, he now wins by 56 electoral votes.
(Note the transient spike on the chart as well. This was caused by one poll added in this batch briefly bringing Pennsylvania back into reach for Trump, but another poll added in this same batch increased Clinton’s lead again right away, so there was no net change due to Pennsylvania this time.)
Tipping Point
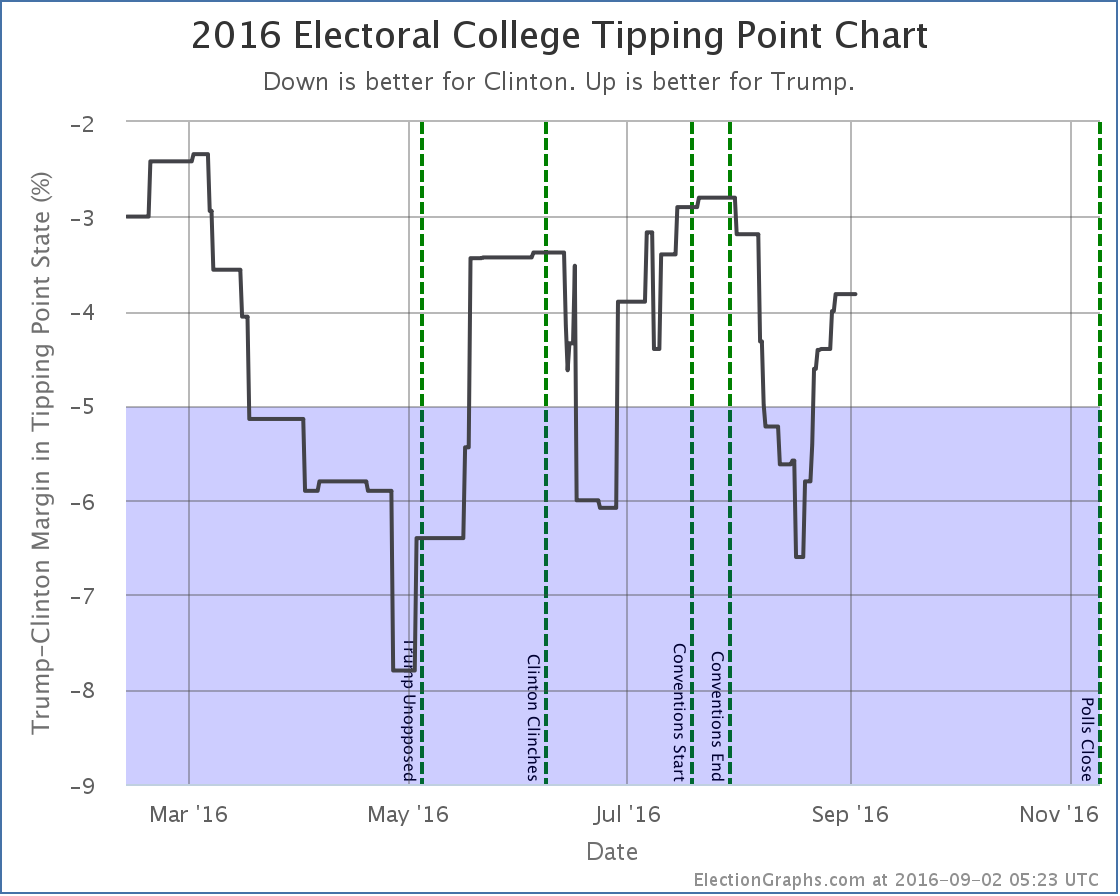
Ohio and New Hampshire were and still are “Weak Clinton” states, but they wiggled around a bit with the latest polls and moved the tipping point from Clinton by 4.4% in Ohio to Clinton by 3.8% in Ohio, an 0.6% move toward Trump.
Overall
In both the Trump best case and the tipping point, we see Trump clearly reaching a peak during the conventions, then plummeting the first half of August, then recovering ever since. He isn’t quite back to where he was before the conventions, but he is getting close.
So far Trump is making a lot of states that were not close a few weeks ago close. But no states have crossed the center line in the last couple of weeks. We have seen this before. There are a variety of blue states where Trump seems to be able to come close, but he is having a hard time pulling them across the line into the red zone.
Since the conventions the “expected” case has been in the range between Clinton winning by 144 and Clinton winning by 188. Trump hasn’t done better than losing by 144 electoral votes since before he was locked up the Republican nomination. The test for any continued Trump rebound will be if he can start to move not just his best case, but the expected case as well. Can he actually flip states? Or just make them close?
The electoral college margin in the expected case is deceptive, because these numbers can change very quickly. The tipping point is the thing to watch at the moment. At a 3.8% Clinton margin, less than 1 out of 50 people have to change their minds to flip the outcome. The public is polarized, but 1 out of 50 isn’t all that much in the grand scheme of things. You can imagine events that would flip that many people if Clinton has a bad week.
Historically though, Trump is very near his previous ceilings. Every other time he has reached these levels, he has fallen back down fairly quickly. Will this time be different?
67.2 days until the polls start to close.
Note: This post is an update based on the data on ElectionGraphs.com. Election Graphs tracks both a poll based estimate of the Electoral College and a numbers based look at the Delegate Races. All of the charts and graphs seen in this post are from that site. Additional graphs, charts and raw data can be found there. Follow @ElectionGraphs on Twitter or like Election Graphs on Facebook to see announcements of updates or to join the conversation. For those interested in individual general election poll updates, follow @ElecCollPolls on Twitter for all the polls as they are added. If you find the information in these posts interesting or useful, please consider visiting the tip jar.
States with new poll data since the last update: Florida, Illinois, Pennsylvania, New Hampshire, Ohio, North Carolina, Nevada, New York, Texas, California, New Jersey, Minnesota, Georgia, North Carolina, Indiana, Arizona, Missouri, Massachusetts, Virginia, Tennessee, Washington, Michigan, Wisconsin, Mississippi, Oklahoma, Idaho, Maryland, Oregon, Maine (All), Louisiana, Colorado, Iowa, Nebraska (All), South Carolina, Alabama, West Virginia, Kansas, Kentucky, Utah, Arkansas, Connecticut, Delaware, New Mexico, Montana, Alaska
Wow, that is a lot of new polls. While there were some others, the big influence today is that Reuters/Ipsos has started to do a weekly nationwide tracking poll where they provide state breakdowns for any state where they have enough data. So from now until the election we should start getting regular data on a lot of states that usually don’t get polled.
As usual, most of the updates didn’t change the status of the model, but a few did, and all of these moves this time were toward Trump. Lets take a look state by state:
Arizona [11 EV]
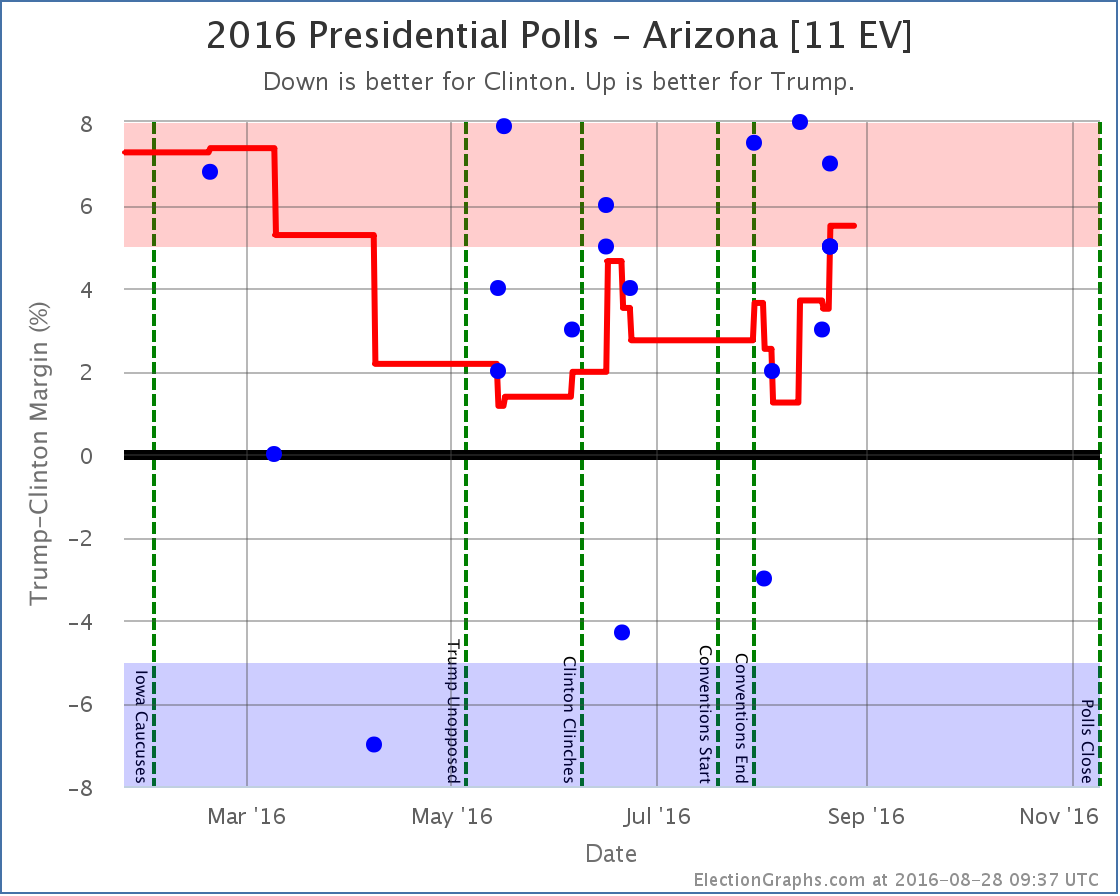
Ever since April Arizona has been looking like a possible target for Clinton… Trump ahead, but with only a narrow lead that Clinton might be able to flip. With the latest updates, Trump’s lead in the average increases to 5.5%, so we take it out of that category. The notion of a blue Arizona slips away from Clinton.
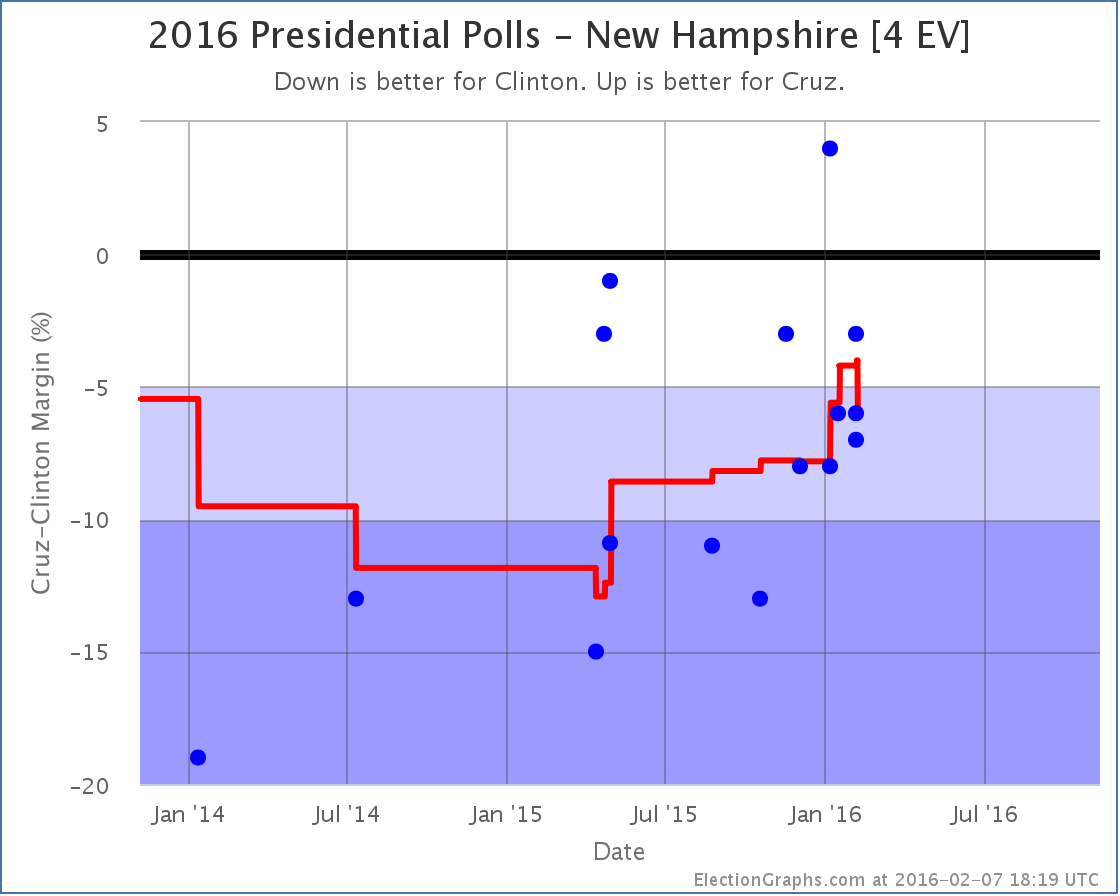
New Hampshire [4 EV]
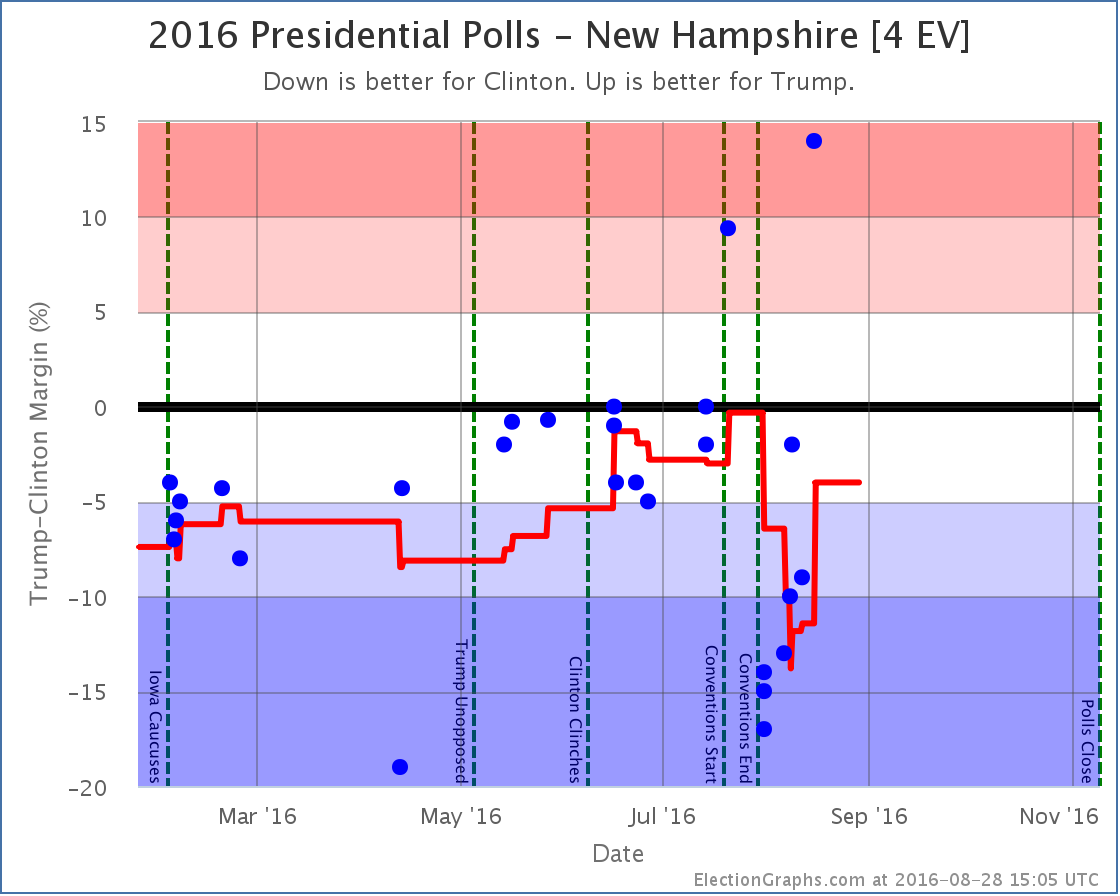
Honestly, it looks like an outlier, but the most recent of those Reuters/Ipsos results I mentioned show Trump with a huge 14% lead in New Hampshire. The second best number in the average shows Clinton up by 2%, and that is also from Ipsos. All the other recent numbers in New Hampshire show a Clinton lead of at least 9%, and there has been no radical change in the campaign that would indicate a huge swing would be expected.
If these two Ipsos data points are really outliers, then new polls should quickly show that. For the moment though, the average moves to only a 4.0% Clinton lead due to the two Ipsos data points, so New Hampshire is once again categorized as a state Trump has a chance in.
Maine (All) [2 EV]
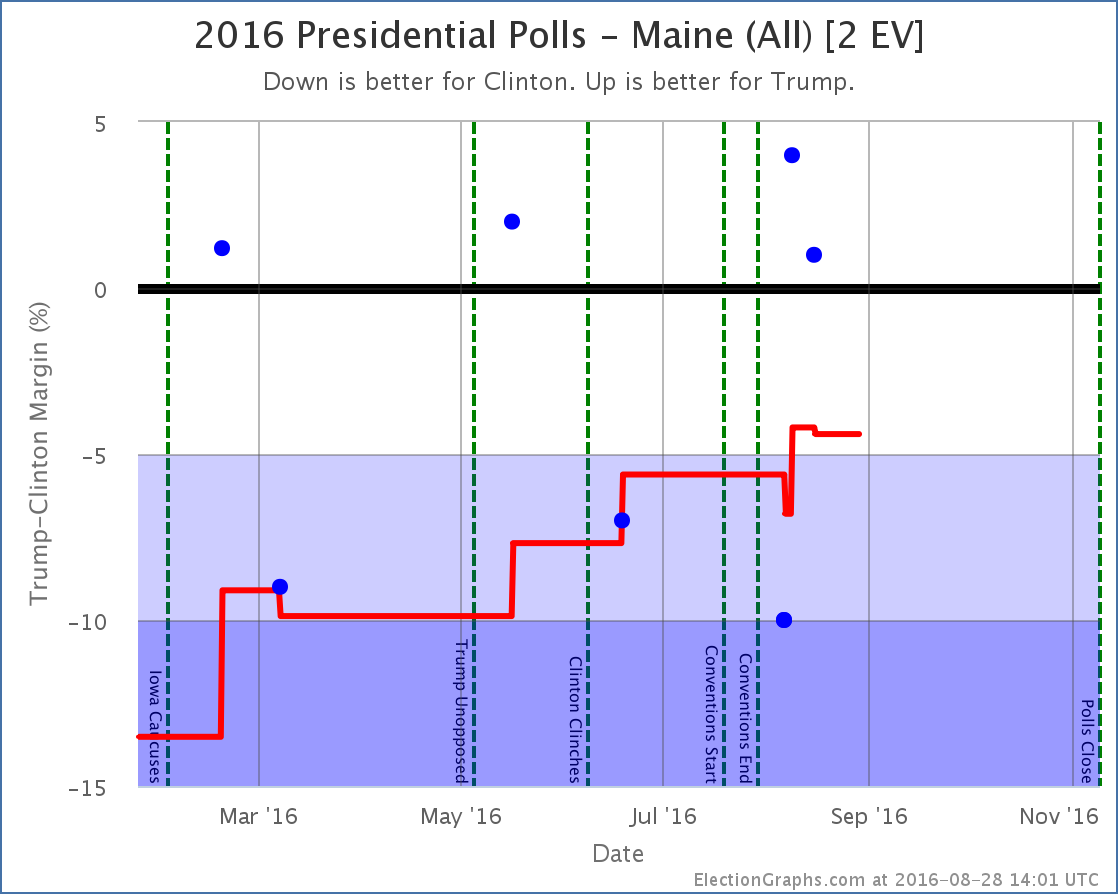
Maine has been pretty sparsely polled this Election cycle, but what polls we do have show the state trending away from being a solid blue state to being close. The latest couple of results (both Ipsos) have Trump ahead, as have a few previous polls. The average is now only a 4.4% Clinton lead, so Maine is now in the “Weak Clinton” category, and it is included in Trump’s best case.
Now, Maine is one of the two states that splits electoral votes. For winning Maine at large, you only get 2 electoral votes. You then get 1 electoral vote for winning each congressional district. Now, mathematically, for Maine as a whole to have a 4.4% lead for Clinton, Trump would have to be doing even better than that in one of the two congressional districts. But right now the average in CD-1 is a 15.8% Clinton lead and in CD-2 it is a 5.3% Clinton lead. That can’t be! You would expect CD-2 to be Weak Clinton as well, or possibly even Weak Trump.
The problem is that while there has been very limited polling of Maine as a whole, there has been even less polling of Maine at a Congressional District level. There has only been ONE poll of Maine CD-2 this election cycle. It was in June and showed Trump up by 1%. The average is 5.3% Clinton because in order to fill out the average when there are less than five polls, I use previous election results.
New polling in Maine CD-2 is currently what I classify as the “Most Needed Poll” (followed be NE-2, NE-1, ME-1 and SD). Right now we don’t have enough polling evidence to show that CD-2 is actually Weak Clinton or Weak Trump rather than Strong Clinton, but given where Maine as a whole is, the ME-2 electoral vote has to be a possible pick up for Trump too, but it won’t be categorized that way here until there are enough polls backing that up directly.
National View
Before showing the new national trend chart and tipping point charts, a quick note. In addition to the new polls added in the most recent batch, I found a handful of older polls that I had somehow missed earlier in the year. These don’t change the current picture, but they change the past. Specifically, Trump’s position in the spring was significantly weaker than it looked at the time, mainly because Florida would have slipped out of his reach significantly earlier.
To be transparent on this change, rather than just show the new charts, I’ll show the before and after due to today’s update. First the trend chart as it appeared on Election Graphs as of the August 26th update post:
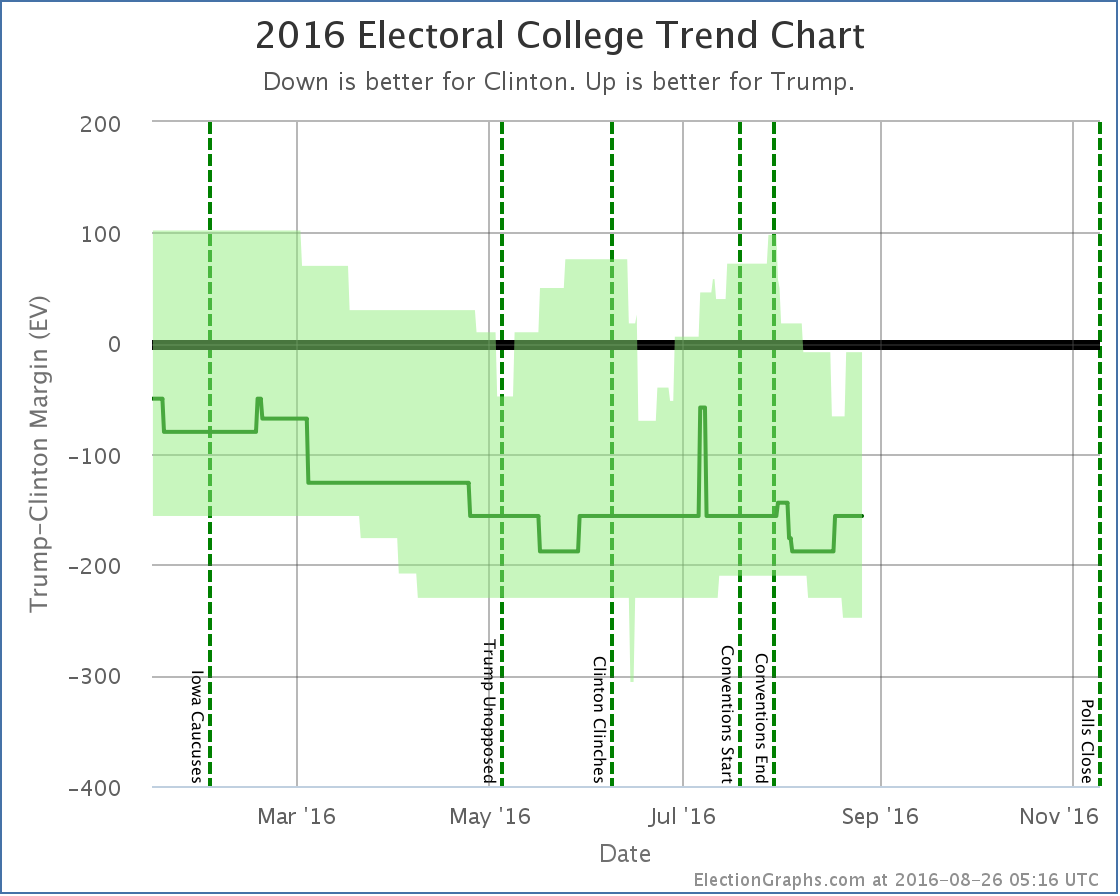
And here it is now:
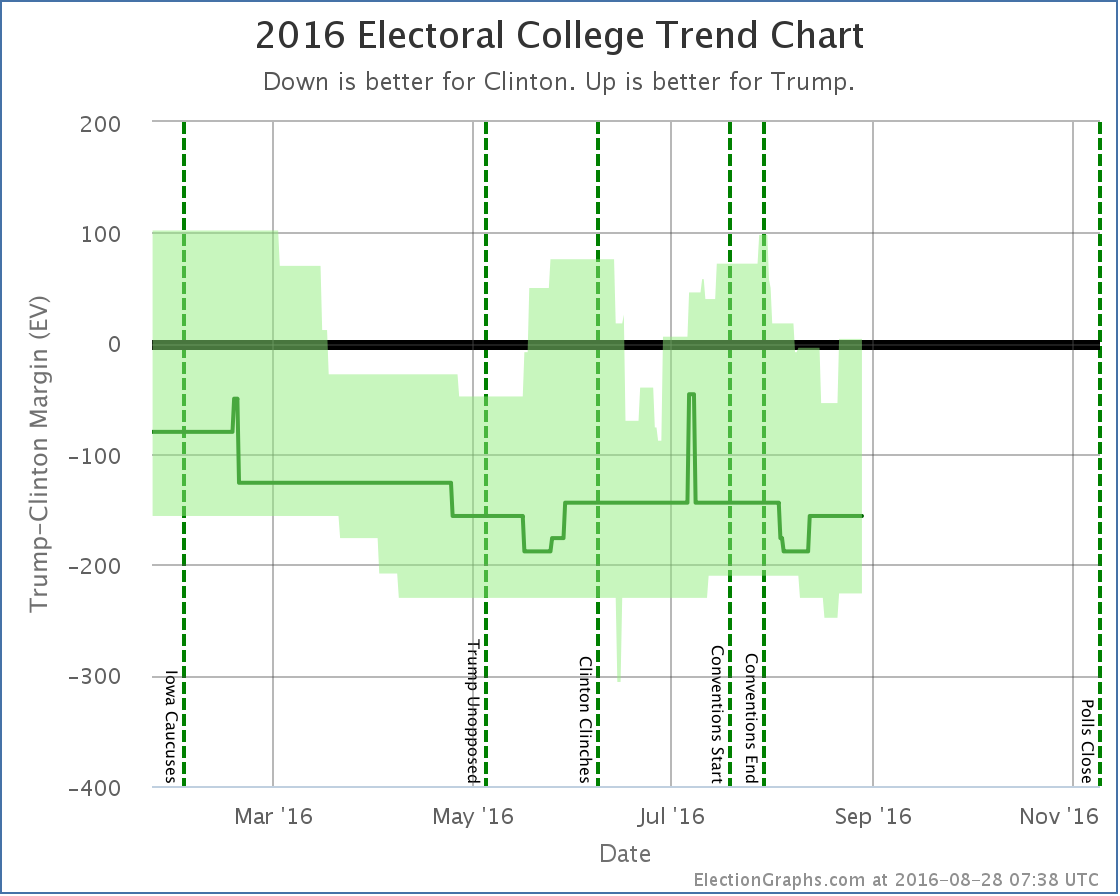
Note that in addition to the bumps upward in Clinton and Trump’s current best cases, Trump’s best case in the spring is significantly depressed, enough so that his best case moved from a narrow win in most of April to a narrow loss. There are some other subtle differences between these two caused by the addition of these old polls I had missed at the time, but that is the big one, caused essentially by one March poll in Florida that I did not see until August. Apologies for that.
The difference in the tipping point graph is even more dramatic, with Florida worse for Trump than it previously looked, there was a lot more room for the tipping point to wiggle, and it was a lot worse during the spring than it looked.
Here is the before picture of the tipping point graph from the August 26th update post:
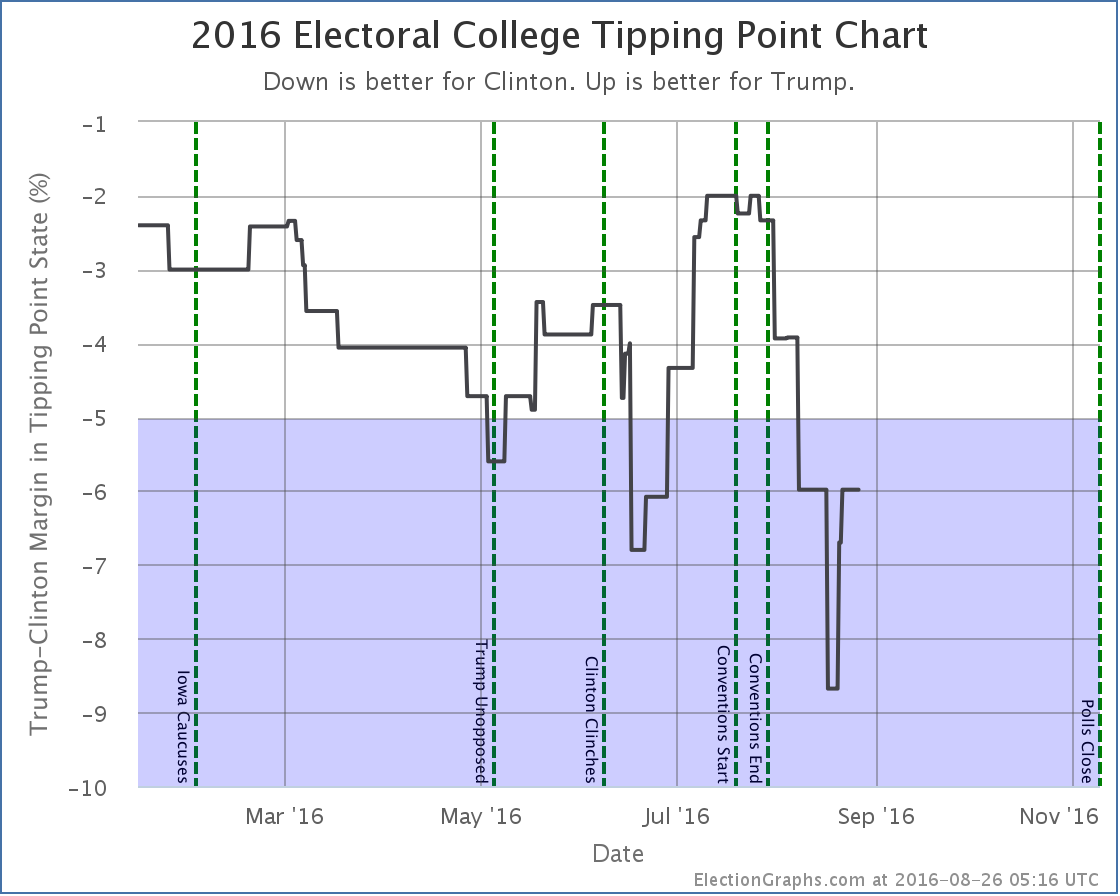
And here is the tipping point graph now:
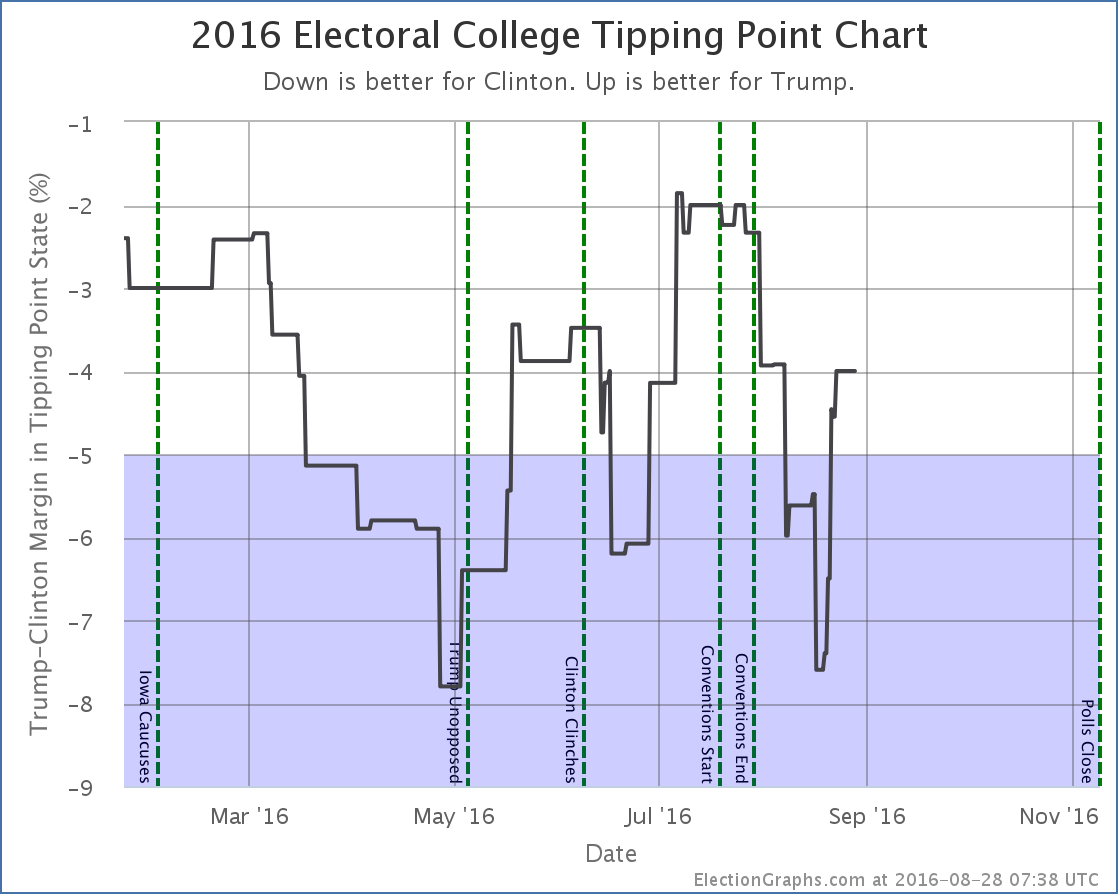
Again the main impact is that the “missing polls” that I added make it clear that Trump was significantly worse off in the spring than I had shown at the time. In fact, it means that at the end of April he was actually below his recent bottom in mid-August.
There were only a handful of polls missed, but this goes to show that even with poll averaging, individual polls in critical states can make a big difference in the overall picture. (Especially when they appear to be outliers, such as the one Florida poll I missed that made the biggest difference. Oops.)
OK, enough hand wringing about things that may have been missed in the spring.
The big current news on the tipping point is that with changes in the averages in Michigan, New Hampshire, and Ohio, the tipping point comes roaring back in Trump’s direction. In this update it moves from a 6.0% Clinton lead in Connecticut to a 4.0% Clinton lead in New Hampshire, but this is a full 3.6% swing toward Trump since his low of 7.6% about 10 days ago.
Now, everything above still shows a Trump loss, but it is looking a lot closer than it did a couple weeks ago. The first part of August was disastrous for Trump, but he has been bouncing back since then. He is still very far behind, but maybe his latest reworking of his campaign is working. His best case is once again to win, although by a very narrow 4 electoral vote margin.
Will the recent trend continue and make this race look even closer? 72.2 days left for him to do it.
Notice on Methodology: In my August 13th update I solicited opinions on possibly changing how this site deals with the case when a pollster releases multiple results from a single poll. See the discussion in that comment thread for more details. Immediately after this post goes live I will be working to change the site logic so that if two results are released from a poll, each counts as only half a poll for purposes of the averages here. Similar logic will apply to tracking polls where samples overlap, but not completely, with polls weighted to reflect the fraction of the new result that is actually from a fresh sample.
As examples of the impact this could have, the three states mentioned in this post would change as follows: Arizona is a 5.5% Trump lead (Strong Trump) with the current logic, it would be a 3.9% Trump lead (Weak Trump) with the new logic. New Hampshire would move from a 4.0% Clinton lead (Weak Clinton) to a 8.4% Clinton lead (Strong Clinton). Maine (All) would move from a 4.4% Clinton lead (Weak Clinton) to a 3.7% Clinton lead (Weak Clinton). With these three examples, two of the changes favor Clinton, and one favors Trump.
At this point I will not be adding new polls to the averages until the math changes are complete and I have reported on the results with a blog post. (Unless my revisions fail and I’m forced to reschedule for another weekend.)
[Note added 21:39 UTC – Actually, as I’m starting in, I realize that tracking polls have a bunch of extra complications that multiple results in a single poll don’t have, so I’ll leave them alone and treat them as if they were completely independent for now. Without weighting tracking polls, the changes above would now be: AZ Trump +5.5% -> Trump +3.1%, NH Clinton +4.0% -> Clinton +4.0% (No change), ME-All Clinton +4.4% -> Clinton +2.0%.]
Note: This post is an update based on the data on ElectionGraphs.com. Election Graphs tracks both a poll based estimate of the Electoral College and a numbers based look at the Delegate Races. All of the charts and graphs seen in this post are from that site. Additional graphs, charts and raw data can be found there. Follow @ElectionGraphs on Twitter or like Election Graphs on Facebook to see announcements of updates or to join the conversation. For those interested in individual general election poll updates, follow @ElecCollPolls on Twitter for all the polls as they are added. If you find the information in these posts interesting or useful, please consider visiting the tip jar.
States with new poll data since the last update: Tennessee, Arizona, Florida, Pennsylvania, Michigan, New Hampshire, North Carolina, Kentucky.
It looks like Trump’s last couple of bad weeks are starting to hit the state poll averages. In this update, we have model changes caused by the movement in three states. All three changes favor Clinton.
Going through them one by one…
Michigan [16 EV]
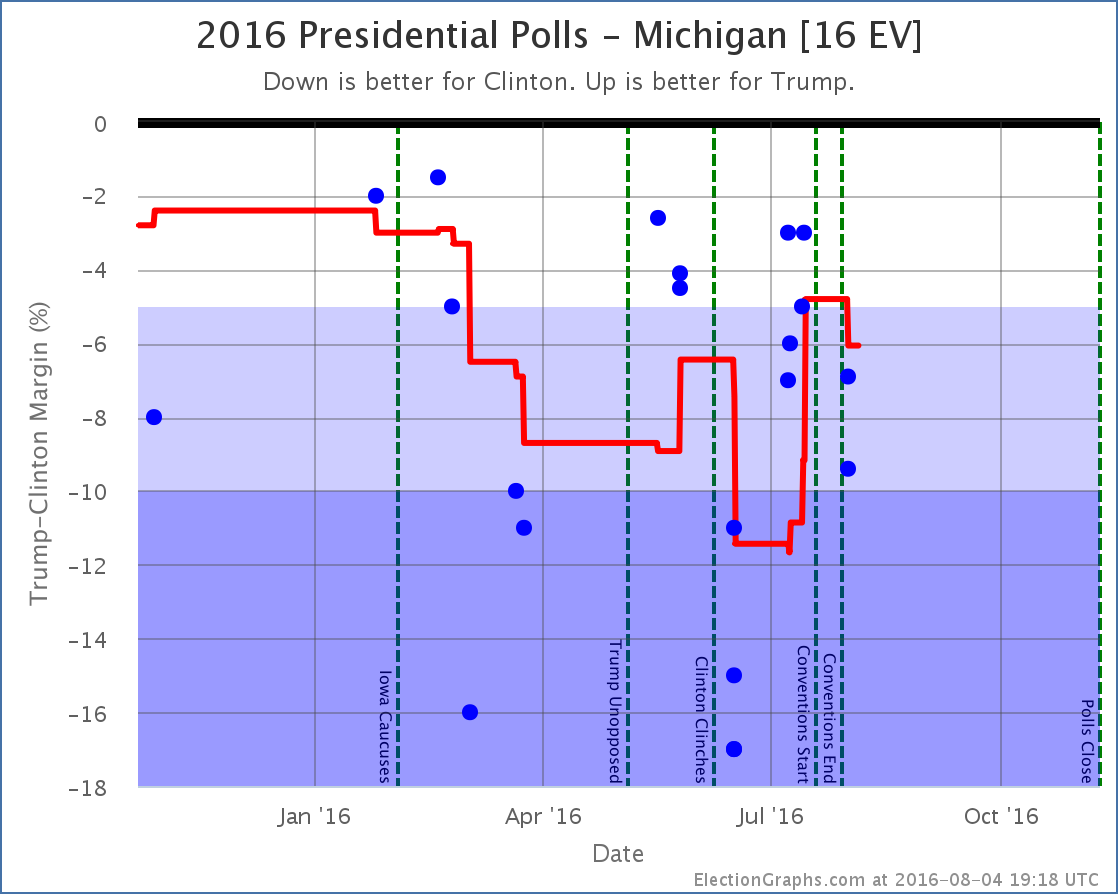
First of all, I will point out a new feature on these charts. There are now vertical dotted lines marking significant campaign events. Right now that is the Iowa caucuses, when the candidates won their primaries and the conventions. When/if debates happen, they will get marked as well. This is helpful in understanding the moves vs what may be going on in the campaign.
In Michigan specifically, you can see that Trump was gaining on Clinton in the run up to the conventions. The average popped up into the “close state” zone right before the conventions started. But with the first post-convention polls, Clinton’s lead increases again. She now has a 6.1% lead in Michigan, and the state is no longer included in Trump’s “best case”.
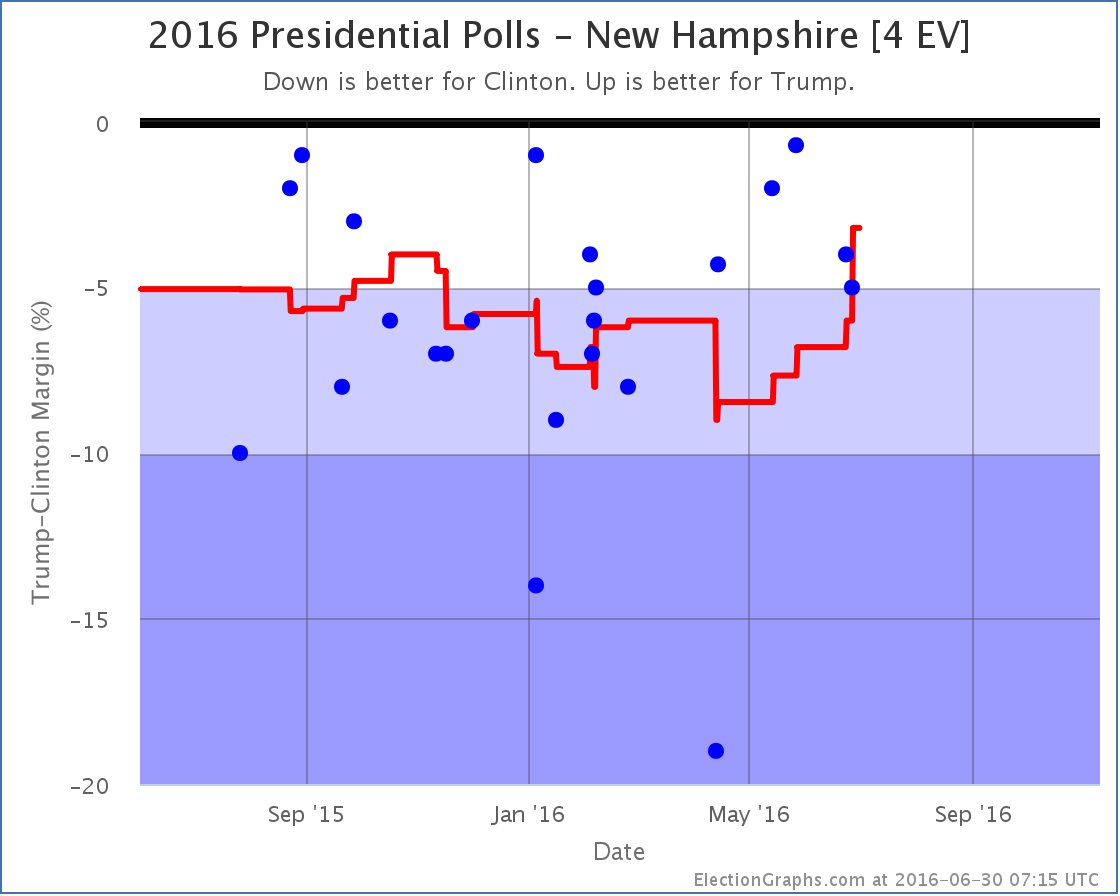
New Hampshire [4 EV]
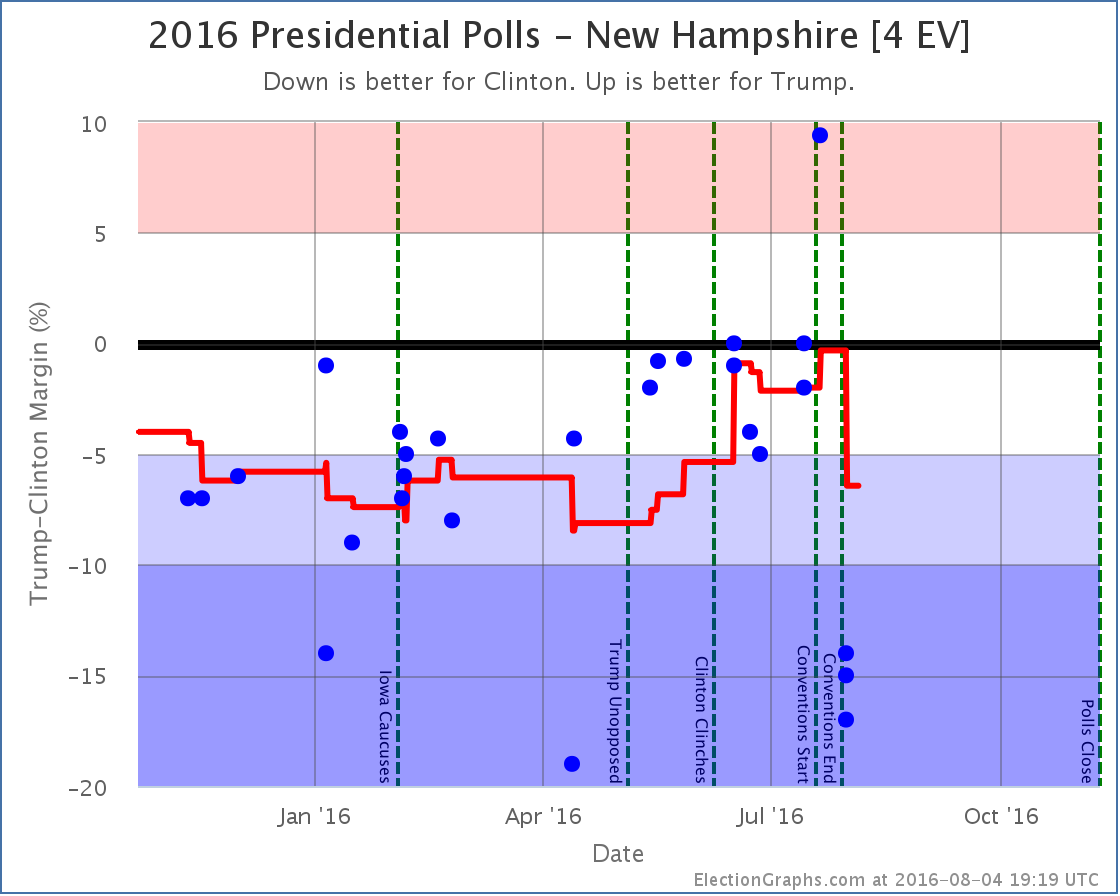
A poll taken during the Republican convention was the best result Trump has ever gotten in New Hampshire. This had moved the average to an very narrow 0.3% Clinton lead. The first results from after the Democratic convention on the other hand are some of the worst results Trump has seen in New Hampshire, and Clinton’s lead rises to 6.4%. So, like Michigan, New Hampshire is no longer looking like a possible Trump pick up. Since New Hampshire also moved past the tipping point, the tipping point also moved.
Now, both the Trump result during the Republican convention, and these new results look like outliers. Every other poll since May has been between a tie and Clinton +5%. So polls showing Trump up by 9.4%, or polls showing Clinton up by 17% should all be taken with a massive grain of salt. Given national trends some swing toward Clinton is expected, but we need to see more polls before concluding that the swing toward Clinton in New Hampshire is quite as large as the new polling indicates.* This is of course why we only look at averages rather than individual polls. The average moved quite a bit, but it doesn’t instantly snap to these new results. But it still moves enough to make a difference.
Florida [27 EV]
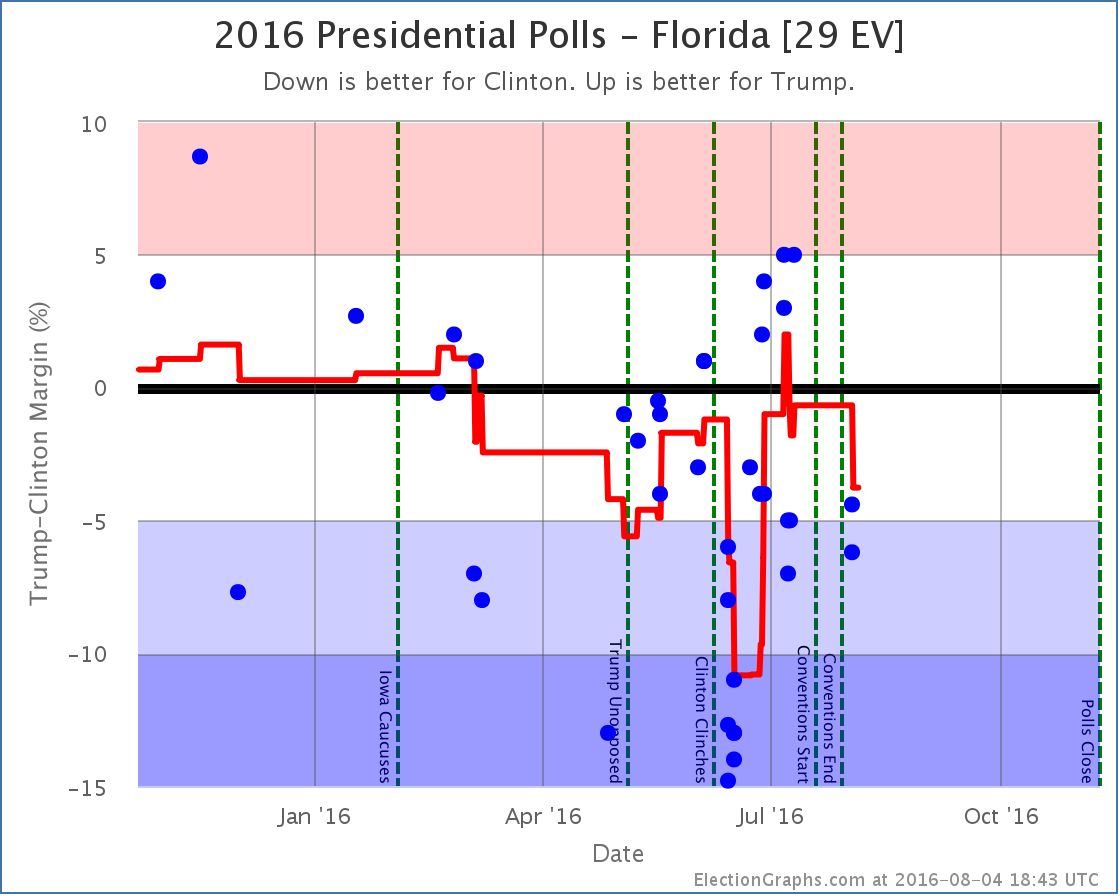
The first post-convention results in Florida move the average toward Clinton. Florida goes from a 0.7% Clinton lead to a 3.8% Clinton lead. No category change here. Florida is still weak Clinton, but since the average passes the tipping point, the tipping point gets shifted.
National View
With each of the three states that caused changes out of the way, time to look at the national picture.
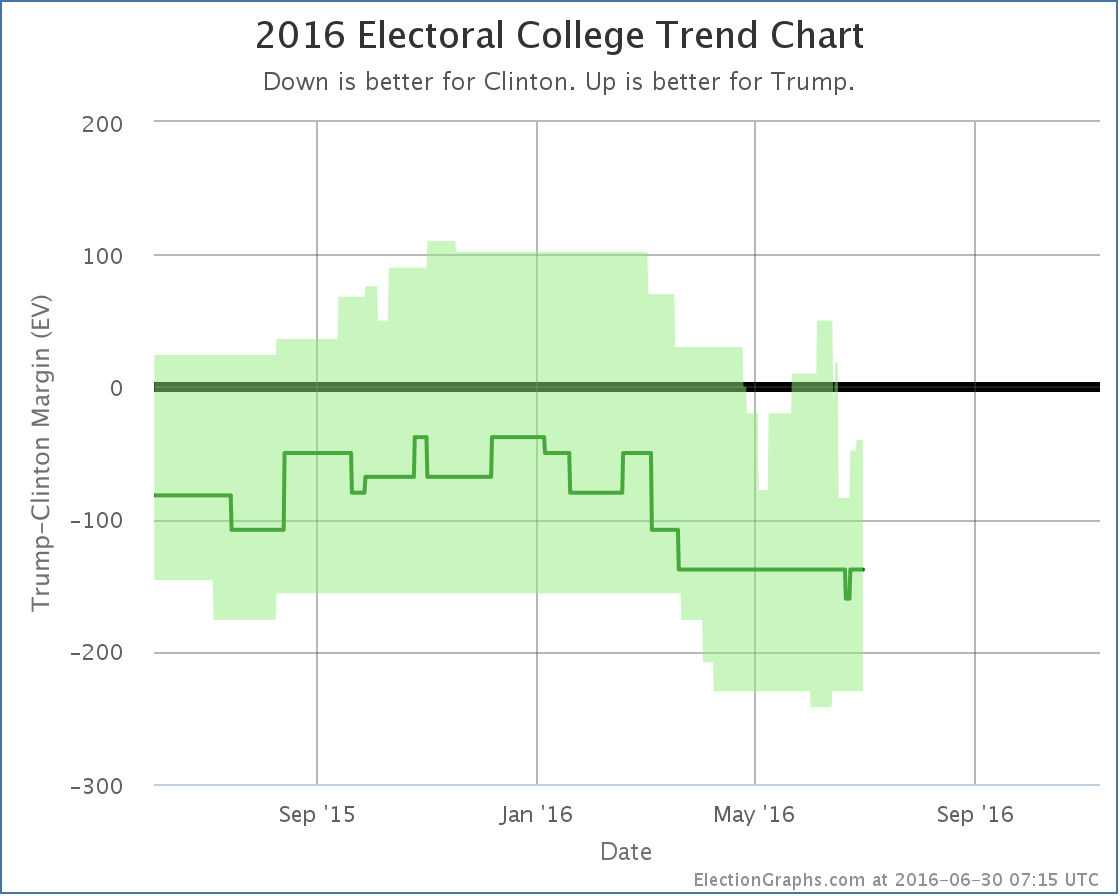
First the “bubble” showing the best and expected cases over time:
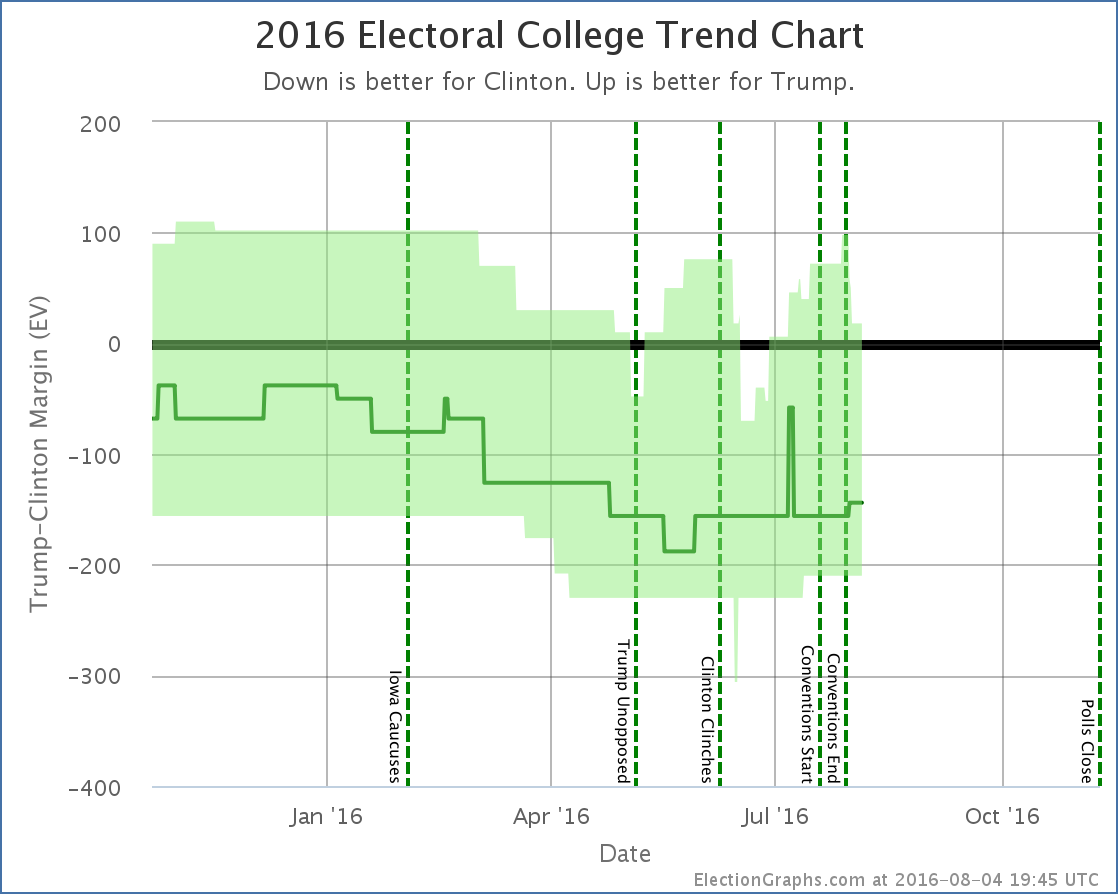
Right before the Democratic convention ended, Trump’s best case was up to winning by 98 electoral votes. Since then Pennsylvania, Michigan, and New Hampshire have slipped out of reach. His best case is now down to winning by only 18 electoral votes. He is one bad poll in Virginia, Florida, or North Carolina away from once again having his best case be a loss.
And with the movements in Florida and New Hampshire the tipping point moves dramatically as well:
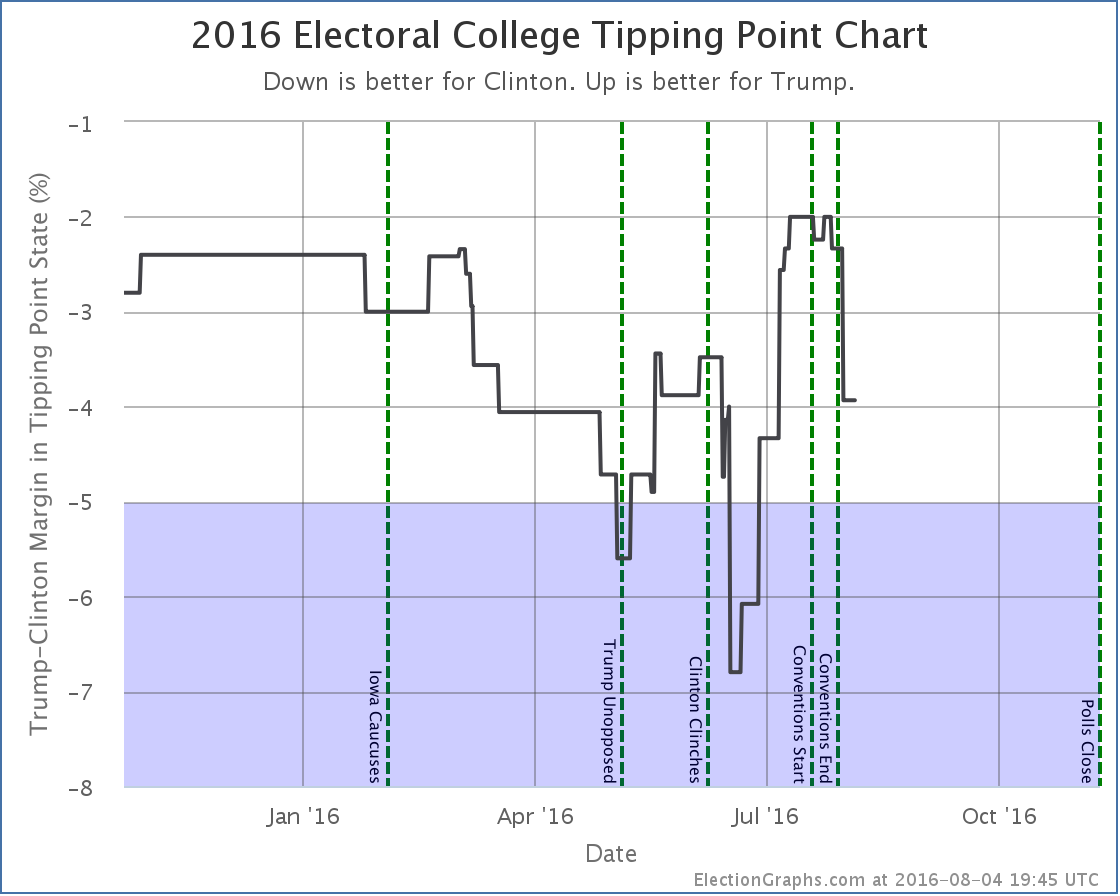
The tipping point margin… that is the margin in the state that would put the candidate “over the top” if you order the states by how strongly they support the candidates, moves from Clinton by 2.3% in North Carolina to Clinton by 3.9% in Virginia.
Before the conventions, Trump had dramatically improved his position in the tipping point. He was still losing, but by much less than before. He has now given up about 40% of the margin he gained.
A 3.9% tipping point margin… which is basically equivalent to the national popular vote margin, but adjusted for the structure of the electoral college… is still a close race. But not as close as it was before the conventions… and there are many close states that have not yet had post-convention polls.
Given where national polling is right now, once we do get more state polls, it would not be surprising to see Trump continue to drop in the short term.
95.7 days until the first polls start to close on election day.
* For the wonkiest of you out there: All three results showing Clinton up by double digits were from the same underlying WBUR poll sliced in different ways, so were not actually fully independent samples, so they don’t count as additional confirmation. This election cycle when I have a single poll that reports multiple results… just 2 candidates along side with 4 candidates, or registered voters and likely voters, or first response vs pushing leaners, I’m including ALL of the results rather than having some set of rules for picking only one. There are strong arguments for NOT doing this, specifically what I just mentioned about the results not being truly independent of each other, so you essentially end up giving more weight than you would otherwise to that pollster, simply because they reported their results in several different ways. I am simply defaulting to including everything on the theory that being more complete is better. I do understand the downsides though. I may decide to handle this a different way in 2020, but this is how it is for 2016. :-)
Note: This post is an update based on the data on ElectionGraphs.com. Election Graphs tracks both a poll based estimate of the Electoral College and a numbers based look at the Delegate Races. All of the charts and graphs seen in this post are from that site. Additional graphs, charts and raw data can be found there. Follow @ElectionGraphs on Twitter or like Election Graphs on Facebook to see announcements of updates or to join the conversation. For those interested in individual general election poll updates, follow @ElecCollPolls on Twitter for all the polls as they are added. If you find the information in these posts interesting or useful, please consider visiting the tip jar.
New polls since last update: North Carolina, New Hampshire, New Jersey, Washington
After yesterday’s mass of bad polls for Trump, today’s update brings a positive change for Trump in New Hampshire:
To be honest, this looks less like real moment, than the April poll by WMUR showing Clinton ahead by 19% being a fairly clear outlier and now rolling off the polling average. With that poll gone, the average moves to a 3.2% Clinton lead.
Without the outlier poll New Hampshire would have still been in the “Strong Clinton” category earlier this year. The presence of the outlier delayed the move to “Weak Clinton”, but New Hampshire is there now. There has yet to be a poll showing Trump actually ahead in New Hampshire, but there are plenty showing that it is close. So it is now considered as a possible Trump pick up, which improves Trump’s “best case”.
See the little bump at the top of the very right hand side of the “bubble”? That’s new Hampshire. Trump’s best case improves from losing by 48 electoral votes to only losing by 40 electoral votes.
New Hampshire aside, for the moment Trump remains pretty far behind. He has said that the “real campaign” won’t begin until after the convention. We’ll see soon enough.
17.9 days until the Republican Convention, 24.9 days until the Democratic Convention, 131.2 days until polls start to close on Election Day 2016.
Note: This post is an update based on the data on ElectionGraphs.com. Election Graphs tracks both a poll based estimate of the Electoral College and a numbers based look at the Delegate Races. All of the charts and graphs seen in this post are from that site. Additional graphs, charts and raw data can be found there. Follow @ElectionGraphs on Twitter or like Election Graphs on Facebook to see announcements of updates or to join the conversation. For those interested in individual general election poll updates, follow @ElecCollPolls on Twitter for all the polls as they are added. If you find the information in these posts interesting or useful, please consider visiting the tip jar.
Yeah yeah, Super Tuesday. Yeah, yeah, all the other states coming right afterwards. But we have new general election polls!
Since my last update there have been new polls in Michigan, New Hampshire and Kansas. From all of this, two major candidate pairs had changes to their summary status on my site. And this time, that includes the frontrunners:
Clinton vs Trump
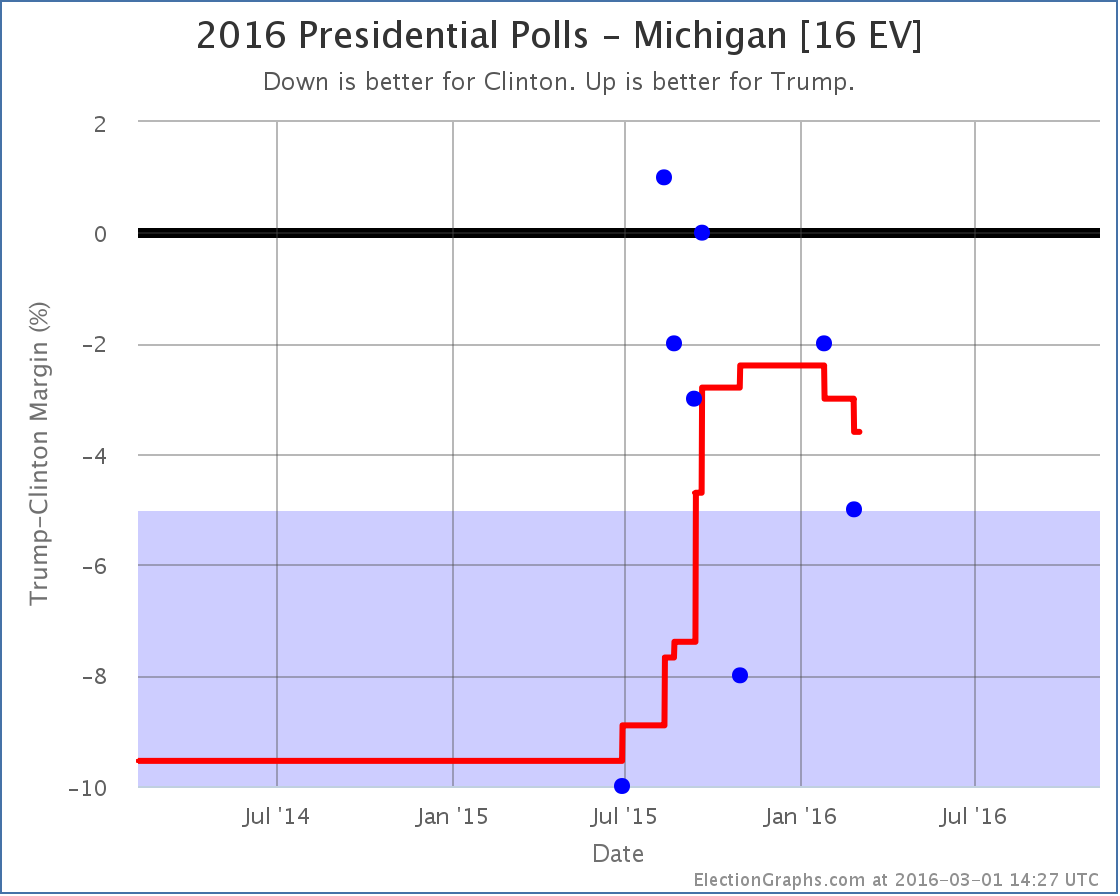
The categorization of Michigan did not change. “Weak Clinton” before, “Weak Clinton” now. But Michigan was the tipping point in Clinton vs Trump, so when Michigan moves, so does the tipping point:
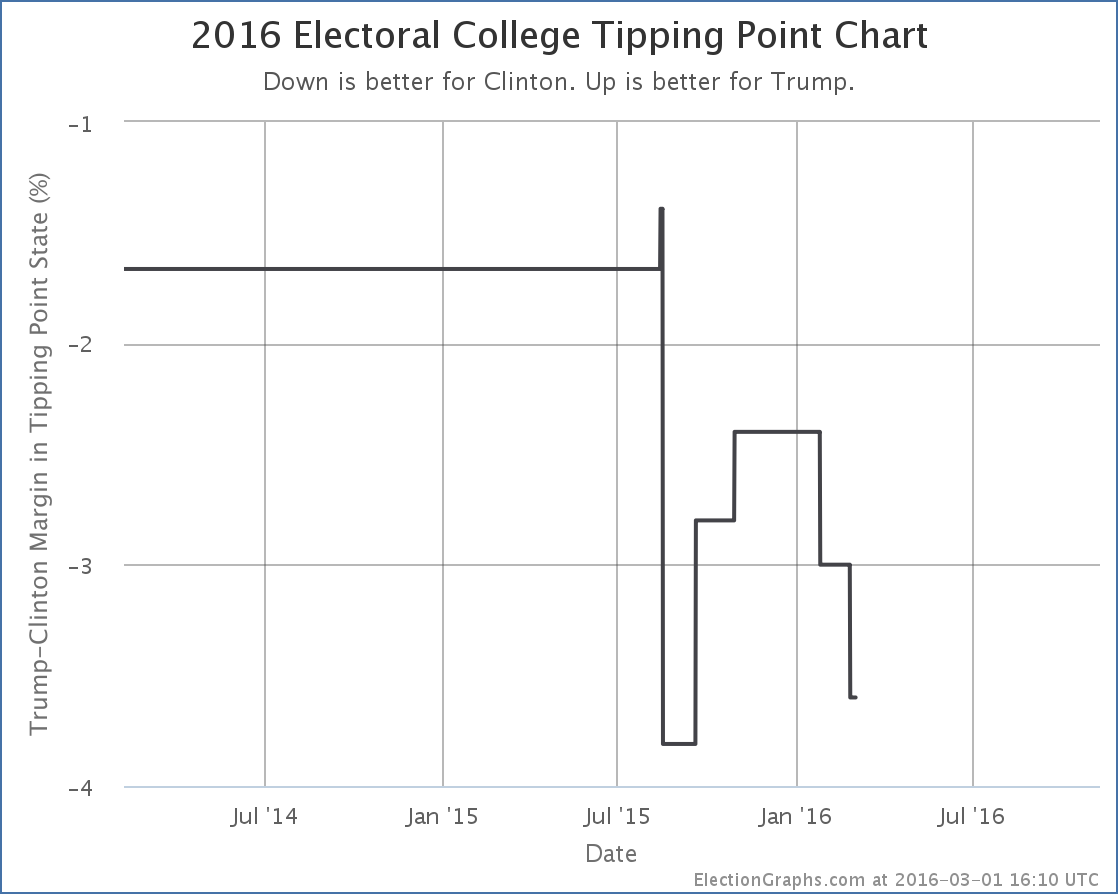
The tipping point moves from a 3.0% Clinton lead in Michigan to a 3.6% Clinton lead in Michigan. Either way, 3.6% is still a narrow lead. Only 1.3% of people changing their minds, or undecideds flipping the right way, would put Trump in the lead. The question is if we are now in a trend away from Trump in this metric, or if we are just bouncing around in a range as new polls jitter the averages. Too soon to tell. But once the primary races are both settled to the point where it is hard to deny the winners are the winners, we will start seeing an acceleration of general election polling, and we should start to see if there are really any trends here.
Clinton vs Rubio
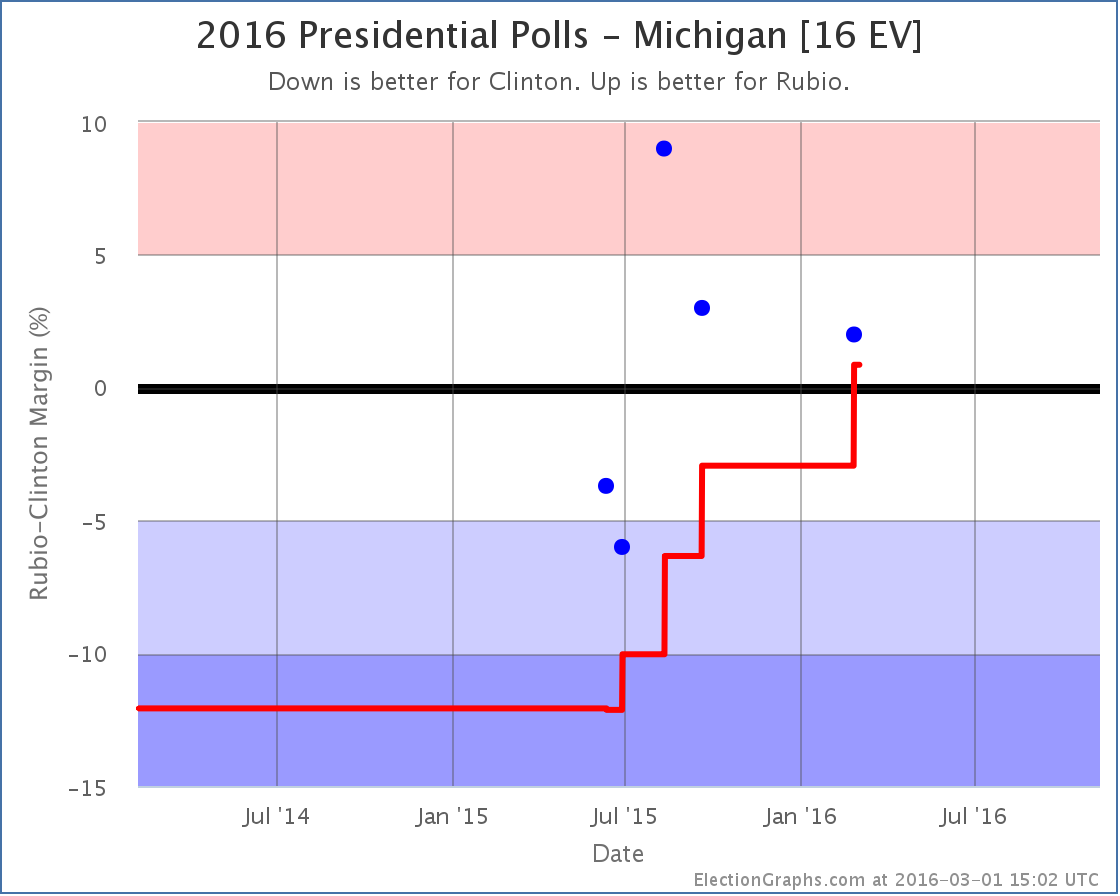
With the latest Michigan poll, Rubio leads in the poll average, which now shows a 0.9% Rubio lead. This moves Michigan from “Weak Clinton” to “Weak Rubio”. It is a close state that could easily go for either candidate, but with this change we move Michigan’s 16 electoral votes into Rubio’s column for the “expected” case where each candidate wins every state they are ahead in.
The move is extra significant this time because it actually puts Rubio over the top to win the whole shebang:
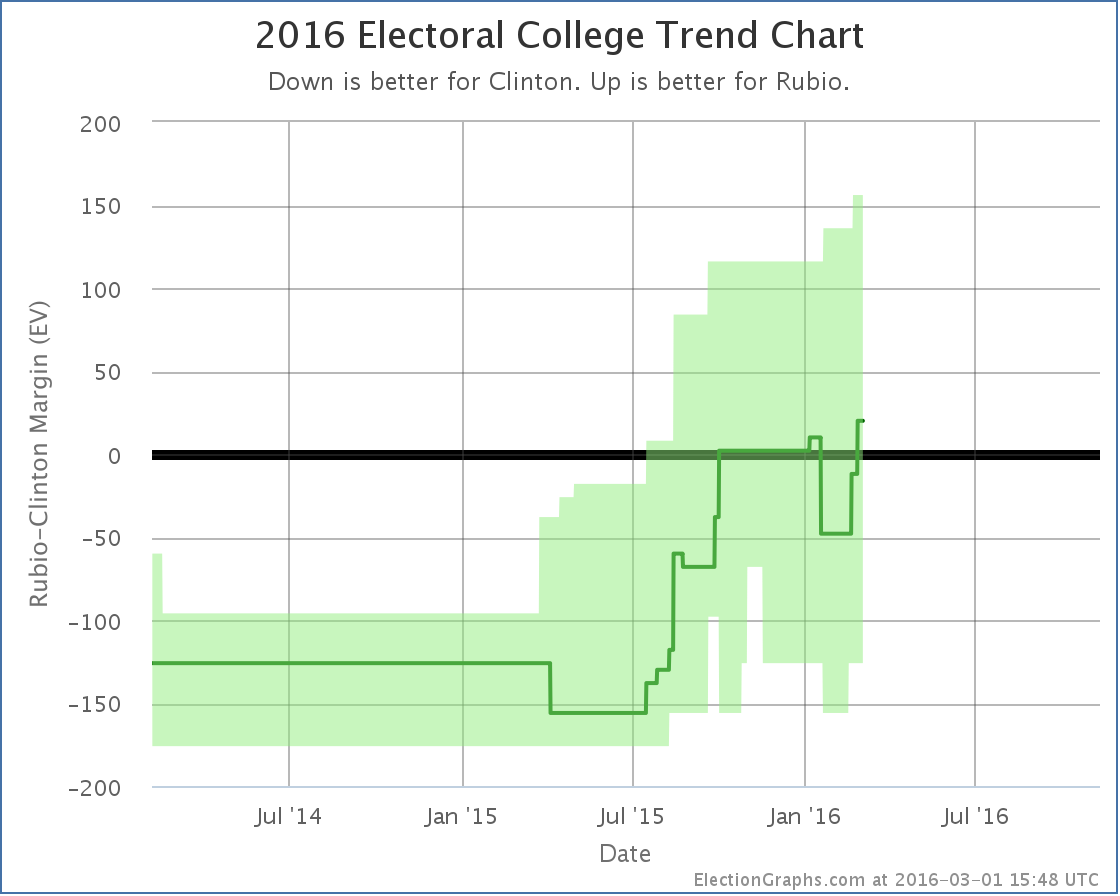
With this, the range of possible outcomes that seem reasonably possible is still everything from Clinton winning by 126 to Rubio winning by 156, but the expected result is now a Rubio win by 20 electoral votes.
This is also reflected in the tipping point:
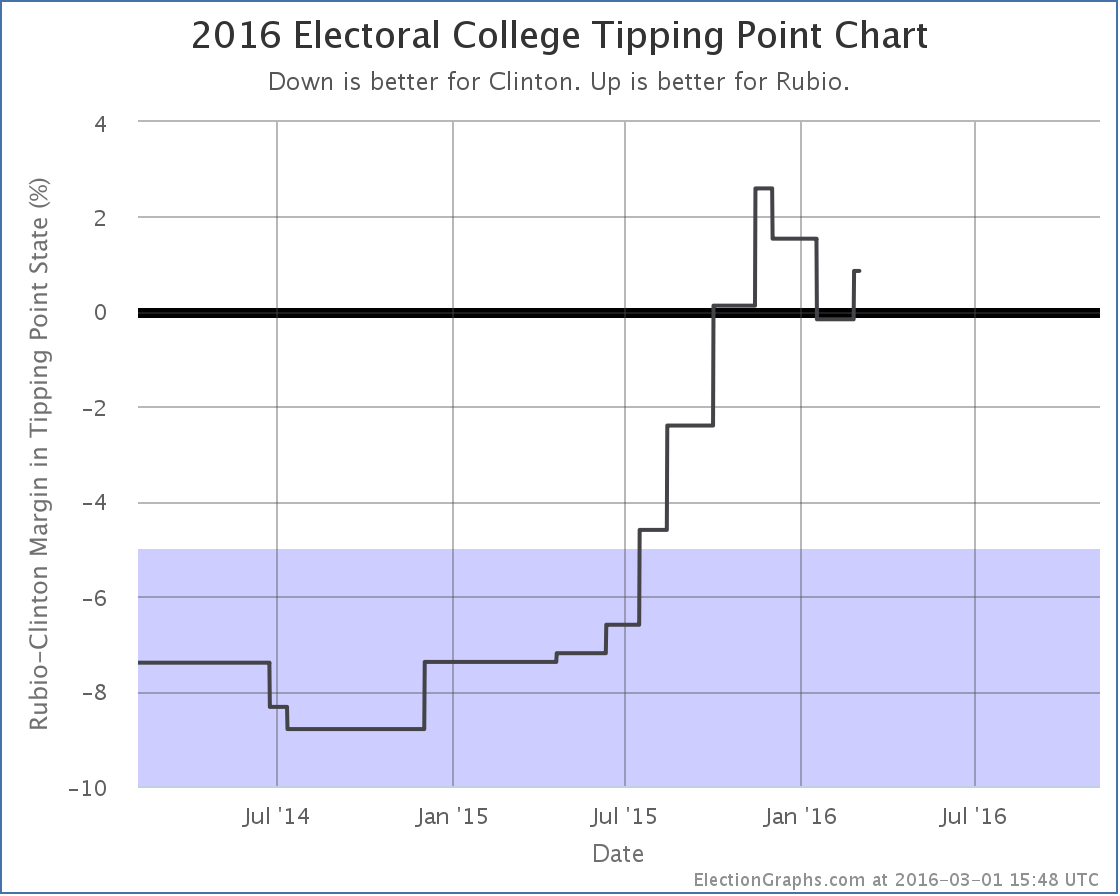
The tipping point moves from Florida, where Clinton led by 0.8%, to Michigan where Rubio is now ahead by 0.9%.
Clinton vs Rubio remains a very close race. But Rubio now has a small advantage.
Others
Clinton vs Kasich is neither a front-running pair, or in the top five best polled combinations, so I won’t consider it fully here other than to note that the latest New Hampshire poll moved Kasich into the lead, changing his expected case from losing to Clinton by 46 electoral votes, to losing to Clinton by 38 electoral votes.
252.2 days until polls start to close on Election 2016.
Note: This post is an update based on the data on ElectionGraphs.com. Election Graphs tracks both a poll based estimate of the Electoral College and a numbers based look at the Delegate Races. All of the charts and graphs seen in this post are from that site. Additional graphs, charts and raw data can be found there. All charts above are clickable to go to the current version of the detail page the chart is from, which may contain more up to date information than the snapshots on this page, which were current as of the time of this post. Follow @ElectionGraphs on Twitter or like Election Graphs on Facebook to see announcements of updates or to join the conversation. For those interested in individual general election poll updates, follow @ElecCollPolls on Twitter for all the polls as they are added.
This week on Curmudgeon’s Corner Sam and Ivan talk about chickens! Just kidding. Of course they talk about Election 2016. New Hampshire. Sanders beating Clinton. Trump walking all over the other Republicans. The log jam at second place on the Republican side. What this means for the delegate race and the next couple of states on both sides. Everything you would expect! Then they wrap it up with a lightning round for some thoughts on the Zika virus, changes on Twitter, the Oregon standoff, and more!
Click below to listen or subscribe… then let us know your own thoughts!

Recorded 2016-02-11
Length this week – 1:39:01
 1-Click Subscribe in iTunes 1-Click Subscribe in iTunes
 View Podcast in iTunes View Podcast in iTunes
 View Raw Podcast Feed View Raw Podcast Feed
 Download MP3 File Download MP3 File
 Follow the podcast on Facebook Follow the podcast on Facebook
Show Details:
- (0:00:10-0:16:41) Intro
- Pi Again
- Agenda
- Ivan’s Rough Day
- Sam’s Upcoming Trip
- (0:17:26-0:55:16) Election 2016: Republicans
- New Hampshire Results
- Upcoming contests
- Rubio’s debate crash
- Kasichmentum?
- Who drops out and when?
- Gaming out South Carolina
- anti-Trumps running out of time
- Trump moving to center?
- Trump/Sanders Swing Voters
- Fighting each other instead of Trump
- Carson in South Carolina!
- (0:56:25-1:19:52) Election 2016: Democrats
- No Surprise
- Delegate Story
- South Carolina and Nevada
- What is the path for Sanders?
- Clinton indictment?
- Sanders/Clinton demographics
- Independents
- Sam’s Choices
- Santorum iSideWith
- (1:20:41-1:38:40) Lightning Round
- Book: Prince Caspian
- Zika Virus
- Twitter Changes
- Ivan iSideWith
- Oregon Standoff
I mentioned yesterday that the delegate totals were provisional and the counting wasn’t done yet. The counting is complete now, and in addition there have been some clarifications to the delegate allocation rules.
First on the rules, the way in which rounding is done was clarified. Instead of just rounding at the end, the percentages are rounded to a whole number first, and then the delegates are rounded to whole numbers at the end. This is a bit of a silly way to do it, because you are introducing the rounding distortion twice instead of just once, but that’s how New Hampshire chose to do it.
Then a rule change that affects not just New Hampshire, but all subsequent states too. Frontloading HQ has the scoop. The bottom line is that national RNC party rules changes are overriding rules at the state level about what happens to the three “automatic delegates” in each state. These are the National Committeeman, the National Committeewoman, and the chairman of the state Republican Party who all get to be delegates “automatically” based on their positions. In some states they were bound by primary or caucus results. In some states they were required by the rules to stay neutral. But in others, they were free agents. In the past the ones that were free agents had been the Republican party’s equivalent of the Democratic superdelegates. But the RNC national rule change is requiring these three automatic delegates to always be “bound” by the same rules that cover at-large delegates in each state.
So, essentially, no more superdelegates on the Republican side. All delegates will be bound by primary or caucus results. (There is still an exception for delegates who are directly elected by their own name apparently, but that is rare.)
For New Hampshire, when you consider final vote totals, and both rule clarifications, this changes the results from the primary from:
11 Trump, 3 Kasich, 2 Bush, 2 Cruz, 2 Rubio, 3 TBD
to:
10 Trump, 4 Kasich, 3 Bush, 3 Cruz, 3 Rubio, 0 TBD
The updated raw delegate chart showing this change is here:
The net result here is Trump loses one delegate, Cruz, Rubio, Kasich and Bush all gain one.
Trump is still clearly in the lead, but it does change his New Hampshire results in an important way. 11 out of 20 delegates was a majority, and above the threshold he needed to improve his “% of remaining delegates needed to win” number. 10 out of 23 is not a majority, and was not enough to improve his position on that metric:
If you look at full movement from before New Hampshire to these updated results, you can see that ALL of the candidates now got worse, as none of them got the level of delegate support needed to be on track for an outright win. Trump specifically went from needing 50.37% of the remaining delegates, to now needing 50.43% of the remaining delegates. This is much less of a change than the others of course, but it still went up.
So the statement I made in yesterdays update that “if Trump continues to match New Hampshire, he wins” is no longer true. If Trump (and the rest) continue to match New Hampshire, we are in for a contested convention.
Of course, we won’t see New Hampshire cloned in the subsequent states. We will see continued developments in the campaigns, more candidates drop out, and a very dynamic race continue to play out.
And fundamentally, the one delegate difference in Trump’s total doesn’t change the over all picture all that much.
I won’t repeat the details of yesterday’s post walking through scenarios for South Carolina and Nevada. If you haven’t already, go read it.
The bottom line is that unless there is a major change before South Carolina, it is very plausible that Trump walks out of it with a significant delegate lead. Updating for the New Hampshire changes above, that could look something like:
67 Trump, 11 Cruz, 10 Rubio, 15 Others
Nevada is more proportional, but will still give Trump a further opportunity to increase his delegate lead. Absent a surprise loss in South Carolina, he will almost certainly have a majority of the delegates allocated by then.
At that point, only 5.4% of delegates will have been decided. Lots of delegates left to play with.
But that is when things speed up. If the non-Trumps are going to consolidate support by all but one or two dropping out, it really should happen by the end of February, because 25.8% of the delegates will get decided on March 1st. And then another 30% or so in the two weeks between that and March 15th. When we pass March 15th, 60% or so of the convention delegates will have been decided.
If the anti-Trumps consolidated before then, it is possible that one of them will be leading instead of Trump. If the anti-Trumps are still divided though, then if Trump has managed to get over 50%, he’s almost certainly going to be the nominee. If he is leading, but under 50%, then talk of a contested convention becomes real, not just news junkie fantasy.
Absent the oft-predicted but never realized Trump collapse, for any of the other Republicans to beat Trump, all but one (MAYBE two) need to drop out and drop out quickly, and then they need to focus all of their effort on Trump. But for the moment, all the anti-Trumps are still squabbling with each other, leaving Trump to consolidate a lead while they are for the most part continuing to ignore him.
That is just a formula to anoint Trump. At some point people will drop out, and the race will narrow. The question is does it happen in time for whoever is the surviving anti-Trump to have a real chance.
Note: This post is an update based on the data on ElectionGraphs.com. Election Graphs tracks both a poll based estimate of the Electoral College and a numbers based look at the Delegate Races. All of the charts and graphs seen in this post are from that site. Additional graphs, charts and raw data can be found there. All charts above are clickable to go to the current version of the detail page the chart is from, which may contain more up to date information than the snapshots on this page, which were current as of the time of this post. Follow @ElectionGraphs on Twitter or like Election Graphs on Facebook to see announcements of updates or to join the conversation. For those interested in individual general election poll updates, follow @ElecCollPolls on Twitter for all the polls as they are added.
[Edit 2016-02-14 06:18 UTC to add end note.]
New Hampshire’s delegate rules are such that the winner gets a big bonus. (The details of how this works were discussed here last week.) So Trump’s approximately 36% of the vote turns into 55% of the delegates. Counting isn’t actually done yet, but if current trends hold, the delegate haul out of New Hampshire will be:
Trump 11, Kasich 3, Bush 2, Cruz 2, Rubio 2.
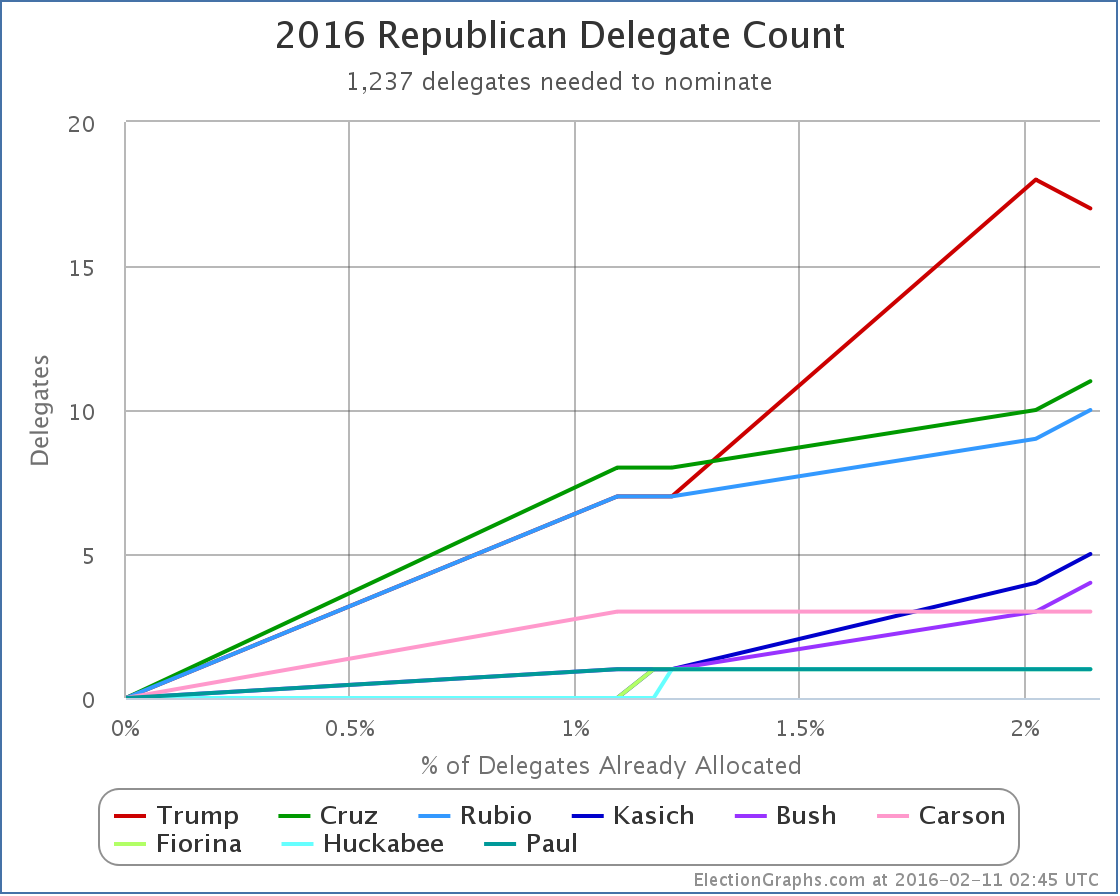
Adding these to the previous results in Iowa, and we have these new totals: Trump 18, Cruz 10, Rubio 9, Kasich 4, Bush 3, Carson 3, Fiorina 1, Huckabee 1, Paul 1.
In the form of a graph of the total delegates, we see this:
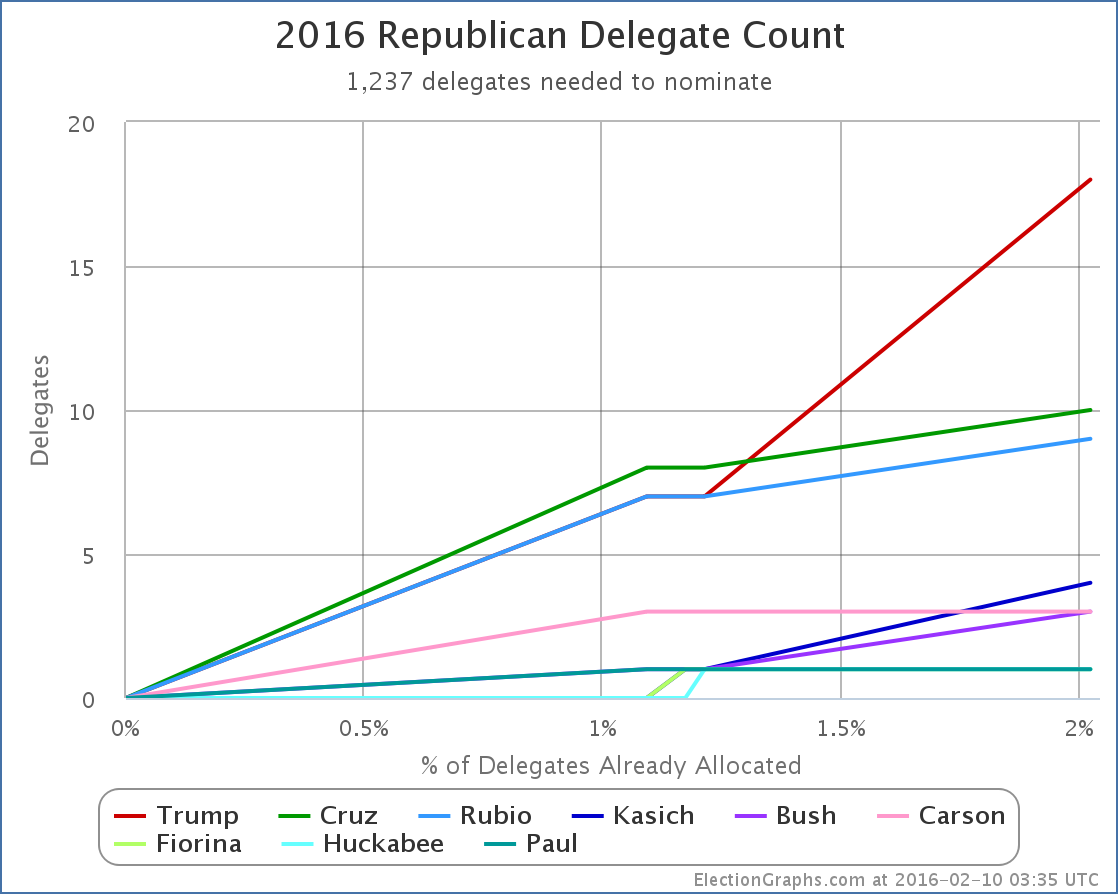
Some groupings look apparent on this chart.
Trump is out by himself in the lead.
Cruz and Rubio make up a second tier, at about half of Trump’s level.
Kasich, Bush and Carson are the third tier. Way behind, but at least with multiple delegates.
Then finally Fiorina, Huckabee and Paul bringing up the rear with one delegate each. Two of these three have already dropped out. It will be surprising if the third does not do so soon.
How does this match what we’re hearing in the spin out of New Hampshire? Well, there is wide acknowledgment that Trump did have a nice win. But the majority of the attention still seems to have been on the race for second, and how that positions the anti-Trumps going forward.
Within that, relatively little attention was paid to Cruz, and he is still in 2nd. Rubio is being dismissed because he did badly in New Hampshire, but he is still in 3rd over all. Meanwhile lots of attention given to Kasich and Bush, but they are still stuck in the third tier with Carson with less than a handful of delegates.
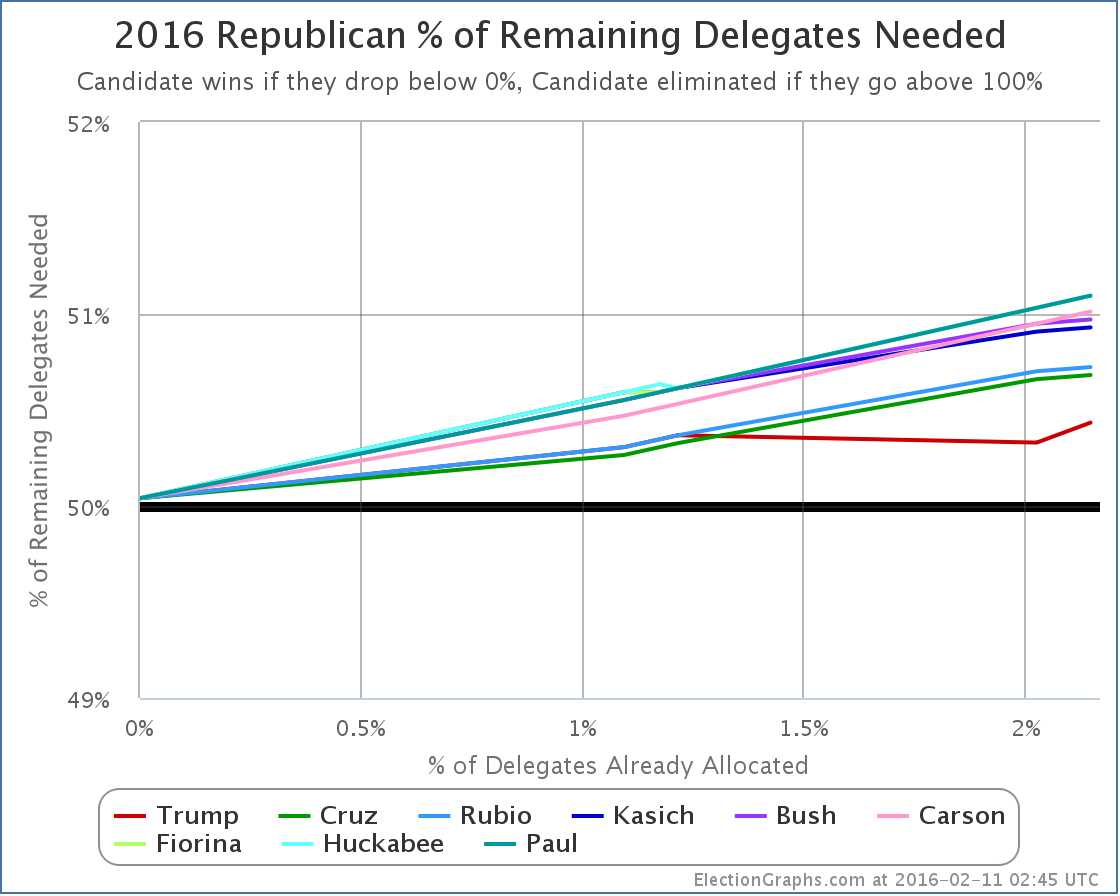
Time to flip this and look at this in terms of my favorite metric, the “% of remaining needed to win”:
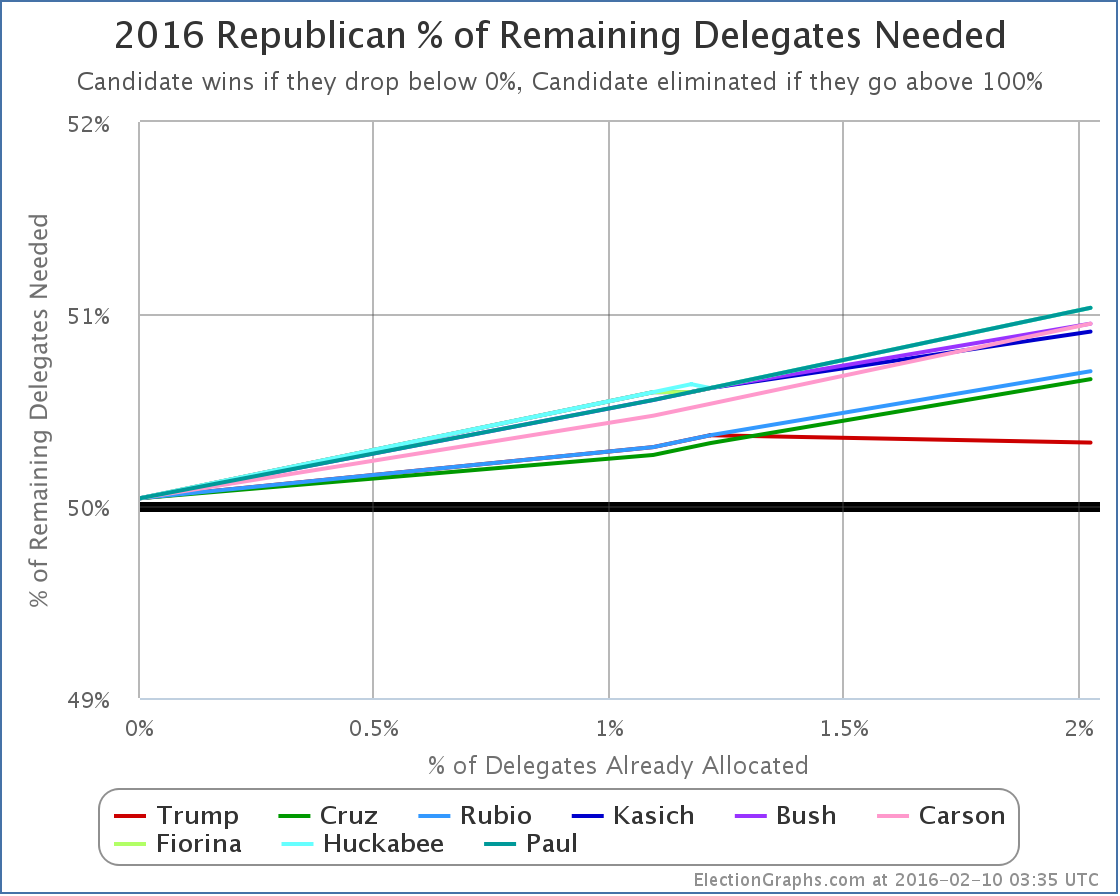
Trump exceeded the 50.37% of the delegates he needed to get to improve his position. Going forward he needs 50.33% of delegates to be on a pace to win. That is a relatively small change. With almost 98% of delegates still to be determined, there is a huge amount of flexibility available here to all the candidates.
Given that Trump got 55% of the delegates in New Hampshire, that means however that NONE of the other candidates got what they needed, or even close. Essentially, every one of the non-Trump candidates fell further behind today.
Now, Trump still doesn’t have a majority of delegates. To be on a pace to actually win, rather than just to have the most delegates going into the convention, he needs to do better than he has so far. But he is far closer to that mark than any of the other candidates. And if he continues matching his New Hampshire results, he will win.
The story here continues to be that while Trump hasn’t managed a majority in any contest so far, the opposition is so divided that Trump still easily wins (New Hampshire) or at the very least comes very close (Iowa). Does this continue? Does it get worse?
Time to look at the next contest on the Republican side, South Carolina.
There have not been any South Carolina polls since before Iowa, so new polls are eagerly anticipated, but at the moment the RCP average has Trump at 36.0%, Cruz at 19.7%, Rubio at 12.7%, Bush at 10.0% and then everybody else.
Now, that may change. Specifically if either Rubio or Bush drop out that will scramble things a bit. But that may not happen. There is a case to be made for both of them sticking in at least through South Carolina.
Trump probably wins this. But by how much? Time to look at the delegate rules in South Carolina.
From Greenpapers:
- 21 district delegates are to be allocated to presidential contenders based on the primary results in each of the state’s 7 congressional districts: each congressional district is assigned 3 National Convention delegates and the presidential contender receiving the greatest number of votes in that district will receive all 3 of that district’s National Convention delegates. [Rule 11(b)(4)]
- 26 (10 base at-large delegates plus 16 bonus delegates) at-large delegates are to be allocated to the presidential contender receiving the greatest number of votes in the primary statewide. [Rule 11(b)(5)]
- 3 party leaders, the National Committeeman, the National Committeewoman, and the chairman of the South Carolina’s Republican Party are pledged to the presidential contender receiving the greatest number of votes in the primary statewide.
If Trump wins by any margin, no matter how small, he gets 29 of the 50 delegates right up front. That already would give him 47 of the 100 delegates that would have been allocated in Iowa + New Hampshire + South Carolina.
Of course, in order to win the whole state, he would have had to have won some of the congressional districts too. Probably most of them. And so far in Iowa and New Hampshire, it doesn’t seem like there has been a lot of geographic lumpiness to Trump’s support. So he may well win ALL of the congressional districts. In that case Trump would walk out of South Carolina with all 50 of the available delegates. This is very possible.
In that scenario, after South Carolina, the overall delegate count would look like: Trump 68, Cruz 10, Rubio 9, Others 13
Trump would have a huge delegate lead. Even if he doesn’t win all 50, he will still have a very large delegate lead.
Nevada is three days after South Carolina. It is proportional, not semi-winner-take-all like South Carolina, but the latest polls still have Trump with a nice lead in Nevada. Those polls are old and out of date, but does anybody think two straight wins would hurt Trump’s position?
To “stop Trump” things have to move very quickly to a one on one with Trump vs Somebody. Maybe a three way race could do it, but might just be a recipe for a contested convention. But as long as we’re still looking at four or five candidates splitting the non-Trump vote, Trump wins.
But the non-Trumps still seem to be in a locked battle with each other for that anti-Trump one on one slot. And in doing so, they just let Trump win. The race will of course consolidate further. More candidates will drop out. Some may drop out before South Carolina. But it is unclear if that will be enough to let one of the others actually win in South Carolina.
Trump won New Hampshire. Trump looks like he will probably win the next two states. Things get more complicated once we get into March, but Trump would get there with a substantial lead.
Things are by no means settled yet. There is a long way to go. Even after we get past both South Carolina and Nevada 94.6% of delegates will still be up for grabs. There will still be time for the non-Trumps.
But if we only get consolidation down to 2 or three candidates after the March 1st contests, when 25.8% of the total delegates will be decided, the non-Trumps that are left may have a really tough uphill fight to catch up.
If consolidation doesn’t happen until after March 15th, 60% of the delegates will already have been decided, and it may just be too late. (Although if several non-Trumps are still strong at that point and Trump has the lead but not a majority, we’re looking at a contested convention, and that starts getting into completely different scenarios.)
But if the non-Trumps want to actually win, they have to stop fighting each other, some of them have to drop out, and they have to actually act like Trump is the frontrunner, and that their priority has to be bringing him down rather than each other. Otherwise they are done, and Trump ends up walking away with this.
Note: This post is an update based on the data on ElectionGraphs.com. Election Graphs tracks both a poll based estimate of the Electoral College and a numbers based look at the Delegate Races. All of the charts and graphs seen in this post are from that site. Additional graphs, charts and raw data can be found there. All charts above are clickable to go to the current version of the detail page the chart is from, which may contain more up to date information than the snapshots on this page, which were current as of the time of this post. Follow @ElectionGraphs on Twitter or like Election Graphs on Facebook to see announcements of updates or to join the conversation. For those interested in individual general election poll updates, follow @ElecCollPolls on Twitter for all the polls as they are added.
Lets jump right to it. In the last Democratic update we mentioned that to actually improve the “% of remaining needed to win” Sanders needed to get 54.36% of the delegates available in New Hampshire. That would be 14 out of 24 delegates that were available today. He got 15 out of 24, or 62.5% of yesterday’s delegates. So he did it!
In addition, since my last update, there were some superdelegate changes. The net change from those was +1 Clinton, +1 Sanders. There was also a net reduction of 1 available delegate, bringing the total number of Democratic delegates down to 4,763.
With all of that in place, here is the new chart for “% of remaining needed to win”:
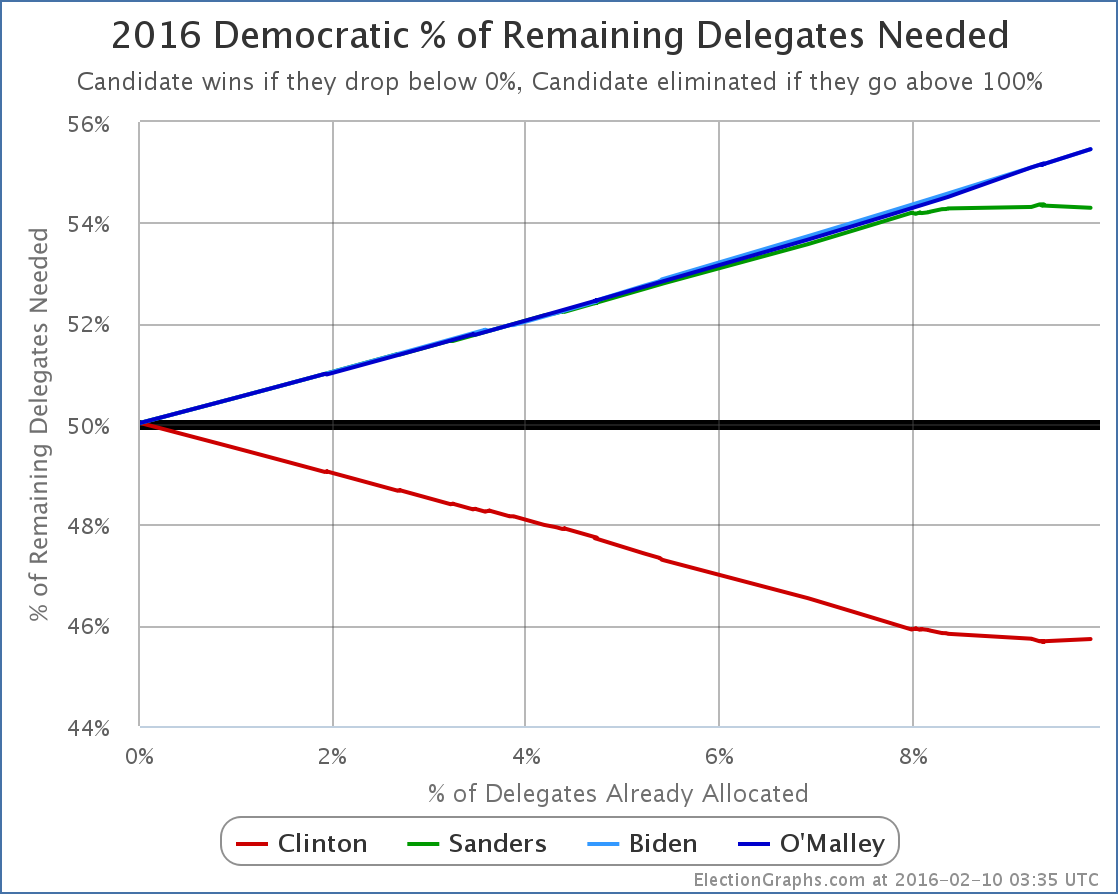
The Sanders % Needed has indeed gone down, and he made Clinton’s go up!
Sanders’ % Needed specifically moved from 54.36% to… 54.30%.
This was at 54.22% before Iowa. 54.30% matches where this was right after Iowa.
So, Sanders did improve his situation, but only enough to undo the superdelegate changes that happened after Iowa, not enough to get back even to where he was before the voting started.
Another way to look at this is to just look at New Hampshire itself. Of delegates allocated by the Primary, Sanders got 15 delegates to Clinton’s 9. But New Hampshire also has 8 superdelegates, and 6 of these had already declared for Clinton.
So the actual New Hampshire total as of today is 15 Clinton, 15 Sanders, 2 TBD.
So even with his big win, which was indeed a big win, Sanders actually has only pulled even in delegates in the state.
Now, of course, superdelegates can change their mind. It has been said that if one candidate was clearly leading absent superdelegates, the superdelegates would not go against them, and would start to change their minds and flip to the candidate leading in non-super delegates. Maybe. It could happen. And if it does, that movement will be tracked here. Certainly no such movement has been seen yet.
In the mean time, next up for the Democrats is Nevada on February 20th. Nevada often gets relatively little attention compared to South Carolina, but Nevada will actually be the next place where we see if Sanders is able to take his New Hampshire results and build anything longer term out of it.
Nevada is a caucus state, so delegates won’t actually be allocated on the 20th, but there will be results that can be used to estimate convention delegates. Nevada has 43 delegates. Of those 8 are superdelegates. Clinton already has 3 superdelegates in her column, Sanders has 1. Nevada’s caucuses will determine 35 delegates. 23 will be allocated based on results in the 4 congressional districts, 12 will be allocated based on the state wide results.
To once again have a result that keeps him on pace to catch up to Clinton and win, Sanders needs to get 20 of the 35 delegates available on caucus day, assuming no additional superdelegate declarations or other adjustments between now and then.
At the moment, Nevada poll averages show Clinton leading 50.0% to 30.5%… but there has been no polling there since December. Expect a variety of new polls in the next week. Watch them carefully. For Sanders to be on track, these numbers have to flip… and then Sanders has to build an even larger lead.
In South Carolina, a week after Nevada, Clinton is even further ahead, although again polls there are stale and new ones taken post-Iowa post-New Hampshire are eagerly awaited.
Between now and Nevada, and probably between now and South Carolina, there will be almost non-stop talk about Sanders’ threat to Clinton, how Clinton is a lot weaker than expected, how vulnerable she is. A lot of this is true. To a degree.
But to evaluate if Sanders is actually a threat to Clinton eventually taking the nomination, as opposed to just being a temporary speed bump in her way, Sanders has to not only take the lead in Nevada, South Carolina and beyond, but be ahead by a significant margin, not just a little bit. This is a tall order. Maybe it is possible.
But if there is talk about how Sanders is “closing the gap” or “making it closer than expected” in Nevada or South Carolina, keep in mind that isn’t enough. He needs to actually win and win by a large enough margin to get more than 54.30% of the delegates to be on pace to catch up and win. Otherwise, the task in later states just becomes even harder.
Note: This post is an update based on the data on ElectionGraphs.com. Election Graphs tracks both a poll based estimate of the Electoral College and a numbers based look at the Delegate Races. All of the charts and graphs seen in this post are from that site. Additional graphs, charts and raw data can be found there. All charts above are clickable to go to the current version of the detail page the chart is from, which may contain more up to date information than the snapshots on this page, which were current as of the time of this post. Follow @ElectionGraphs on Twitter or like Election Graphs on Facebook to see announcements of updates or to join the conversation. For those interested in individual general election poll updates, follow @ElecCollPolls on Twitter for all the polls as they are added.
Most attention right now continues to be on the primary races, as we are in the days between Iowa and New Hampshire, and things are still very unsettled and exciting. But there have been a handful of new general election polls. The latest change to mention is in the matchup between the delegate frontrunners in both parties.
Clinton vs Cruz
For a few short weeks, some favorable polls for Cruz moved New Hampshire from “Strong Clinton” to “Weak Clinton”, meaning that the poll average showed a Clinton lead of less than 5%, so we considered the state “possible” for Cruz and included it in Cruz’s best case.
In this update Clinton’s lead in the New Hampshire poll average against Cruz is back up to 6.0%, so New Hampshire seems like it is off the table for Cruz again.
This moves Cruz’s best case from losing to Clinton by 76 electoral votes to losing by 84 electoral votes. The “Expected” case where each candidate wins all of the states they are ahead in the poll average, with no states flipping, still has Cruz losing by 96 electoral votes.
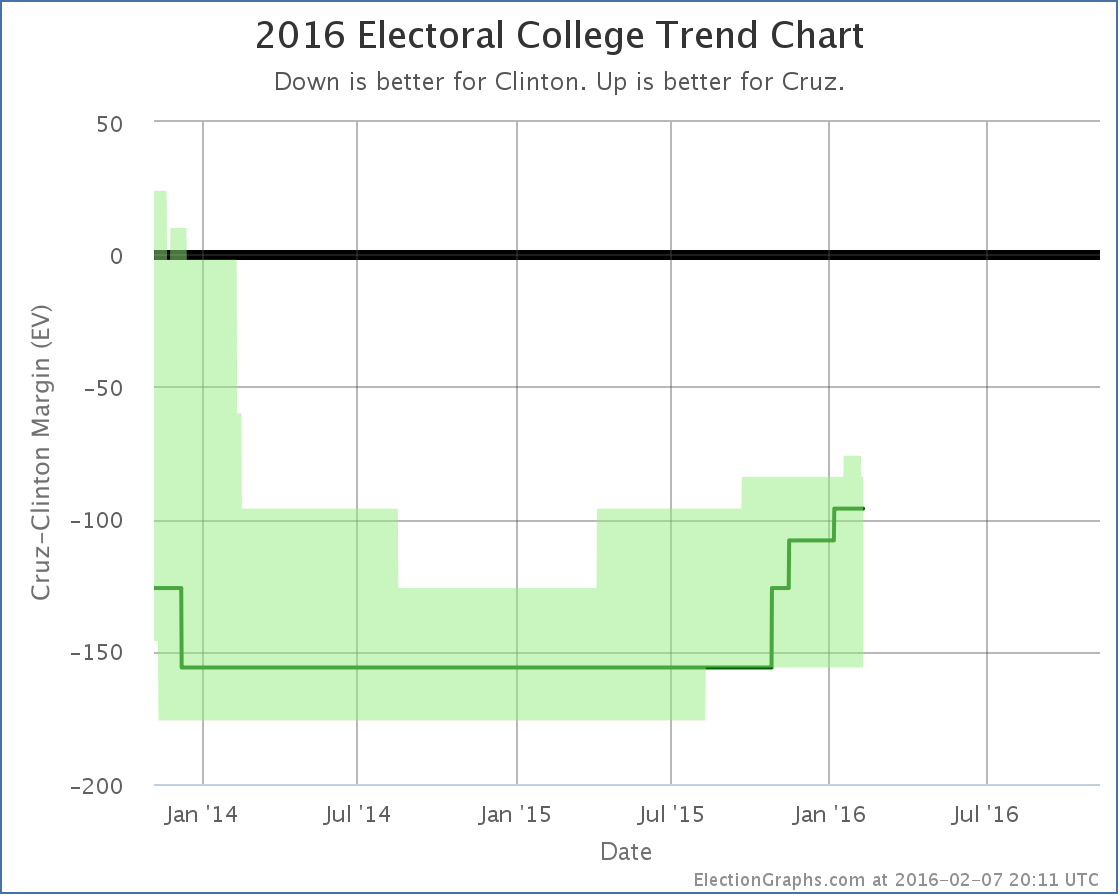
Cruz is well behind Clinton in these electoral college estimates. (Popular vote polling is more positive to him though.). But his best case, worst case, and expected case have all been improving over the last year. Today’s change is the first one in which his position has gotten worse since August 2014, which frankly was before there were enough polls to give a reliable picture.
The question is of course if this is a sign of additional movement to come. Is this the best that Cruz can do against Clinton? The popular vote numbers I pointed to earlier indicate that Cruz probably can indeed do better than this, and perhaps we’re not seeing it in the electoral college numbers just because we don’t have enough recent polling in enough states. Or maybe we really do have a popular vote / electoral college disconnect. It is possible.
In any case, it would be premature to think that Cruz has topped against Clinton. We have a very long way to go. If Cruz continues to be the Republican delegate frontrunner, or even close, we’ll continue to get more polling and a better picture of how a Clinton vs Cruz race would go, and of course things will look different once the general election campaign starts in earnest.
Of course, if Cruz falls behind in the delegate race, polling involving him will dry up in favor of whoever is leading in his place. And nobody will miss it. :-)
275.1 days until general election polls start to close!
Note: This post is an update based on the data on ElectionGraphs.com. Election Graphs tracks both a poll based estimate of the Electoral College and a numbers based look at the Delegate Races. All of the charts and graphs seen in this post are from that site. Additional graphs, charts and raw data can be found there. All charts above are clickable to go to the current version of the detail page the chart is from, which may contain more up to date information than the snapshots on this page, which were current as of the time of this post. Follow @ElectionGraphs on Twitter or like Election Graphs on Facebook to see announcements of updates or to join the conversation. For those interested in individual general election poll updates, follow @ElecCollPolls on Twitter for all the polls as they are added.
|
|
