This is the website of Abulsme Noibatno Itramne (also known as Sam Minter).
Posts here are rare these days. For current stuff, follow me on Mastodon
|
With the final results all but inevitable, these updates will be somewhat mechanical absent something unexpected happening.
After West Virginia, Sanders needed 84.90% of the remaining delegates to win, Clinton only needed 15.29%.
In Oregon and Kentucky, Sanders got 62, Clinton got 54.
In other changes since West Virginia due to superdelegate updates, there was a net change of Clinton +1, Sanders -1.
So total change since West Virginia: Sanders +61, Clinton +55.
That is Sanders 52.59%, Clinton 47.41%.
So Clinton met her target, Sanders did not.
Updated graphs:

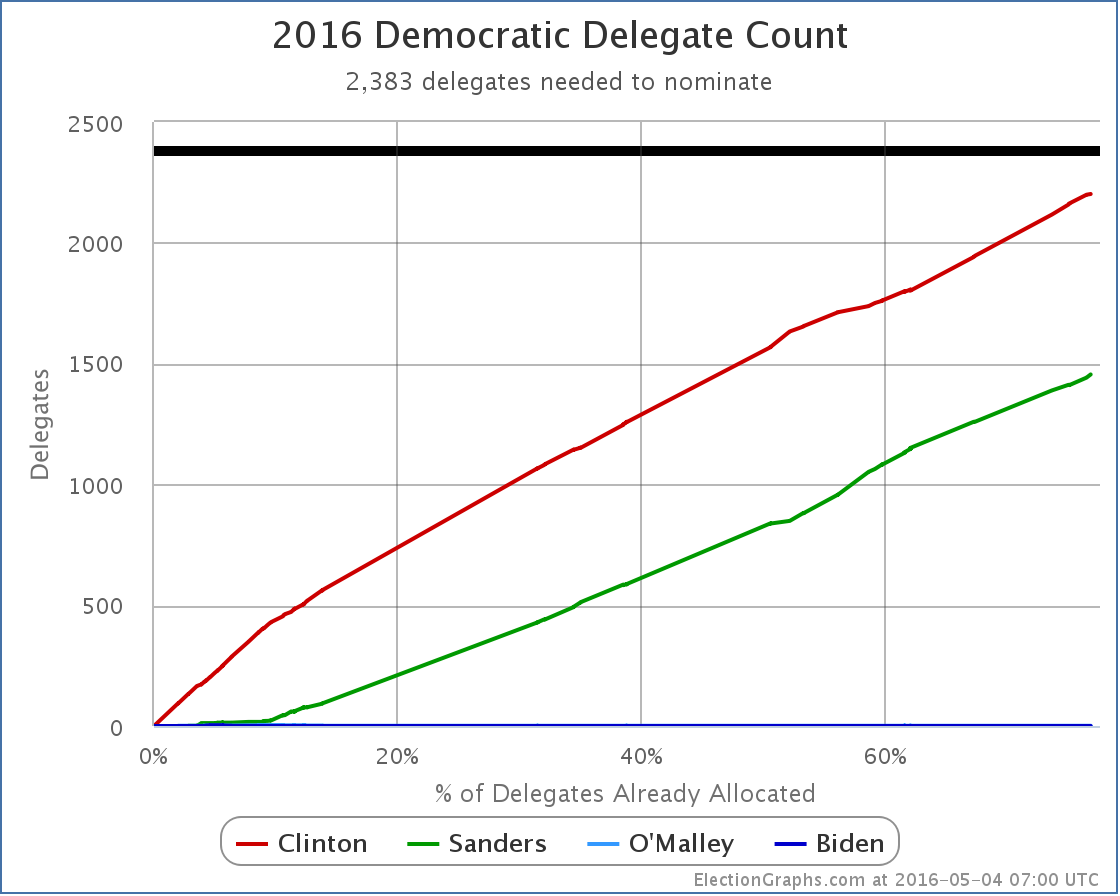
New delegate totals: Clinton 2275, Sanders 1539, O’Malley 1.
There are 950 delegates left. Clinton needs 108 of them. Sanders needs 844 of them.
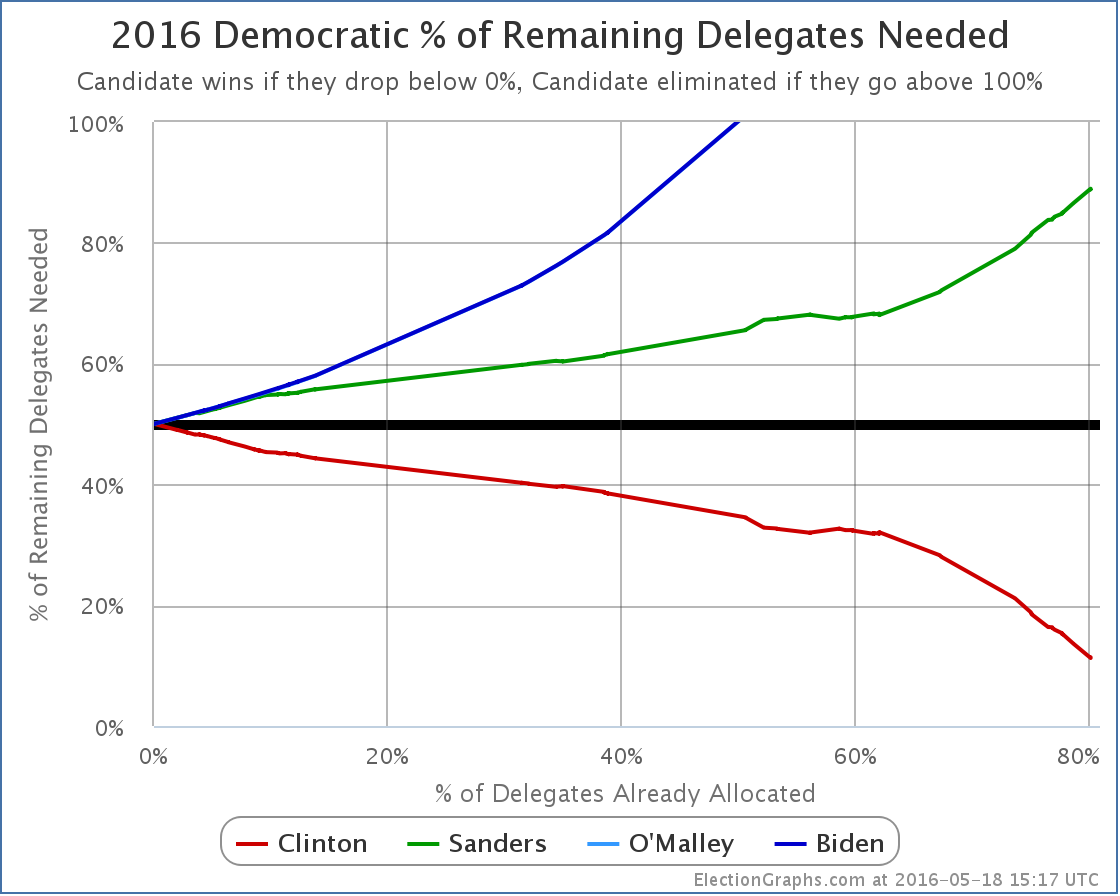
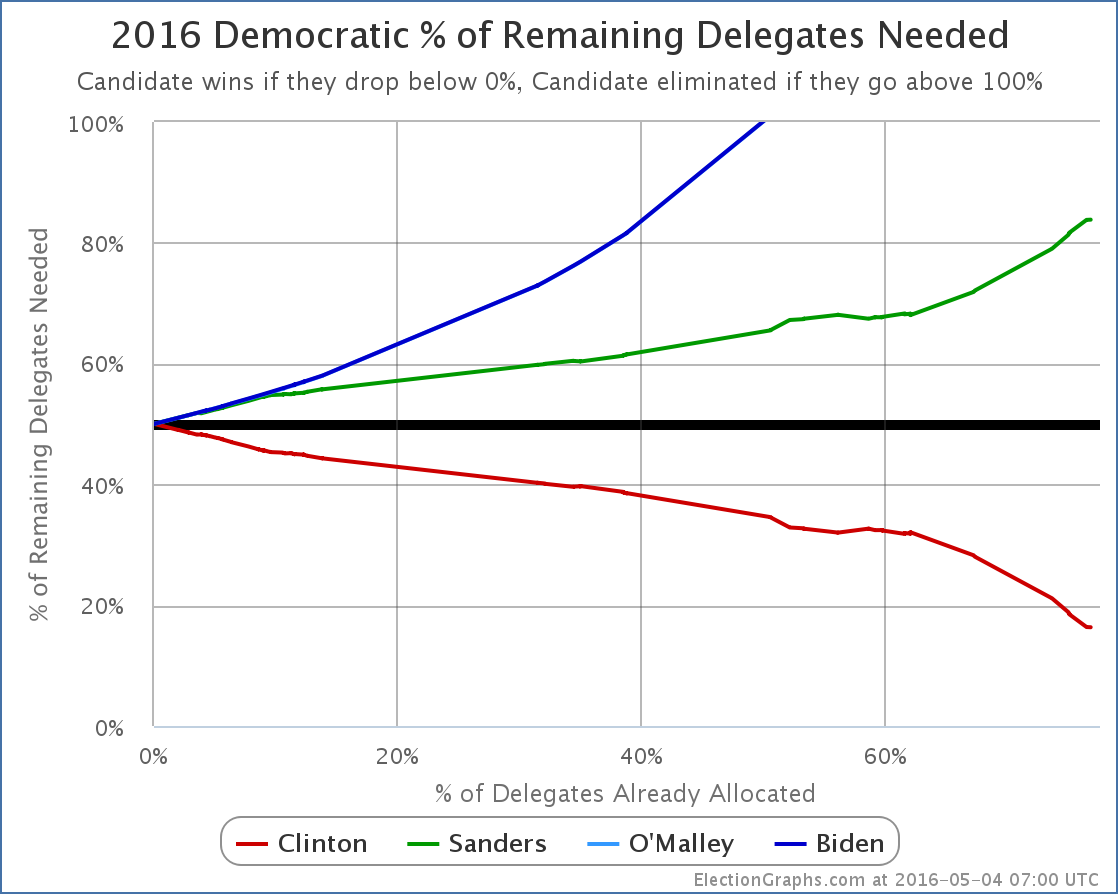
Clinton now needs 11.37% of the remaining delegates to win. Sanders needs 88.84%.
Update 2016-05-20 16:33 UTC: Superdelegate scan – Clinton +2, Sanders +2.
Update 2016-05-25 02:26 UTC: Superdelegate scan – Clinton +3.
Update 2016-05-25 02:28 UTC: Change from Maryland – Sanders +1, Clinton -1.
Update 2016-05-27 17:05 UTC: Superdelegate scan – Clinton +7, Sanders +1.
Update 2016-05-30 16:06 UTC: Superdelegate scan – Clinton +4, Sanders -1.
Update 2016-06-03 14:20 UTC: Superdelegate scan – Clinton +4, Sanders +3
Update 2016-06-03 14:22 UTC: There was a one delegate adjustment from Clinton to Sanders in Oregon as results were finalized there. I also discovered one Sanders delegate in Michigan I was missing due to a math error on my part which is now fixed. Net change: Sanders +2, Clinton -1.
Update 2016-06-05 03:25 UTC: Superdelegate scan – Clinton -1
Note: This post is an update based on the data on ElectionGraphs.com. Election Graphs tracks both a poll based estimate of the Electoral College and a numbers based look at the Delegate Races. All of the charts and graphs seen in this post are from that site. Additional graphs, charts and raw data can be found there. All charts above are clickable to go to the current version of the detail page the chart is from, which may contain more up to date information than the snapshots on this page, which were current as of the time of this post. Follow @ElectionGraphs on Twitter or like Election Graphs on Facebook to see announcements of updates or to join the conversation. For those interested in individual general election poll updates, follow @ElecCollPolls on Twitter for all the polls as they are added.
Edit 2016-06-05 05:44 UTC: Corrected a couple details of the list of superdelegate updates to match my logs of the changes that were made. I’d missed logging a couple of the updates here on this post. Dated the updates to approximately when I made the changes.
This week on the Curmudgeon’s Corner podcast Sam and Ivan talk about television, thermostats, manipulating public opinion and a few other things besides Election 2016, but of course most of the show ends up being about the election. They cover the last gasp Sanders path to the nomination, Trump zig-zagging on the issues, the Republican civil war, and possible Trump VPs. Oh, and Sam’s son Alex keeps interrupting to promote his YouTube channel.
Click below to listen or subscribe… then let us know your own thoughts!

Recorded 2016-05-12
Length this week – 1:35:45
 1-Click Subscribe in iTunes 1-Click Subscribe in iTunes
 View Podcast in iTunes View Podcast in iTunes
 View Raw Podcast Feed View Raw Podcast Feed
 Download MP3 File Download MP3 File
 Follow the podcast on Facebook Follow the podcast on Facebook
Show Details:
- (0:01:24-0:21:00) But First
- Failed Alex Plan
- Agenda
- Feedback
- TV Habits
- More Election Graphs Comments
- (0:22:21-0:52:01) Hodgepodge
- Thermostats
- Bernie’s Path
- Facebook Trending Topics
- Manipulating the Press
- (0:52:41-1:04:08) Trump Zigzags
- Trump on the National Debt
- Trump on Taxes
- Trump on Self-funding
- Trump on Muslim ban
- Trump on Hispanics
- Trump on Tax Returns
- Trump on Minimum Wage
- So… Trump Pivot?
- (1:05:12-1:35:25) Republican Civil War
- Support the Nominee
- Trump vs Ryan
- Trump and turnout
- Third Party Options
- Ultimate Mole?
- Clinton landslide?
- Most Unfavorable Ever
- Trump/Gingrich?
- Alex Interruption
- More on Newt
- Other VP candidates
- Alex’s Youtube channel
With the final results all but inevitable, these updates will be somewhat mechanical absent something unexpected happening.
After Guam, Sanders needed 84.23% of the remaining delegates to win, Clinton only needed 15.95%.
In West Virginia, Sanders got 18, Clinton got 11.
In other changes since Guam due to superdelegate updates and revisions in the results from Maine, there was a net change of Clinton +1, Sanders +1.
So total change since Guam: Sanders +19, Clinton +12.
That is Sanders 61.29%, Clinton 38.71%.
So Clinton met her target, Sanders did not.
Updated graphs:

New delegate totals: Clinton 2220, Sanders 1478, O’Malley 1.
There are 1066 delegates left. Clinton needs 163 of them. Sanders needs 905 of them.
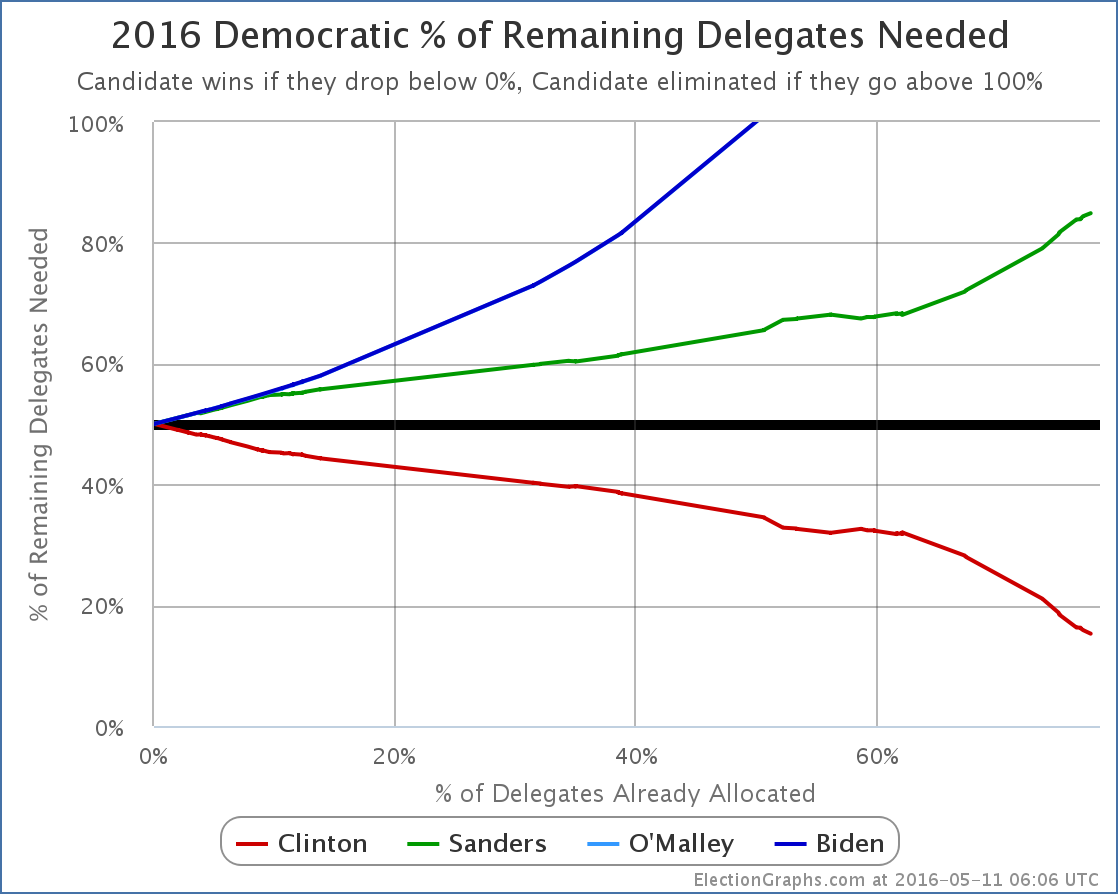
Clinton now needs 15.29% of the remaining delegates to win. Sanders needs 84.90%.
Update 2016-05-14 16:09: Superdelegate scan yields net change Clinton +2.
Update 2016-05-17 16:56: Superdelegate scan yields net change Clinton -2.
Update 2016-05-18 14:44: Superdelegate scan yields net change Clinton +1, Sanders -1
Note: This post is an update based on the data on ElectionGraphs.com. Election Graphs tracks both a poll based estimate of the Electoral College and a numbers based look at the Delegate Races. All of the charts and graphs seen in this post are from that site. Additional graphs, charts and raw data can be found there. All charts above are clickable to go to the current version of the detail page the chart is from, which may contain more up to date information than the snapshots on this page, which were current as of the time of this post. Follow @ElectionGraphs on Twitter or like Election Graphs on Facebook to see announcements of updates or to join the conversation. For those interested in individual general election poll updates, follow @ElecCollPolls on Twitter for all the polls as they are added.
Clinton won Guam. She got 4 delegates. Sanders got 3.
This is of course a tiny number of delegates and changes nothing.
In addition, since Indiana, 3 more superdelegates were added to Clinton’s total, and one pledged delegate in Mississippi moved from Clinton to Sanders due to updates there.
So the net change since Indiana is Clinton +6, Sanders +4.
This difference is barely visible in the charts, but here are the updated charts anyway:
New overall totals: Clinton 2208, Sanders 1459, O’Malley 1.
You’d think at some point that O’Malley superdelegate would say they support someone else. But not yet.
Clinton now only needs 15.95% of the remaining delegates to clinch the nomination.
Sanders would need 84.23% of the remaining delegates to catch up and win.
And so we continue to watch the Clinton win play out.
Update 2016-05-11 05:26 UTC: Superdelegate update – Clinton +2.
Update 2016-05-11 05:33 UTC: Update from Maine – Sanders +1, Clinton -1.
Note: This post is an update based on the data on ElectionGraphs.com. Election Graphs tracks both a poll based estimate of the Electoral College and a numbers based look at the Delegate Races. All of the charts and graphs seen in this post are from that site. Additional graphs, charts and raw data can be found there. All charts above are clickable to go to the current version of the detail page the chart is from, which may contain more up to date information than the snapshots on this page, which were current as of the time of this post. Follow @ElectionGraphs on Twitter or like Election Graphs on Facebook to see announcements of updates or to join the conversation. For those interested in individual general election poll updates, follow @ElecCollPolls on Twitter for all the polls as they are added.
On this week’s Curmudgeon’s Corner Ivan and Sam spend most of the show on Election 2016 again. On the Democratic side they talk about how after a short moment when it looked like he was embracing the inevitable, Sanders is once again fighting on against the odds. On the Republican side they discuss Trump’s victory, how we got to this point, how the Republican establishment will react, and what it all means for the general election. In addition to all that, there is also talk of the White House Correspondent’s Dinner, a county Democratic convention, Ivan’s travel… oh, and Sam’s 6 year old son Alex has some questions for the listeners.
Click below to listen or subscribe… then let us know your own thoughts!
Recorded 2016-05-04
Length this week – 1:42:04
1-Click Subscribe in iTunes
View Podcast in iTunes
View Raw Podcast Feed
Download MP3 File
Follow the podcast on Facebook
Show Details:
- (0:00:10-0:12:20) But First
- Ivan’s Flights
- Alex’s Questions
- Agenda
- Delegate Confusion
- (0:13:00-0:27:15) Election 2016: Democrats
- Indiana Results
- Sanders still fighting!
- Annoying the superdelegates
- Ways Clinton is Winning
- Contested Convention?
- Over Over Over
- (0:28:35-1:03:29) Election 2016: Republicans
- Indiana Results
- Trump Ascendant
- Cruz Drops Out
- No Rules Changes
- Last Trump/Cruz attacks
- Trump is the Nominee
- How did it happen?
- How will elected Republicans respond?
- Predicting November
- Trump Win Scenarios
- How big a Clinton win?
- (1:04:32-1:18:55) White House Correspondents Dinner
- Obama’s Routine
- Boehner and House Divisions
- Differences in Trump/Clinton surrogates
- Potential Trump VPs
- Wilmore’s Routine
- (1:20:10-1:41:44) Snohomish County Democratic Convention
- Reaction to Senator Murray and Rep Larson
- Platform Nonsense
- Reaction to Rep DelBene
- Resolutions
- Motion to Reject
- How not to convince a superdelegate
- iTunes Reviews
Sanders won Indiana’s pledged delegates 44 to 39.
So he got 53.01% of the delegates. He needed 80.92% to be on a pace to catch up with Clinton.
But it is actually worse. That 80.92% was as of the results from the Northeast last week. Since then between superdelegate announcements and a revision to the Ohio results, there was a net change of Clinton +11, Sanders -1. If you add that in, you get Clinton +50, Sanders +43 since last week. So actually Sanders only got 46.24% of the recent delegates.
Which means, of course, that Clinton just continued her march to the nomination and improved her position despite Sanders’ win.
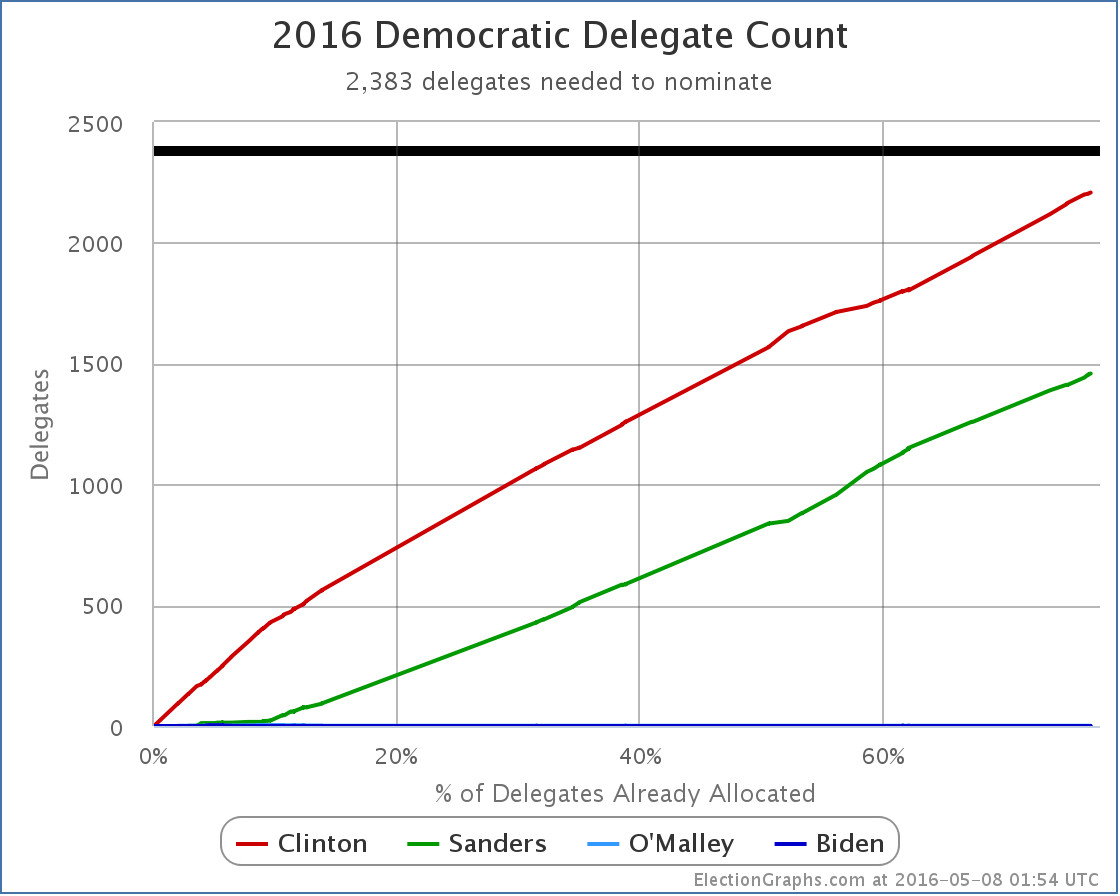
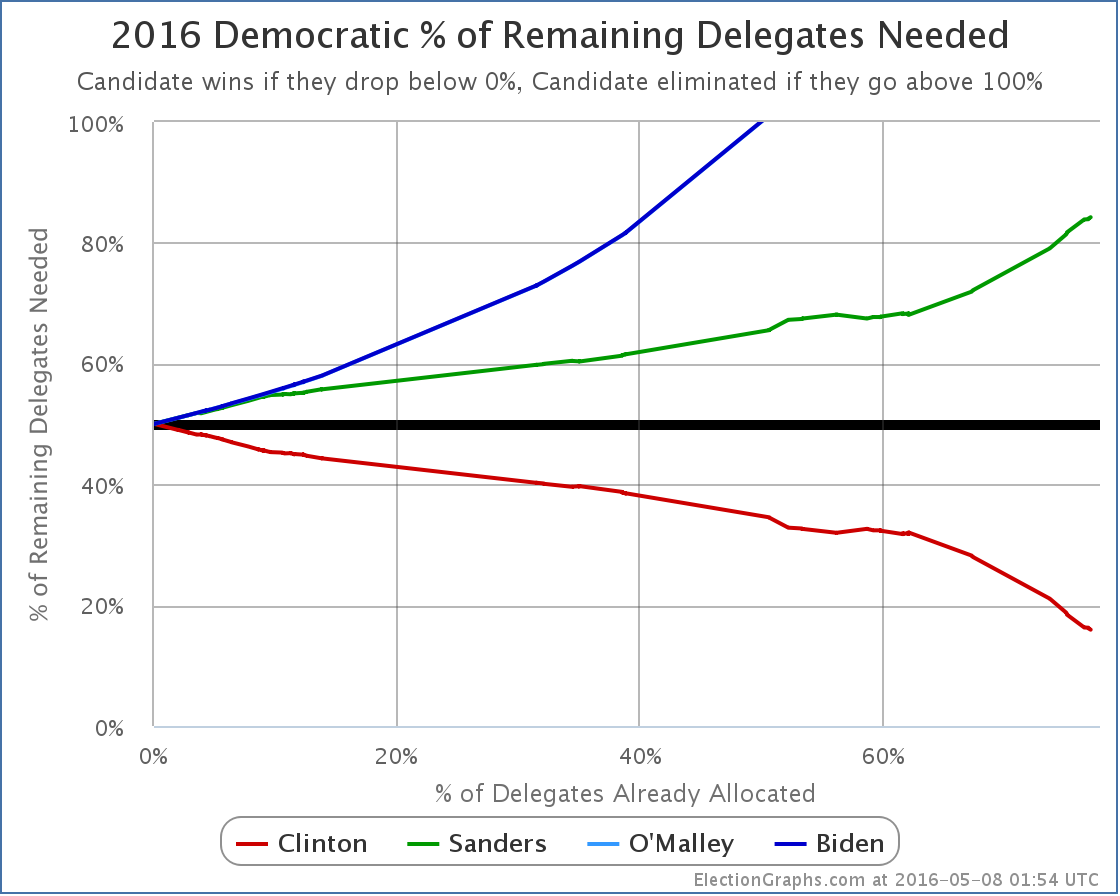
Here come the graphs:
The totals are now Clinton 2202, Sanders 1455, O’Malley 1. Clinton only needs 181 of the 1107 remaining delegates to wrap this up.
Which brings us to…
Clinton now only needs 16.35% of the remaining delegates to win. Sanders needs 83.83%.
Massive superdelegate defections could alter this, but there have never been any signs of such movement, and there are none now.
For a long time now the result has been clear absent a catastrophic change. As we have fewer and fewer delegates left, the curves above will move more quickly toward the final result, and it will be more and more difficult to get a result that would even slow it down.
ElectionGraphs.com will continue to document this process, but there is little to no drama left, it is just a matter of watching Clinton gather up the remaining delegates needed.
Update 2016-05-08 01:57 – Superdelegate update, net change Clinton +3. Update from Mississippi, net change Clinton -1, Sanders +1.
Note: This post is an update based on the data on ElectionGraphs.com. Election Graphs tracks both a poll based estimate of the Electoral College and a numbers based look at the Delegate Races. All of the charts and graphs seen in this post are from that site. Additional graphs, charts and raw data can be found there. All charts above are clickable to go to the current version of the detail page the chart is from, which may contain more up to date information than the snapshots on this page, which were current as of the time of this post. Follow @ElectionGraphs on Twitter or like Election Graphs on Facebook to see announcements of updates or to join the conversation. For those interested in individual general election poll updates, follow @ElecCollPolls on Twitter for all the polls as they are added.
This week on the Curmudgeon’s Corner podcast Sam and Ivan spend most of the show on Election 2016. On the Republican side they discuss how recent results and the polls of upcoming states seem to be closing the door on the possibility of a contested convention and pointing to a straight up Trump nomination, as well as discussing Cruz/Fiorina, and what might make Trump worse than Cruz. On the Democratic side the discussion is on how Sanders seems to be finally admitting defeat, and on the veepstakes! Finally, they wrap it up with a lightning round covering all sorts of other issues they haven’t gotten around to lately.
Click below to listen or subscribe… then let us know your own thoughts!
Recorded 2016-04-28
Length this week – 1:40:24
1-Click Subscribe in iTunes
View Podcast in iTunes
View Raw Podcast Feed
Download MP3 File
Follow the podcast on Facebook
Show Details:
- (0:00:10-0:05:41) But First
- Agenda
- Noisy Ivan
- The Beep is Back
- (0:06:25-0:59:59) Election 2016: Republicans
- PA/MD/CT/RI/DE Results
- PA Uncommitted Delegates
- Where Trump is in the Delegate Race now
- Indiana Polls
- California Polls
- Projections for the rest of the race
- Bye Bye Contested Convention Scenarios
- Cruz/Kasich Deal
- Cruz/Fiorina 2016!
- Presidential Trump
- Trump Foreign Policy?
- Trump vs Cruz, who is worse?
- (1:01:07-1:10:29) Election 2016: Democrats
- Bernie admitting he is done?
- Veepstakes
- Median Voter vs Base
- (1:11:08-1:40:04) Lightning Round
- Bathroom Laws
- Germany/Turkey free speech issue
- Matthew Keys Case
- The Chalkening
- Tubman $20
- Movie: The Gentle Leader Way
- Brexit
- Prince
- Brazil
- Apple Earnings
- Saudi No Oil Plan
- Car vs Helicopter
Even the Sanders folks are starting… just starting… to admit it might be over.
Clinton won 218 delegates yesterday. Sanders won 166.
In addition, since New York there were new superdelegate endorsements and updates in Illinois and Ohio which have netted Clinton +9, Sanders +1.
So including everything since New York, we have Clinton +227, Sanders +167.
That means Clinton got 57.61% of the delegates. She only needed 28.73%.
Meanwhile Sanders got 42.39% of the delegates. He needed 71.39%.
In practical terms this has been for over a long time. Absent a huge unexpected event of course.
But we still watch it play out.
Here are the relevant graphs:

Clinton now only needs 231 of the remaining 1200 delegates to win. That’s 19.25% of the remaining delegates.
Sanders on the other hand needs 971 of the 1200. That is 80.92%.
Guess which is most likely?
Or, of course, still, tons of Clinton superdelegates could defect and change this a bit. I wouldn’t hold my breath for that though.
Update 2016-05-01 17:08 UTC: Superdelegate updates plus change to Ohio pledged delegates. Net change: Clinton +11, Sanders -1.
Note: This post is an update based on the data on ElectionGraphs.com. Election Graphs tracks both a poll based estimate of the Electoral College and a numbers based look at the Delegate Races. All of the charts and graphs seen in this post are from that site. Additional graphs, charts and raw data can be found there. All charts above are clickable to go to the current version of the detail page the chart is from, which may contain more up to date information than the snapshots on this page, which were current as of the time of this post. Follow @ElectionGraphs on Twitter or like Election Graphs on Facebook to see announcements of updates or to join the conversation. For those interested in individual general election poll updates, follow @ElecCollPolls on Twitter for all the polls as they are added.
Clinton won New York 139 to 108.
This is only a surprise to Sanders supporters who were in deep denial. This is exactly as has been expected for many many weeks. The series of Sanders wins prior to this were also mostly predicted. The one exception (Michigan, where Sanders did outperform expectations) wasn’t enough of a win to actually help Sanders. The Clinton vs Sanders wins and losses have for the most part played out very close to expectations. The variations from that have only been a few delegates here or there.
The breathless talk of momentum and talk of a Sanders path to victory has mostly been due to the Sanders camp desperately trying to spin whatever narrative they have, the general public not understanding how the process works (yes, superdelegates count), the public not understanding the math (even massive Sanders wins at this point aren’t enough to catch up and win), and the media hopelessly biased toward a race being more fun to cover than just monitoring progress toward an almost inevitable result.
It has been clear since around March 6th… at the LATEST… probably earlier to be honest… that absent a major Clinton implosion, Clinton would be the nominee and Sanders wasn’t going to catch her.
And yes, yes, even today… for that matter even up until the actual votes are cast at the convention… there is still that chance of a Clinton implosion. There could be some new scandal, some new health event, or something else, that causes even Clinton supporters to abandon her. That would potentially change everything, even if Clinton already has things wrapped up mathematically.
Absent that though, this result has been clear for a long time, and we are just watching the steps to get there.
In addition to New York, since the last democratic contest in Wyoming there have been a variety of superdelegate changes, plus revised results from Colorado. The net result of all of those was Sanders +5, Clinton -2. Those are good numbers for Sanders, but small.
Add in New York and the results since Wyoming are Clinton +137, Sanders +113.
That means Clinton got 54.80% of the delegates. She only needed 32.23%.
Sanders got 45.20% of the delegates. He needed 67.84%.
So the already nearly impossible Sanders path gets even more remote.
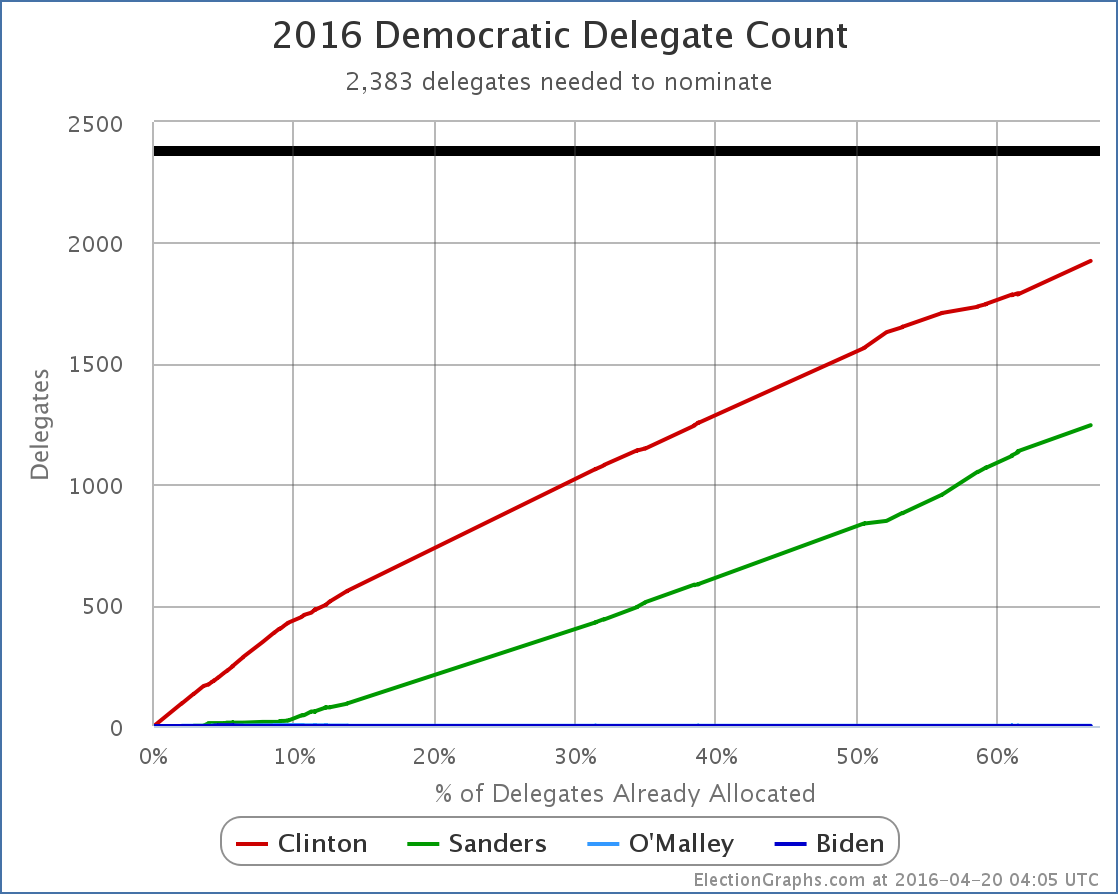
I don’t usually post the raw delegate count graph, but we are now in sight of the finish line.
We now have Clinton 1925, Sanders 1245, O’Malley 1. With 1594 delegates still to be determined, and 2383 needed to win the nomination.
You can see that since primaries and caucuses began (around the 9% mark), with only a few exceptions here and there, the pace at which both candidates have collected delegates has been pretty steady. (If you look at this with a date axis it looks much more jagged, but this is all just distortion caused by the way the states happened to be scheduled, looking at % allocated removes this distortion and allows you to look more cleanly at the actual trends.)
Clinton has been consistently ahead, and except for a few short exceptions has been gradually increasing her lead.
It is clear even from this chart that to catch up before we get to 100% there would need to be a dramatic change, not just a small improvement on the Sanders side.
But lets look at the more telling “% of remaining delegates needed” graph:
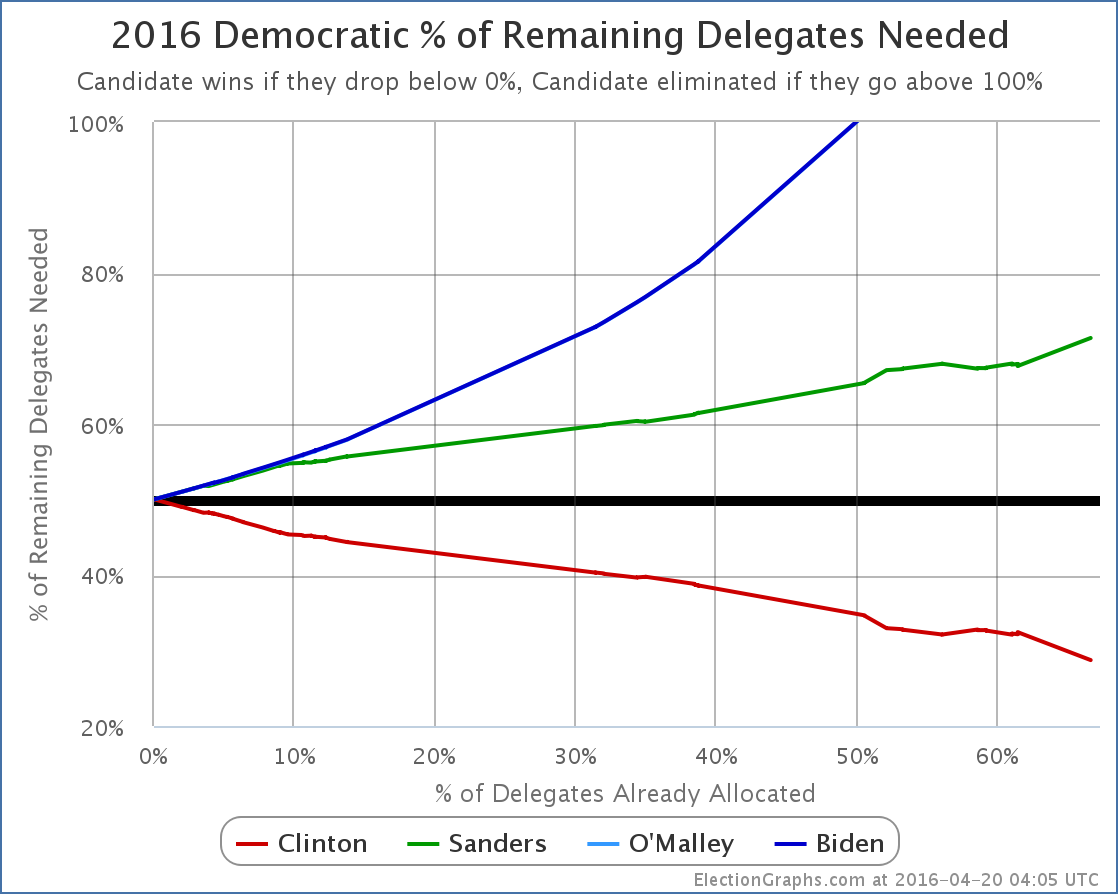
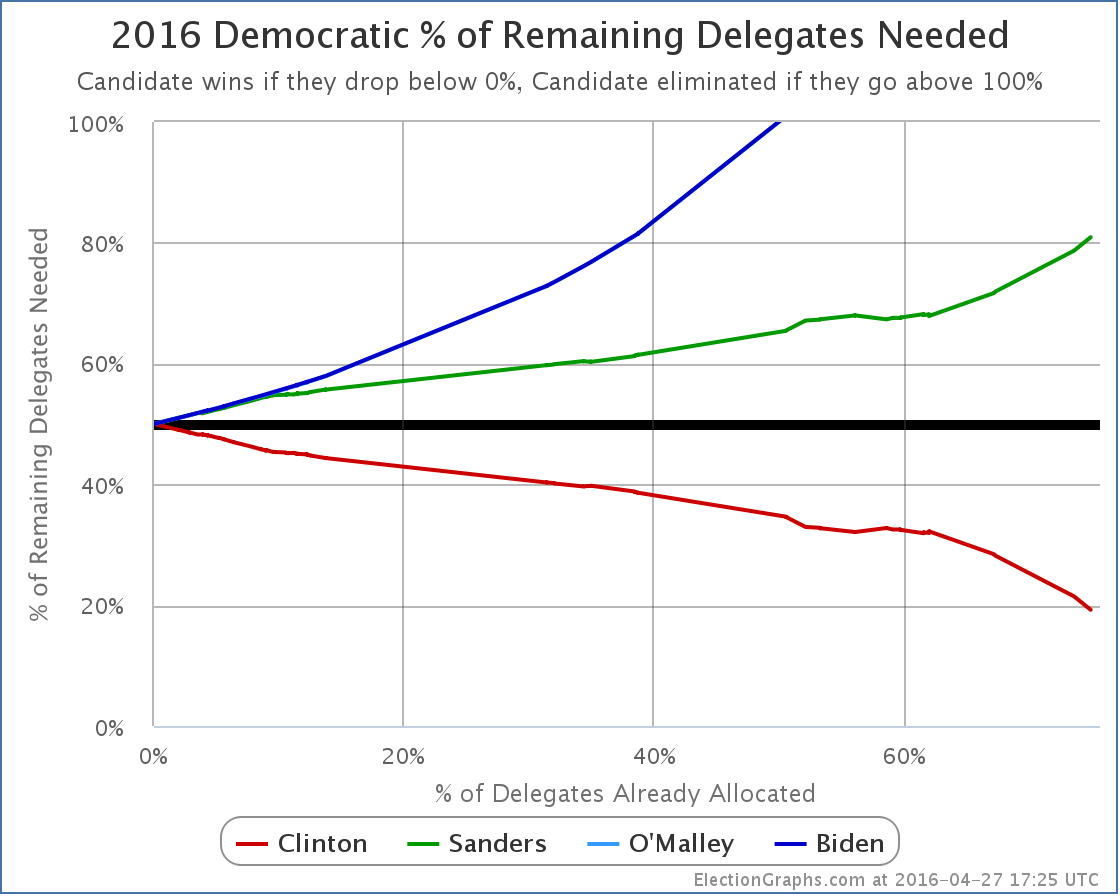
Sanders now needs 71.39% of the remaining delegates (including the remaining superdelegates) to catch up and win the nomination.
Meanwhile, Clinton only needs 28.73% of the remaining delegates.
Or, as always, this changes if a massive wave of Clinton superdelegates start changing their minds and going over to Sanders. That hasn’t happened so far, and absent the Clinton implosion discussed earlier, is very unlikely to happen now.
We will probably still keep hearing about it not being over until the vote at the convention because the superdelegates might change their minds though. Because they CAN change their minds. But they tend not to. It is over. It has been for a long time.
Absent the Clinton implosion of course.
[Edit 16:42 UTC to add the raw delegate totals.]
[Update 2016-04-24 00:13 UTC – Superdelegate scan: Clinton +2]
[Update 2016-04-26 16:18 UTC – Superdelegate scan and updates in Illinois and Ohio. Net change: Clinton +3, Sanders +1.]
[Update 2016-04-27 16:55 UTC – Superdelegate scan: Clinton +4]
Note: This post is an update based on the data on ElectionGraphs.com. Election Graphs tracks both a poll based estimate of the Electoral College and a numbers based look at the Delegate Races. All of the charts and graphs seen in this post are from that site. Additional graphs, charts and raw data can be found there. All charts above are clickable to go to the current version of the detail page the chart is from, which may contain more up to date information than the snapshots on this page, which were current as of the time of this post. Follow @ElectionGraphs on Twitter or like Election Graphs on Facebook to see announcements of updates or to join the conversation. For those interested in individual general election poll updates, follow @ElecCollPolls on Twitter for all the polls as they are added.
This week on Curmudgeon’s Corner Sam and Ivan talk about Election 2016 of course. But first some bits about Mike the headless chicken, the comments on Sam’s Election Graphs site, stamp prices, Hey Siri, and a movie Sam watched. When they do get to the election they cover Trump’s shutout in Colorado, Trump’s general malpractice in delegate wrangling, the odds of a contested convention, the accusations of cheating in both parties, and much more!
Click below to listen or subscribe… then let us know your own thoughts!
Recorded 2016-04-14
Length this week – 1:20:15
1-Click Subscribe in iTunes
View Podcast in iTunes
View Raw Podcast Feed
Download MP3 File
Follow the podcast on Facebook
Show Details:
- (0:00:41-0:22:29) But First
- Ivan in his Car
- Mike the Headless Chicken
- Election Graphs Comments
- Stamp Prices
- Facebook Bots
- Hey Siri
- Movie: Mississippi Burning (1988)
- (0:23:08-1:00:14) Election 2016
- Trump shutout in Colorado
- Delegate wrangling malpractice
- Contested Convention Scenarios
- Ryan saying no… Again
- Odds of Trump getting majority
- Trump Trends
- Cruz wooing delegates
- (1:00:53-1:19:55) Election 2016 Continued
- Cheating? Stealing? Unfair? Rigged?
- Sanders “contesting” the convention
- Sanders attempts to woo superdelegates
- Edit wars on Wikipedia Superdelegate list
- Denial from Trump and Sanders people
- What Sanders and Trump didn’t do
- When is New York again?
- Thoughtful Trump people wanted
|
|
