This is the website of Abulsme Noibatno Itramne (also known as Sam Minter).
Posts here are rare these days. For current stuff, follow me on Mastodon
|
New polls since last update: Florida, Iowa, Michigan, North Carolina, Ohio, Pennsylvania, Virginia.
This is the fourth day in a row where there have been changes to the Election Graphs model based on new polling. That is quite a bit! The pace of polling is accelerating as we approach the conventions.
The new additions today that caused changes were all from a series of swing state polls released by Ballotpedia. The Ballotpedia results look very bad for Trump. In terms of the Election Graph model, Pennsylvania, North Carolina and Virginia all jumped into categories more favorable to Clinton, and the movements in Ohio and Pennsylvania contributed to a move in the tipping point toward Clinton.
All in all, the net result is that once again even if Trump were to win all the states he is ahead in, plus all the states where he is less than 5% behind, he would still lose. As recently as yesterday I said that Trump was up or flat from one and two months ago on all four metrics tracked here. Today’s results flip that overnight. Trump is now DOWN or flat on all four metrics when compared to either one or two months ago. Perhaps these polls will turn out to be outliers, but for the moment, Trump’s position looks much weaker than it did… and it was pretty weak to start with.
Lets go over each of states that shifted the model. Although just released, these polls covered June 10 to June 22, so the changes show up on the charts on the midpoint, June 16th. So the shape of the charts over the last couple weeks is modified, not just the very end of the charts.
Pennsylvania
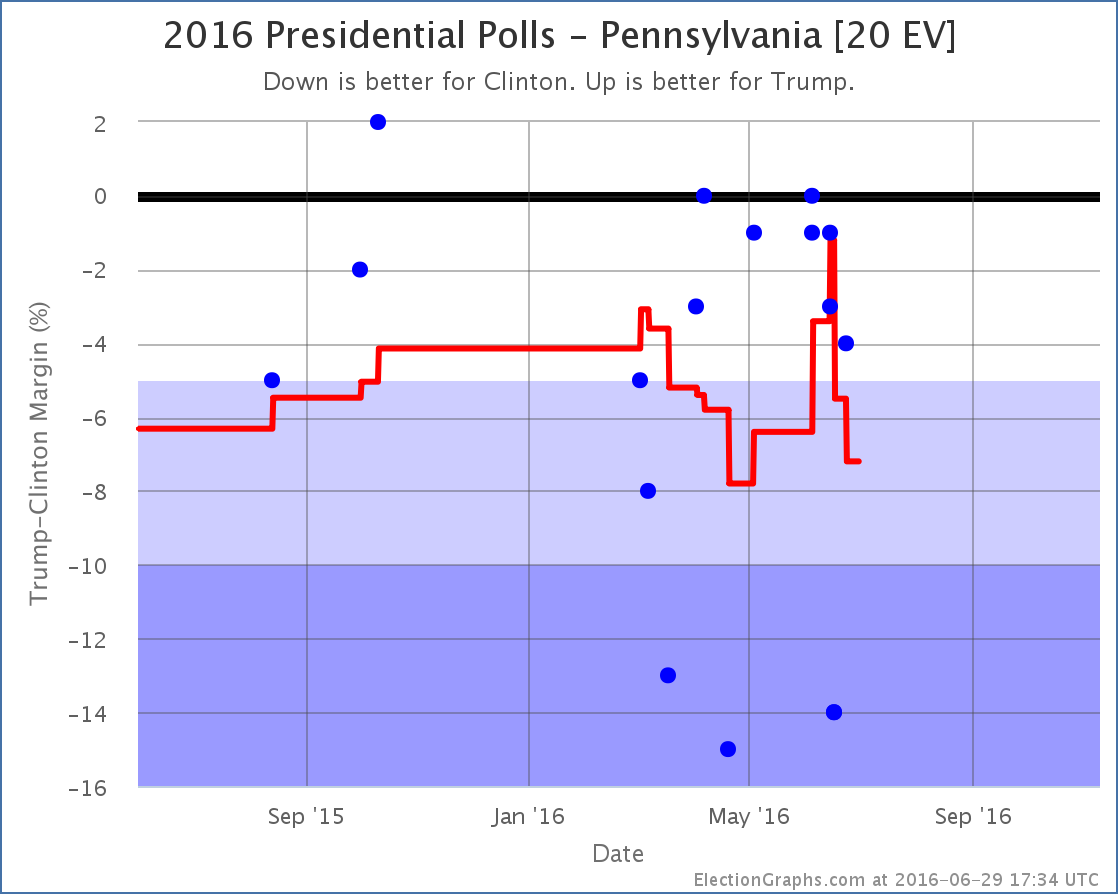
A series of relatively good polls for Trump that showed Pennsylvania close had resulted in a nice spike toward Trump. But with the new polls from Ballotpedia (one including Johnson, one with just Clinton and Trump, both showing a 14% Clinton lead) the average again moves dramatically toward Clinton, now showing a 7.2% Clinton lead.
Now, it is clear that the new polls are dramatically different than the other recent polls, so the possibility that they are not really representative can’t be thrown out. On the other hand, they are still within the very wide range we have seen polls over the past few months. Election Graphs includes all polls in the average and lets the average wash it out. If Ballotpedia is not representative of the “real” trend, new polls should show that before very long.
For the moment though, Pennsylvania moves to “Strong Clinton” and is no longer included in Trump’s best case.
North Carolina
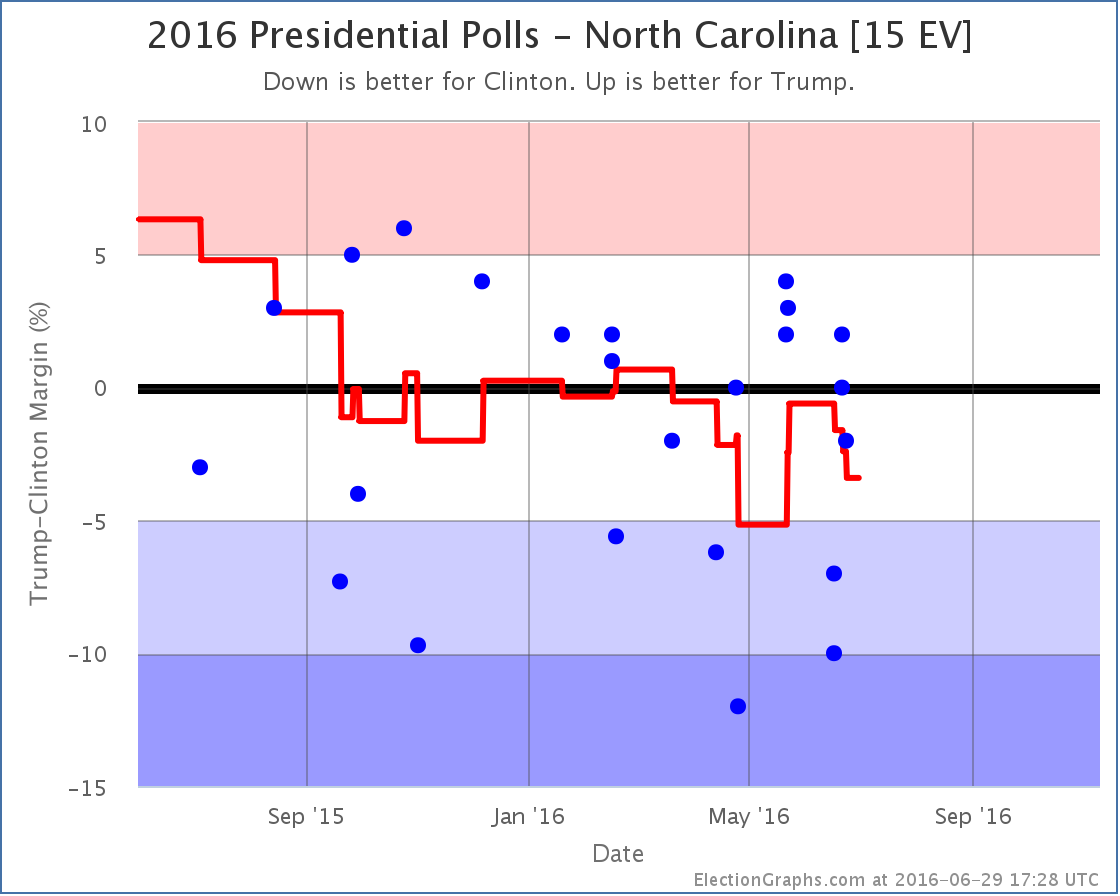
In North Carolina the two Ballotpedia polls (Clinton leading by 7% and 10%) not only pull North Carolina from Weak Trump to Weak Clinton, but because these polls covered a time period before the recent upward movement by Trump it actually completely erases that brief period in the red zone for North Carolina. Clinton now leads by 3.4% and North Carolina is back on the blue side of the ledger.
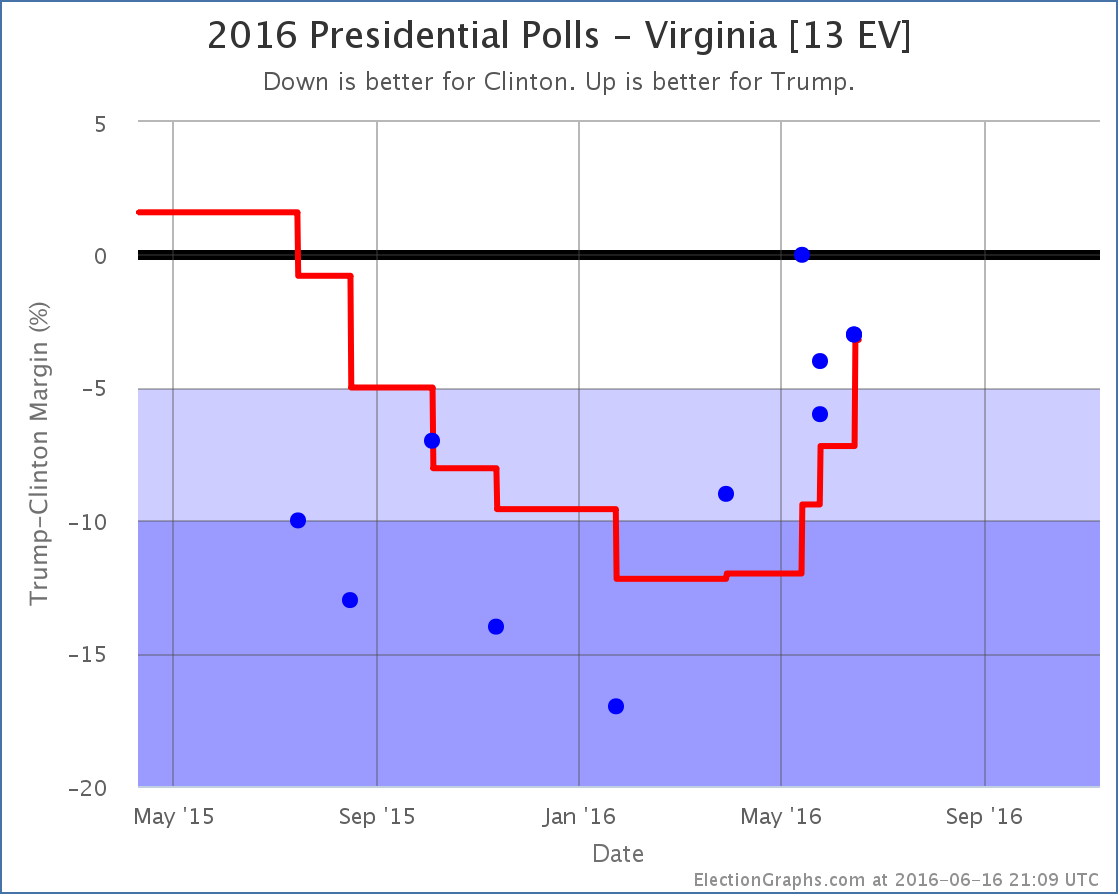
Virginia
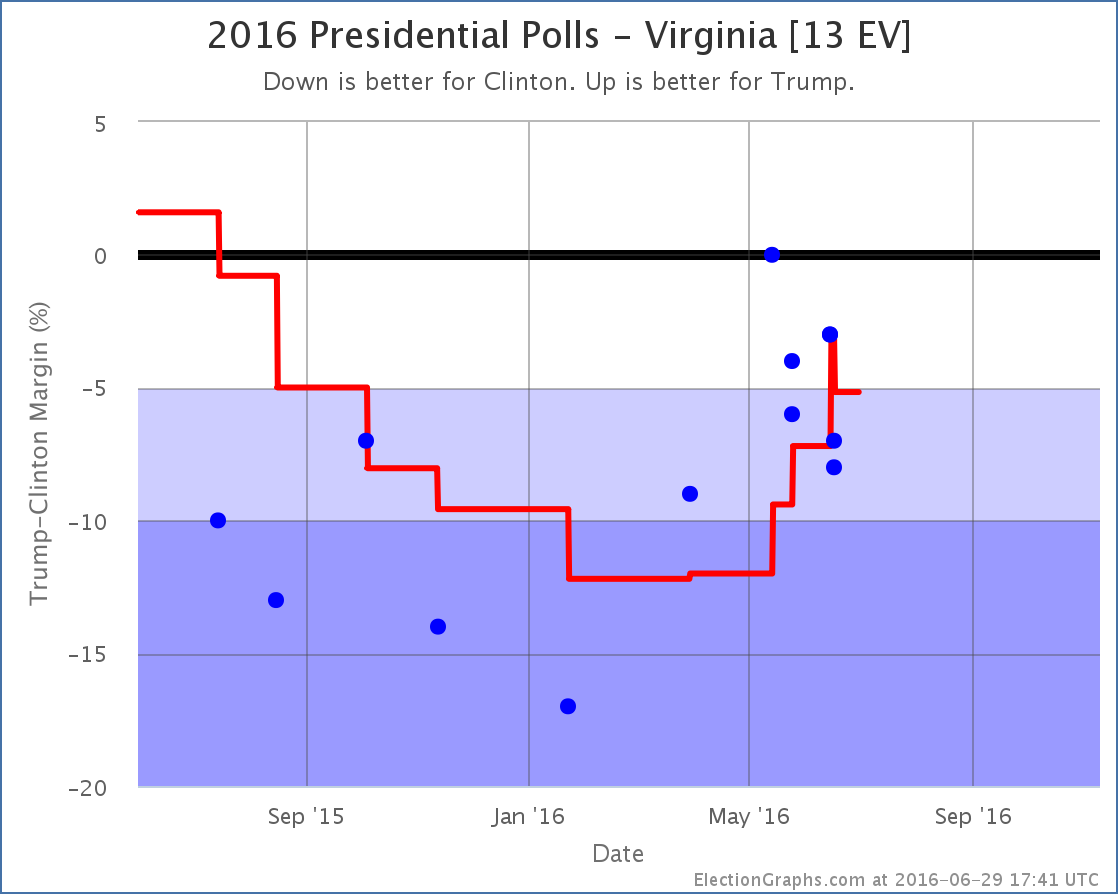
Virginia is also a state where Trump had made the state close, but the new polls wipe that out. Here the new Ballotpedia polls show Clinton ahead by 7% and 8%, and the new average is Clinton by 5.2%. This takes Virginia back out of Trump’s list of potential pickups and further damages his “best case”.
Ohio
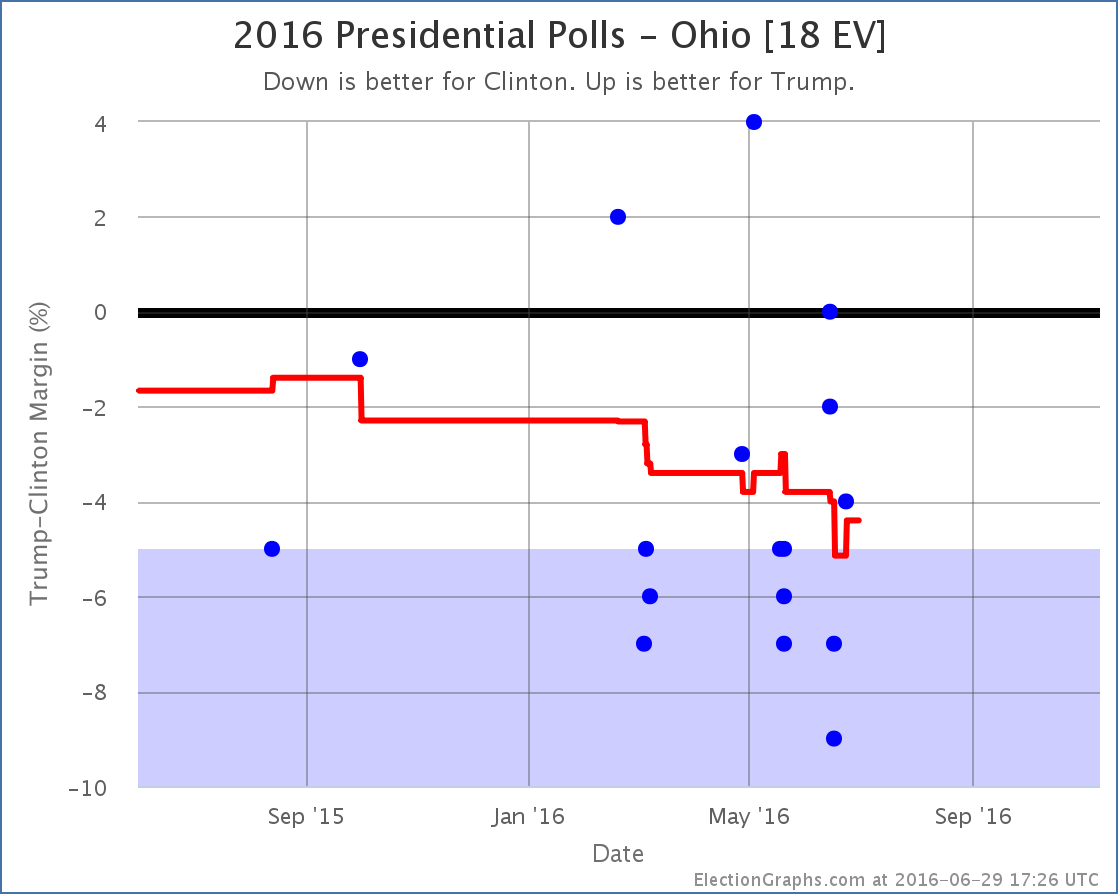
The new Ballotpedia polls (Clinton by 7% and 9%) actually briefly moved Ohio into the “Strong Clinton” category, but since there was already a later PPP poll (Clinton by 4%) there is no net category change in today’s update. The movement in Ohio, along with the movement in Pennsylvania, both contributed to the change in the tipping point though.
National Picture
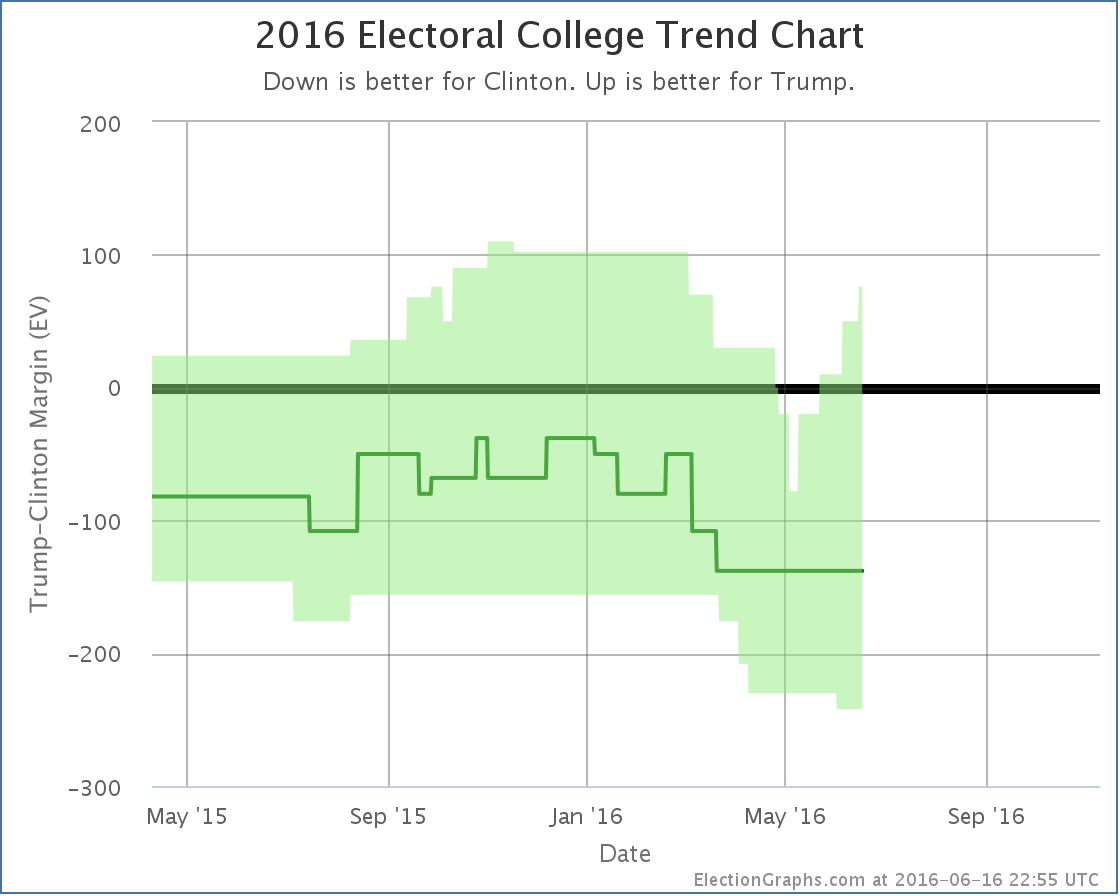
So where do all these changes put the national picture?
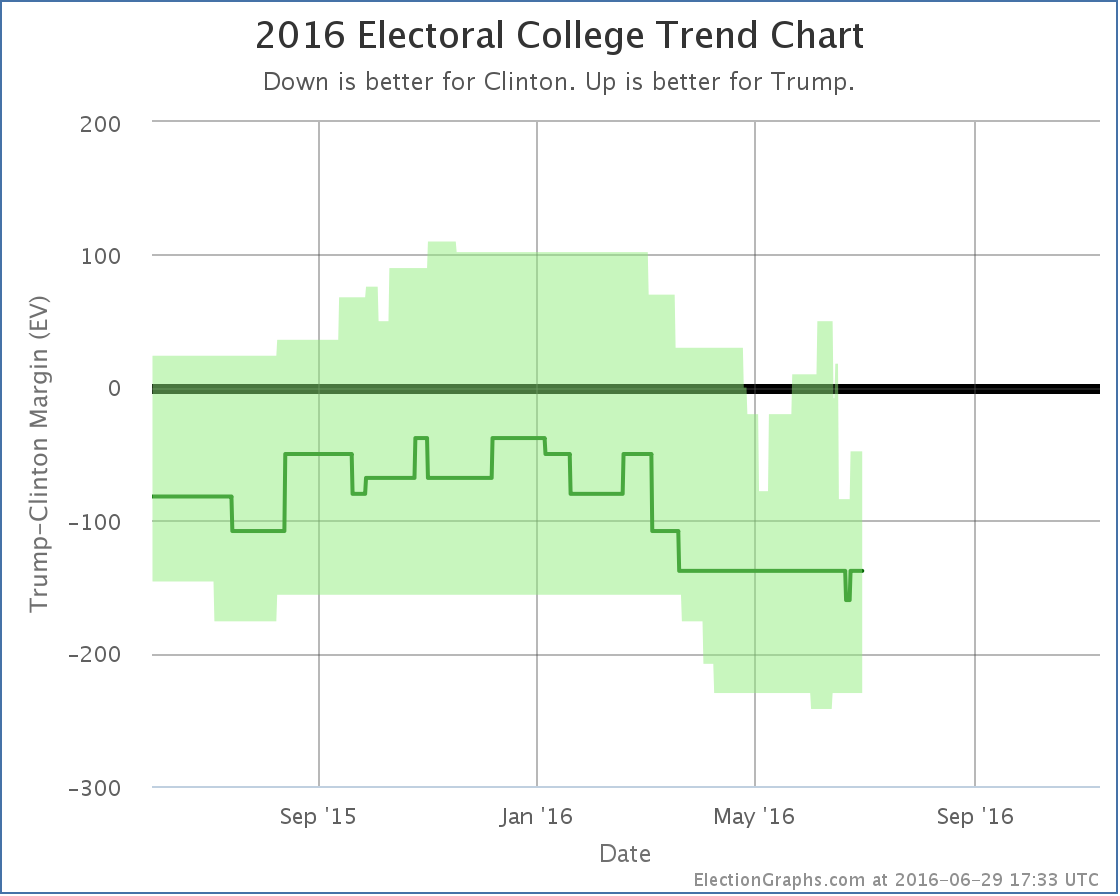
The most recent move on this chart is actually an upward movement toward Trump. This is Ohio moving back to “Weak Clinton” after the brief period as “Strong Clinton” described in the Ohio section. But the major move in todays updates is overall movement away from Trump.
Trump’s “expected case” moved from a 108 electoral vote loss (which is now wiped from the chart) to a 138 electoral vote loss, which is where the expected case has now been all but a few days since March.
Meanwhile Trump’s “best case” moved from an 18 electoral vote win, to a 48 electoral vote loss.
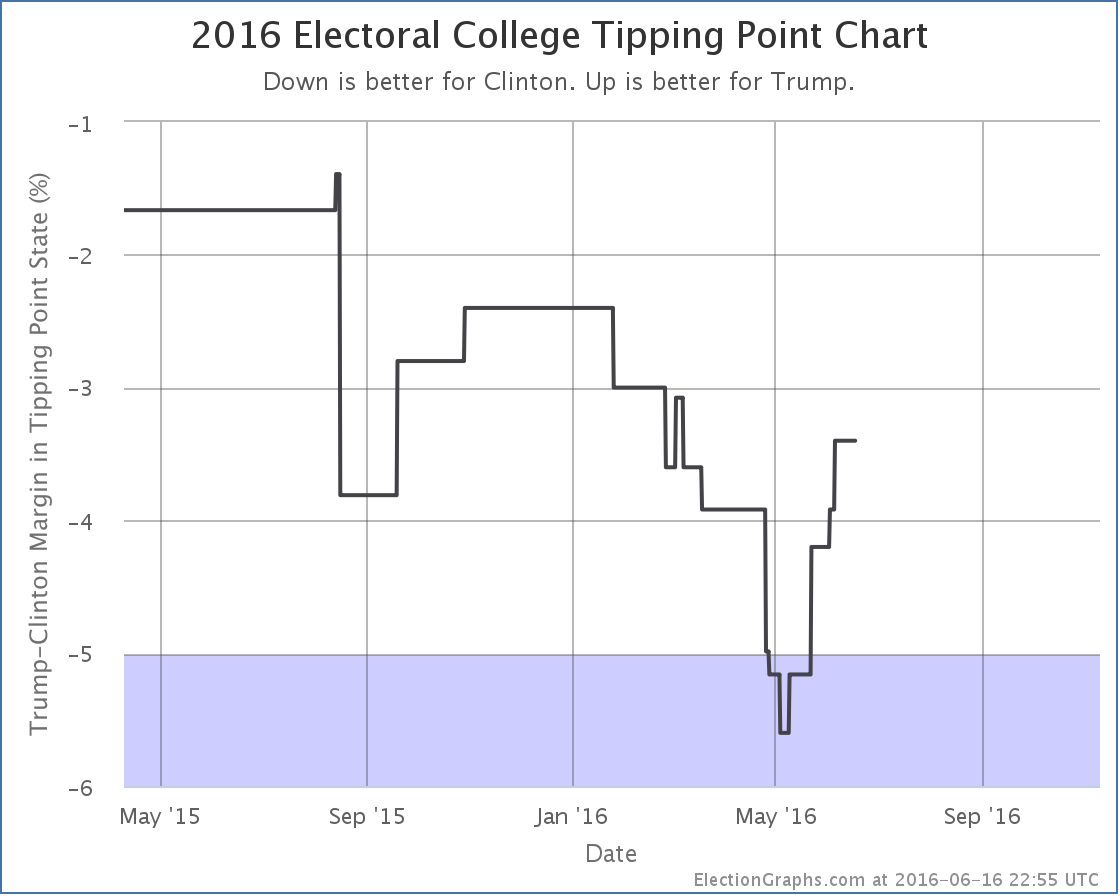
And the tipping point also moves:
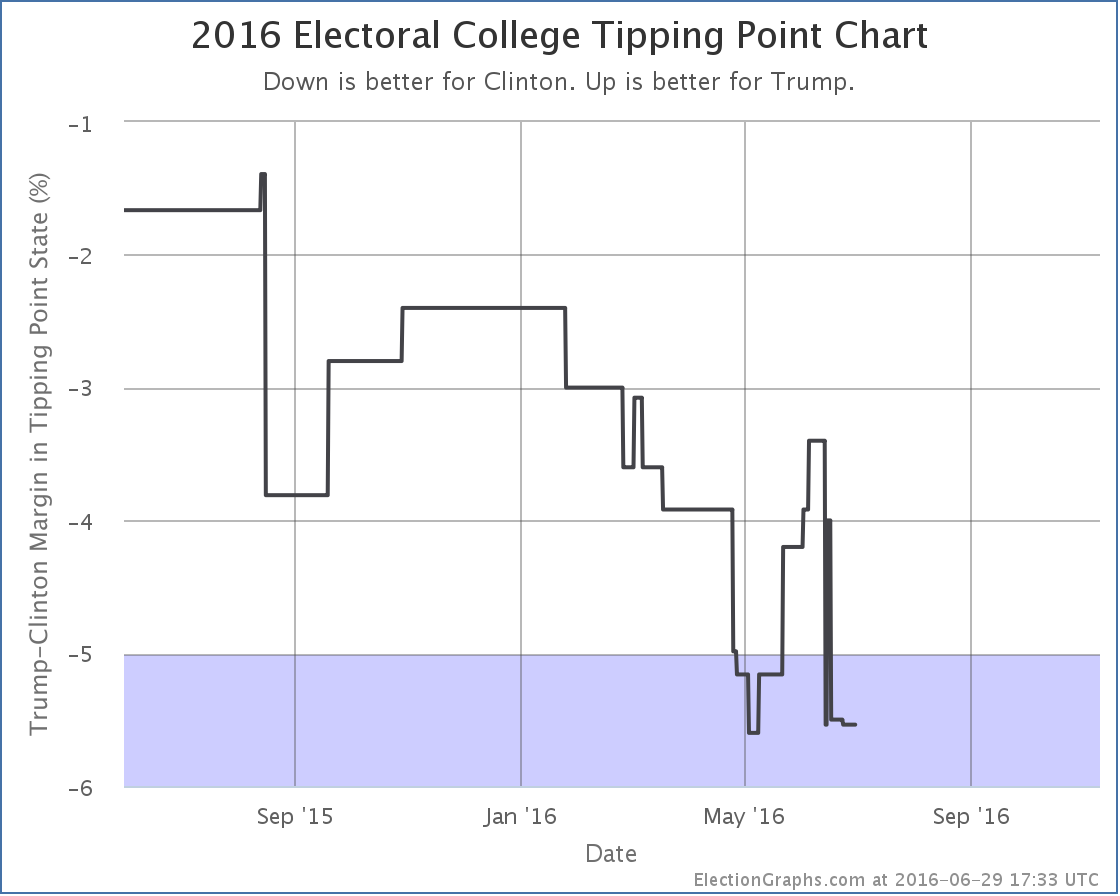
The tipping point moved from a 4.0% Clinton lead in Ohio, to a 5.5% Clinton lead in Minnesota.
The center of the spectrum of the states now looks like this:
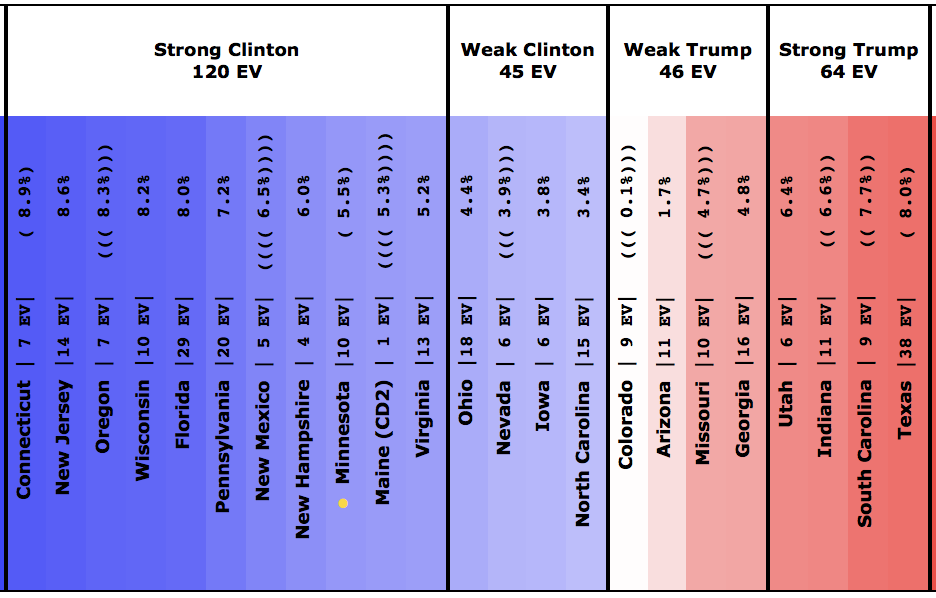
To be clear: Ohio, Nevada, Iowa and North Carolina currently look like “close states” that Trump could possibly pick up. Clinton doesn’t need any of them. She could give all four of them to Trump on a silver platter and he would still lose. She could throw in Virginia as well, and even give him the 2nd district of Maine… and she would still win.
Now, if these Ballotpedia results turn out to just be bad polling, the averages will pop back a bit more toward Trump once we get a few more polls in these states. But for the moment, Trump’s averages just took a serious dive. He isn’t in the worst shape against Clinton ever… that happened at the beginning of May… but he is close.
132.0 days until the polls start to close. Much more fun to come…
Note: This post is an update based on the data on ElectionGraphs.com. Election Graphs tracks both a poll based estimate of the Electoral College and a numbers based look at the Delegate Races. All of the charts and graphs seen in this post are from that site. Additional graphs, charts and raw data can be found there. Follow @ElectionGraphs on Twitter or like Election Graphs on Facebook to see announcements of updates or to join the conversation. For those interested in individual general election poll updates, follow @ElecCollPolls on Twitter for all the polls as they are added. If you find the information in these posts interesting or useful, please consider visiting the tip jar.
Since the last notable change, Jill Stein became the presumptive nominee of the Green party. So I folded in 4-way poll results that included her in AZ/NC/OH/NJ/GA/PA/FL/CT. I also added new polls in VA/WI/CA. Of all of these updates, changes only resulted from the additions in Virginia and Pennsylvania.
Interestingly, although Trump has been plummeting in the national polls the last few weeks (see Pollster and RCP), 4 out of the 5 state level category changes and 4 out of 4 tipping point changes here at Election Graphs since Trump became the presumptive Republican nominee have been in Trump’s favor.
I have been attributing this to the natural lag in the kind of state poll averages tracked here… but the trend has gone on long enough that there may be something else happening. It is actually starting to look like Clinton’s lead has been narrowing in a number of states, even while Trump has been falling further behind at a national level. This is an odd pattern. It will be interesting to see if it continues.
In the mean time, lets look at the latest example:
Virginia
In Virginia on the eve of Trump becoming the clear winner on the Republican side he was behind by 12% in the Election Graphs average. With every poll since then, his position has improved. He’s now behind by only 3.2%. The most recent results were from June 13-15… well after the narrative of Trump’s collapse in the national polls was taking hold, and after weeks of Trump doing and saying things that seemed to be damaging his prospects nationally.
But yet the newest results have Trump down only 3% in a state where he had a poll showing him down 17% back in January. This trend does not look like a collapse. Quite the contrary. It does look like Trump is in a downward spiral in the national polls. But in Virginia specifically, he is doing better than he has since last August.
It seems strange that Virginia would be rapidly moving in the opposite direction than the national polls. Perhaps if we had weekly polls in Virginia we might have seen a different picture. Perhaps there have been large swings up and down that are just invisible because there have not been enough polls to show it. Maybe. But with the data we have, it really looks like Virginia has been on a Trumpward swing, despite the national trends.
With Virginia now close, we now include Trump winning it in “Trump’s best case”. So a quick look at the national trend:
Aside from the one bump showing Clinton making Utah close, the trend here at the state level looks like Trump making a number of states closer. First Florida, then North Carolina, then Pennsylvania, now Virginia.
Trump isn’t flipping states, but he is making more states close. The national picture may look different, but at the state level, which is what actually determines the winner in November, there isn’t a Trump collapse visible yet. Trump is actually looking stronger.
Pennsylvania
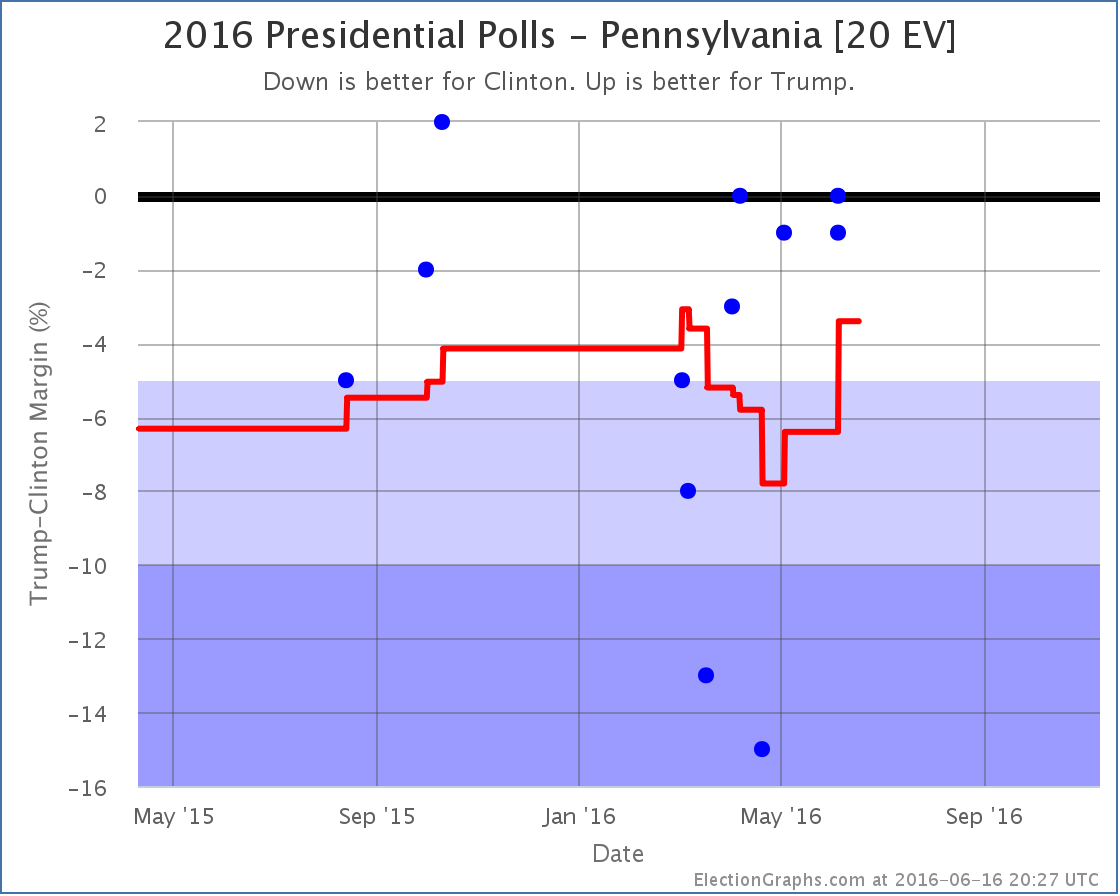
With Jill Stein now the presumptive nominee of the Green party, I added in a number of polls I had been tracking but not yet including in the analysis that included Jill Stein along with the major party candidates and Gary Johnson for the Libertarians. Among those was a poll in Pennsylvania showing a 1% Clinton lead over Trump. This did not change the status of Pennsylvania, which had already moved to Weak Clinton in the last update, but since Pennsylvania was the tipping point state, it moved that metric:
The tipping point state remains Pennsylvania, but the margin moves from a 3.8% Clinton lead to a 3.4% Clinton lead.
So with today’s updates, both Trump’s “best case” and his tipping point improve.
The downward trend in the national numbers may eventually show itself at the state level, but it hasn’t yet.
144.9 days until the polls start closing on Election Day 2016.
Note: This post is an update based on the data on ElectionGraphs.com. Election Graphs tracks both a poll based estimate of the Electoral College and a numbers based look at the Delegate Races. All of the charts and graphs seen in this post are from that site. Additional graphs, charts and raw data can be found there. Follow @ElectionGraphs on Twitter or like Election Graphs on Facebook to see announcements of updates or to join the conversation. For those interested in individual general election poll updates, follow @ElecCollPolls on Twitter for all the polls as they are added. If you find the information in these posts interesting or useful, please consider visiting the tip jar.
Once again the headline out of a state is Trump winning. In Nevada the delegate count was:
14 Trump, 7 Rubio, 6 Cruz, 2 Carson, 1 Kasich
To be on the glide path for a 1st ballot victory though, Trump needed 15 of the 30 delegates. So he fell slightly short.
Now, don’t misunderstand. This is still an impressive victory, and looking at the upcoming states he has a clearer path to victory than anybody else. His margins were higher in Nevada than many people expected. But if today’s performance was replicated in all of the other states, Trump would come to the convention with more delegates than anybody else, but not the majority needed to win outright. Of course as we continue more people will drop out, and the amount with which states give bonuses to the winners increases, so that still seems like an unlikely final outcome.
Right now Trump continues to do everything he needs to do to win. Lets look at some of the graphs, then we’ll do a quick look at the March 1st “Super Tuesday” states.
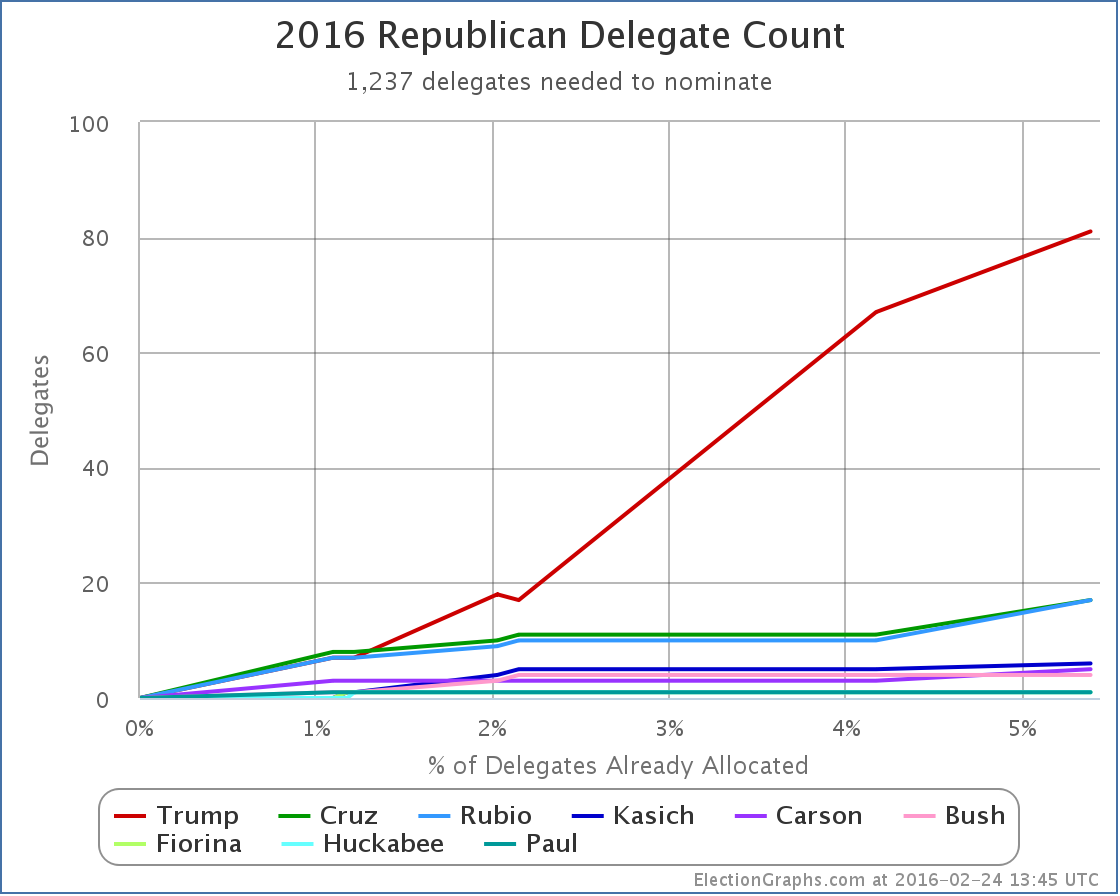
The overall delegate count is now:
81 Trump, 17 Cruz, 17 Rubio, 6 Kasich, 5 Carson, and 7 for people who have dropped out
Trump continues to dominate. Lets look at this as percentages:
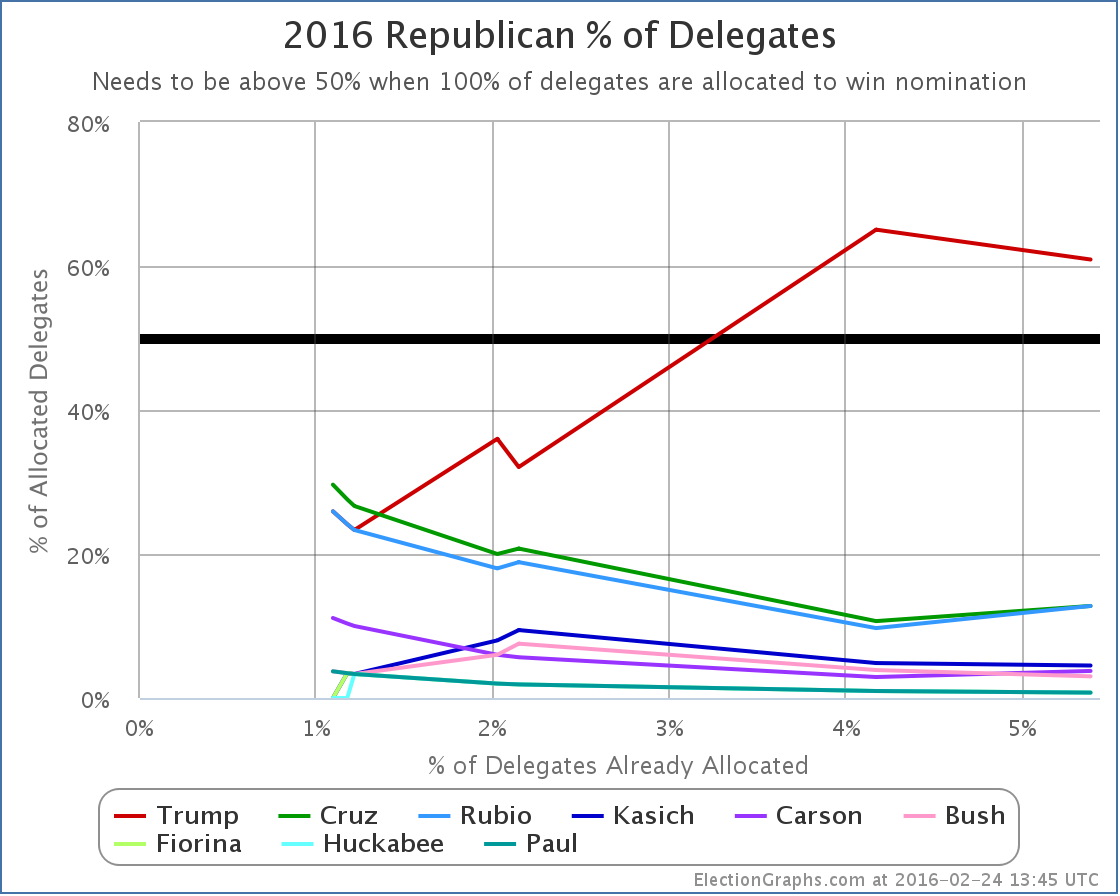
The “winners” here were actually Cruz, Rubio and Carson. Each of them improved their proportion of delegates with Nevada’s results. Trump actually went down. He doesn’t have to worry too much about that though. He still has a majority of the delegates allocated so far, and he is far far ahead of any of his opponents.
Finally, lets look at the “% of remaining delegates needed to win”, which I argue is the single most important thing to look at to understand where the race really is:
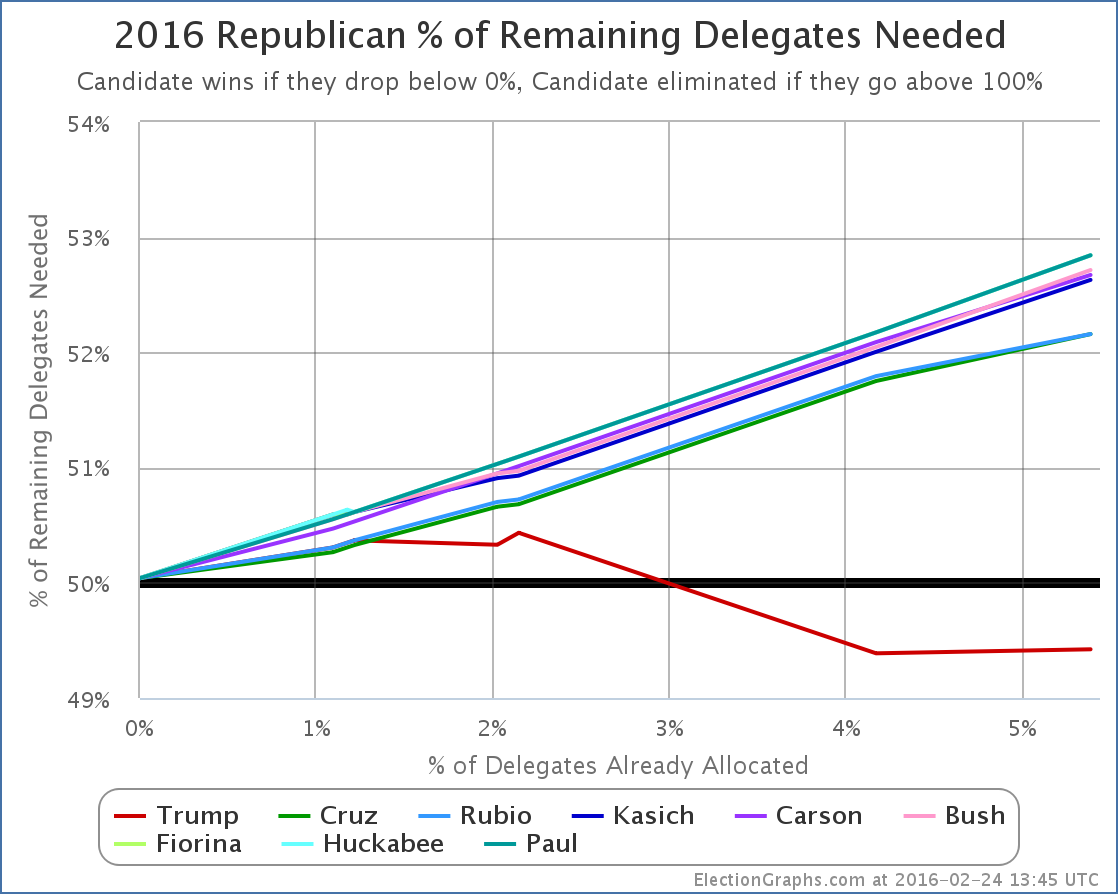
Because Trump got 14 delegates instead of 15 delegates, his line goes up a little bit. (Remember, on this chart down is good, up is bad.) The red line goes from needing 49.39% of the remaining delegates to needing 49.42%. This is a relatively trivial difference though. It is basically flat. Trump’s situation is very close to unchanged.
Meanwhile, the other lines keep going up at a decent pace. Kasich and Carson add about 0.6% to their numbers. Cruz and Rubio add about 0.4%.
This should be obvious, but the more they lose, the harder it is to catch up.
Many people are still talking about how as consolidation happens, the remaining non-Trumps will do better and the picture will change. Maybe, but nobody new announced they were dropping out after the Nevada results (yet anyway). So it looks like we may still go into March 1st with a five person race.
Lets run a hypothetical using current polling on the Super Tuesday states and see where we end up using RCP poll averages for the five remaining candidates. We’ll make delegate estimates based on the specific delegate allocation rules in each state.
Texas (155 delegates)
- Current poll averages: 37.3% Cruz, 28.0% Trump, 11.7% Rubio, 4.7% Carson, 3.0% Kasich
- Delegate estimates: 99 Cruz, 56 Trump
Georgia (76 delegates)
- Current poll averages: 35.0% Trump, 22.7% Cruz, 19.3% Rubio, 7.3% Carson, 6.3% Kasich
- Delegate estimates: 50 Trump, 26 Cruz
Tennessee (58 delegates)
- Last poll from November so using national average: 33.6% Trump, 20.4% Cruz, 16.4% Rubio, 9.8% Kasich, 7.4% Carson
- Delegate estimates: 37 Trump, 21 Cruz
Alabama (50 delegates)
- Last poll from December so using national average: 33.6% Trump, 20.4% Cruz, 16.4% Rubio, 9.8% Kasich, 7.4% Carson
- Delegate estimates: 32 Trump, 18 Cruz
Virginia (49 delegates)
- Using only February poll: 28% Trump, 22% Rubio, 19% Cruz, 7% Kasich, 7% Carson
- Delegate estimates: 17 Trump, 13 Rubio, 11 Cruz, 4 Kasich, 4 Carson
Oklahoma (43 delegates)
- Using only February poll: 32.5% Trump, 25.0% Cruz, 15.5% Rubio, 7.0% Carson, 0.0% Kasich
- Delegate estimates: 17 Trump, 15 Cruz, 11 Rubio
Massachusetts (42 delegates)
- Current poll averages: 41.0% Trump, 17.0% Rubio, 10.0% Cruz, 7.5% Kasich, 3.5% Carson
- Delegate estimates: 23 Trump, 9 Rubio, 6 Cruz, 4 Kasich
Arkansas (40 delegates)
- Using only February poll: 27% Cruz, 23% Trump, 23% Rubio, 11% Carson, 4% Kasich
- Delegate estimates: 18 Cruz, 13 Rubio, 9 Trump (giving Rubio the 2nd place finish breaking 23% tie by alphabetical order)
Minnesota (38 delegates)
- Last poll from January so using national average: 33.6% Trump, 20.4% Cruz, 16.4% Rubio, 9.8% Kasich, 7.4% Carson
- Delegate estimates: 18 Trump, 11 Cruz, 9 Rubio
Wyoming (29 delegates)
- No polls at all, using national average: 33.6% Trump, 20.4% Cruz, 16.4% Rubio, 9.8% Kasich, 7.4% Carson
- Delegate estimates: 12 Trump, 7 Cruz, 5 Rubio, 3 Kasich, 2 Carson
Alaska (28 delegates)
- Last poll from January so using national average: 33.6% Trump, 20.4% Cruz, 16.4% Rubio, 9.8% Kasich, 7.4% Carson
- Delegate estimates: 13 Trump, 8 Cruz, 7 Rubio
Vermont (16 delegates)
- No polls at all, using national average: 33.6% Trump, 20.4% Cruz, 16.4% Rubio, 9.8% Kasich, 7.4% Carson
- Delegate estimates: 10 Trump, 6 Cruz
OK, that’s it. Adding all that up…
Estimated Super Tuesday delegate totals: 294 Trump, 246 Cruz, 67 Rubio, 11 Kasich, 6 Carson
That gives Trump 47.1% of the super Tuesday delegates, Cruz 39.4%, and everyone else much less.
Trump needs 49.4% of the delegates to be on the path to an outright win though! So 47.1% would be in the realm where heading to a contested convention might be possible! Still unlikely, as the additional states in March will add up fast, and more candidates are likely to drop out. Still though, possible!
Adding in the existing delegates, we’d have a post-Super Tuesday race that looks like this:
375 Trump, 263 Cruz, 84 Rubio, 17 Kasich, 11 Carson, 7 for candidates who have already dropped out
Now, these are estimates based on current polling, and very few of these states were well polled as of this post, so much of the above is based on one or two polls, or using the national averages rather than state polls. And I had to make the assumption that all congressional districts would mirror state results (which is unlikely to be true). And Wyoming actually elects individual delegates rather than doing things based on candidate preference, so it may be an oddball in the end. And of course things are likely to change further before people actually vote next Tuesday. But… the general outlines of this aren’t likely to be too far off.
If this is even remotely close to where we are on March 2nd, we end up with Trump very close to the 50% of delegate mark. (The above has him EXACTLY at that mark.) He would need just a LITTLE bit more to actually push him over the edge to a clean win.
The flip side of that though is the combination of all the anti-Trumps would need just a LITTLE bit more in order to have this be on the path to a contested convention. I mentioned earlier that this is still an unlikely outcome. It is. After March 1st, the disproportionality of delegates given to the winner increases, and after March 15th we have pure winner take all states as well. If Trump remains in the overall lead, even with a plurality, then that is all it takes to push him over the edge.
If the anti-Trumps want to have any hope here at all, they need to be in a position by mid-March that they can win not just a few, but many states of the winner-take-most and winner-take-all variety. And frankly, the most likely scenario even then is just forcing a contested convention where Trump still has the most delegates, not someone else winning outright.
The anti-Trumps would have a hard road to get to an outright win. Cruz would need 56.8% of the remaining delegates to catch up and win after March 1st if things played out like my estimates above.
If you had to make a guess based on what we know now, a Trump nomination is far more likely than any other… and with an outright delegate majority on the first ballot, not after a contested convention.
6 days until Super Tuesday. We’ll see how close my estimates above turn out to be.
Update 2016-02-26 07:17 UTC – On February 22nd New Hampshire certified the results of their primary. In the final tally Trump had one more delegate than previous estimates, and Rubio one less. This did not seem worthy of a separate post, but a note here seemed appropriate. The totals on ElectionGraphs.com have been updates appropriately. This does not substantively change any of the analysis above.
Note: This post is an update based on the data on ElectionGraphs.com. Election Graphs tracks both a poll based estimate of the Electoral College and a numbers based look at the Delegate Races. All of the charts and graphs seen in this post are from that site. Additional graphs, charts and raw data can be found there. All charts above are clickable to go to the current version of the detail page the chart is from, which may contain more up to date information than the snapshots on this page, which were current as of the time of this post. Follow @ElectionGraphs on Twitter or like Election Graphs on Facebook to see announcements of updates or to join the conversation. For those interested in individual general election poll updates, follow @ElecCollPolls on Twitter for all the polls as they are added.
[Edit 16:28 UTC to correct math on % of remaining Cruz would need after Super Tuesday, I’d originally shown a higher number around 61%.]
[Edit 2016-02-27 17:06 UTC to fix place where Kasich had been autocorrected to Quash.]
[Edit 2016-02-28 22:03 UTC to add dropped out candidates to the after Super Tuesday estimate.]
Continuing the trend, in today’s update Clinton just weakens further. Let’s just jump right into the details:
Clinton vs Bush
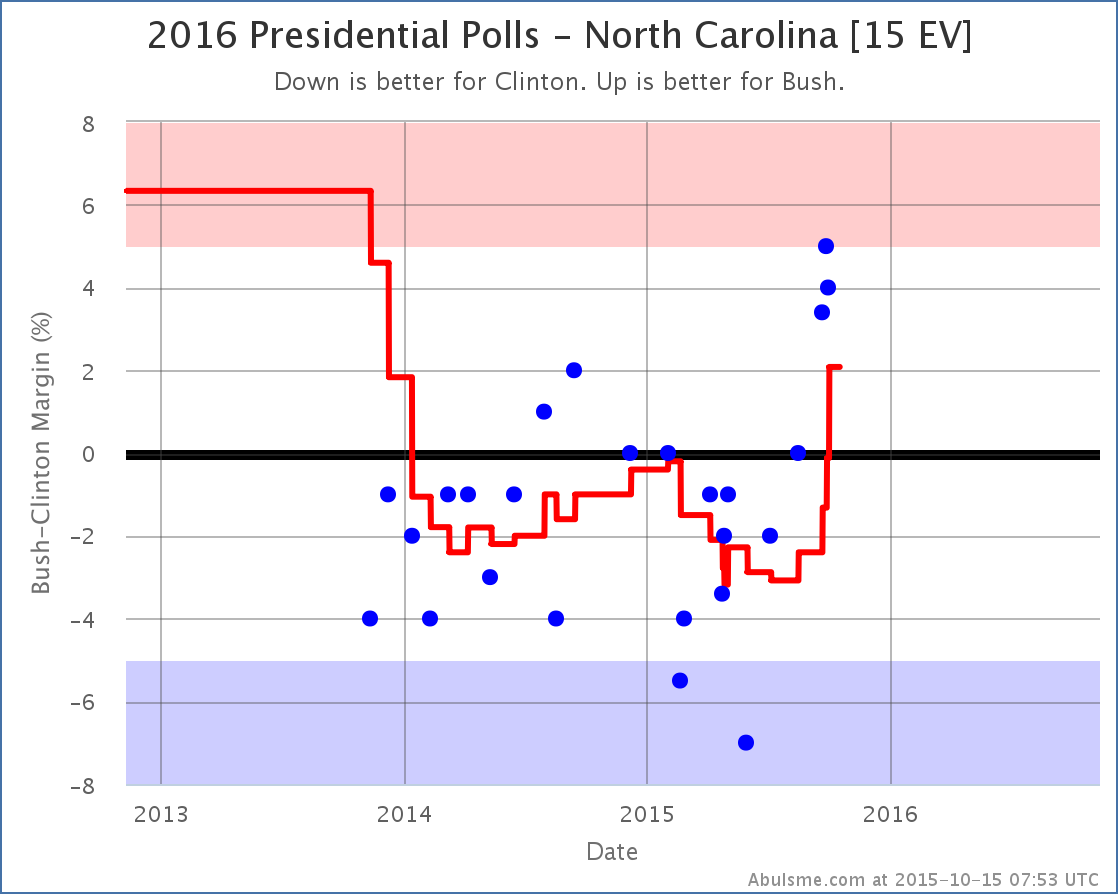
With the latest polls Bush surges to the lead in North Carolina. This has been a pretty quick move. All three polls taken since mid-September have shown a Bush lead. Before that he hadn’t managed better than a tie in North Carolina since September 2014.
This of course improves Bush’s “expected case” where he wins all the states where he leads in my poll average:
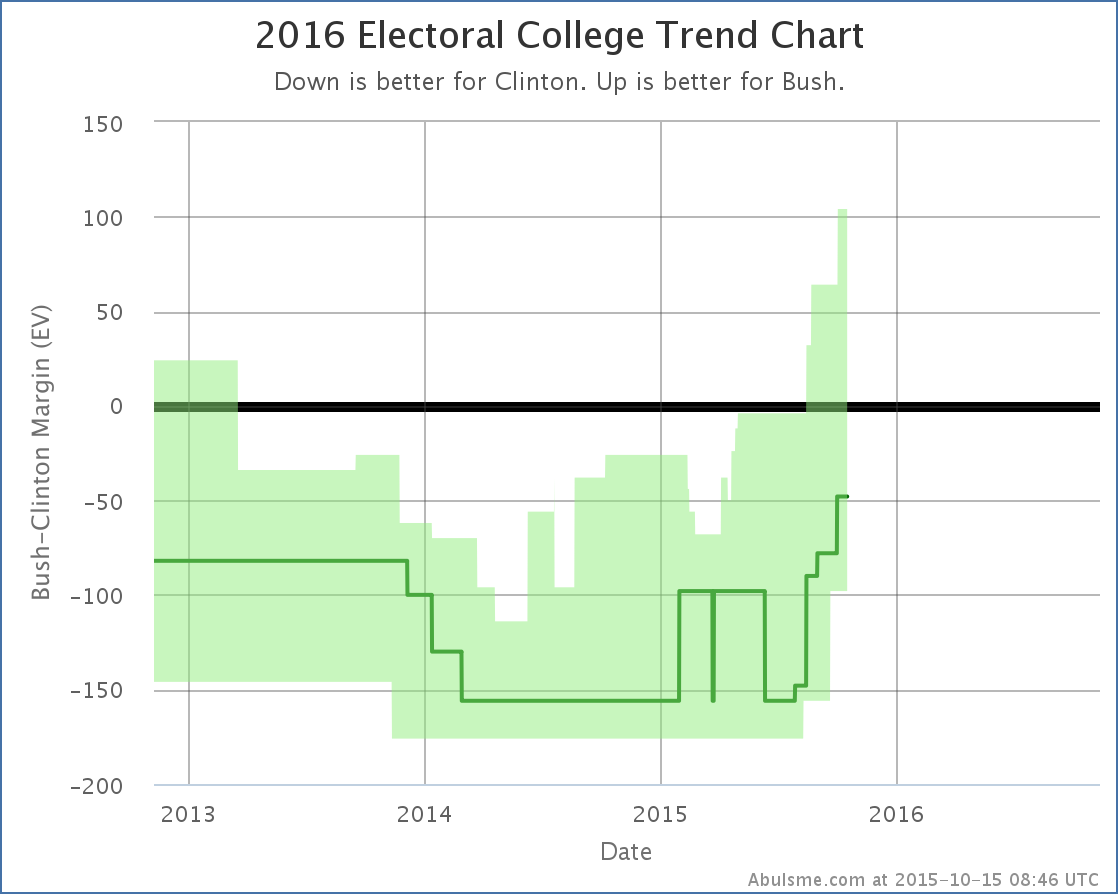
This brings the expected result to Clinton 293 to Bush 245. Still a 48 electoral vote loss for Bush, but that is closer than it has ever been before.
Bush also improved against Clinton in Virginia. This did not result in a category change, but it did move the tipping point further in Bush’s direction:
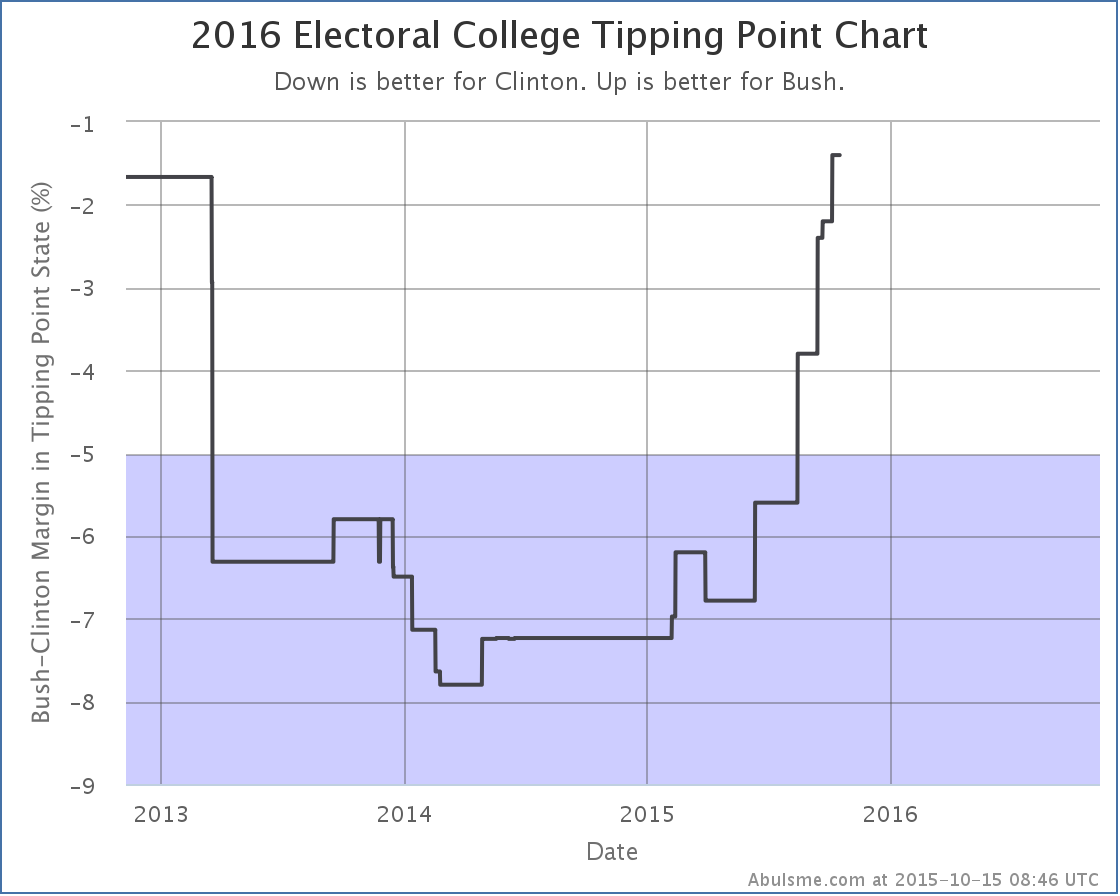
The tipping point is now 1.4% in Michigan in Clinton’s favor. So a national poll move of as little as 0.7% would flip the electoral college to Bush’s side. Bush may not be leading yet like Rubio is, but he is actually very close to that. His best case is to win by 104 electoral votes if he gets all the close states. So Bush is certainly competitive with Clinton at the moment.
Bush vs Christie
Christie? Is he still running? I thought he was just about gone. Before today’s update, nobody had bothered to include Christie in a state level poll since late August. More than a month. But CNU decided to include him in a new Virginia poll, and it improved his position in Virginia:
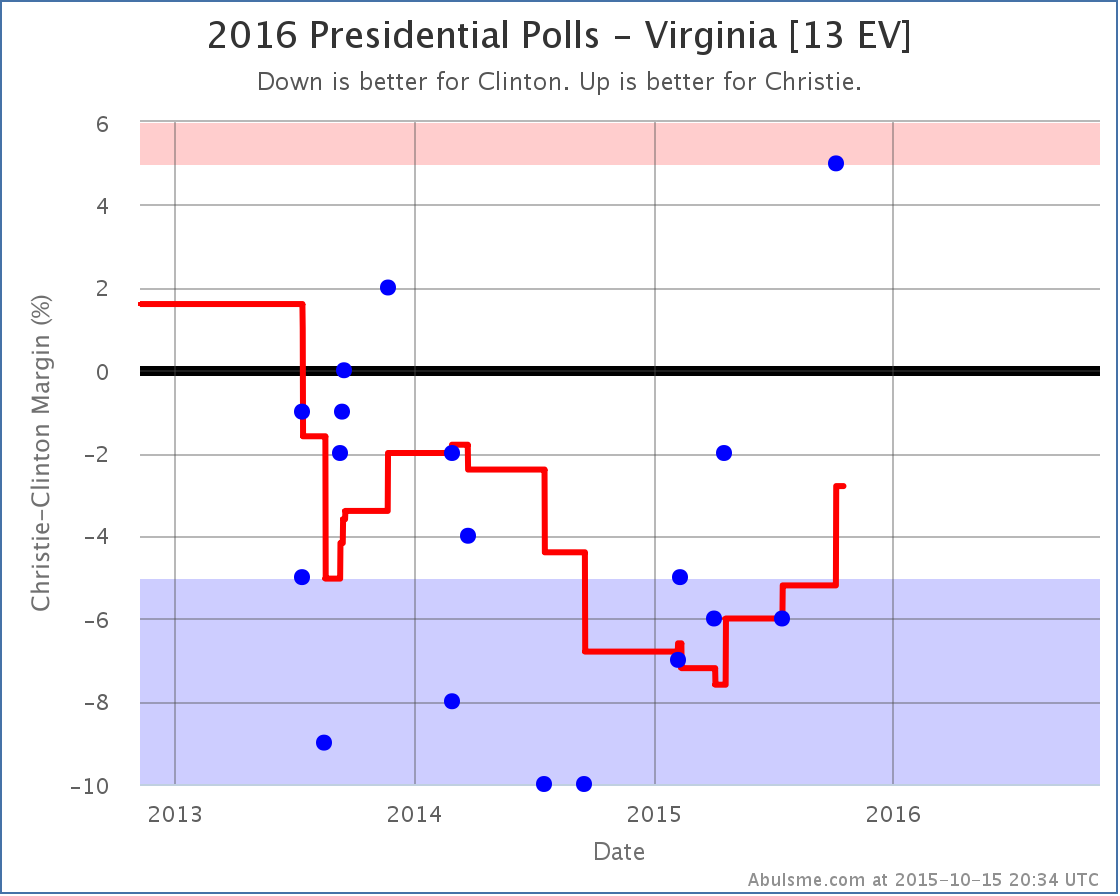
This drops Clinton’s lead against Christie in Virginia to only 2.8%, making the state once again a “swing state” that could go either way.
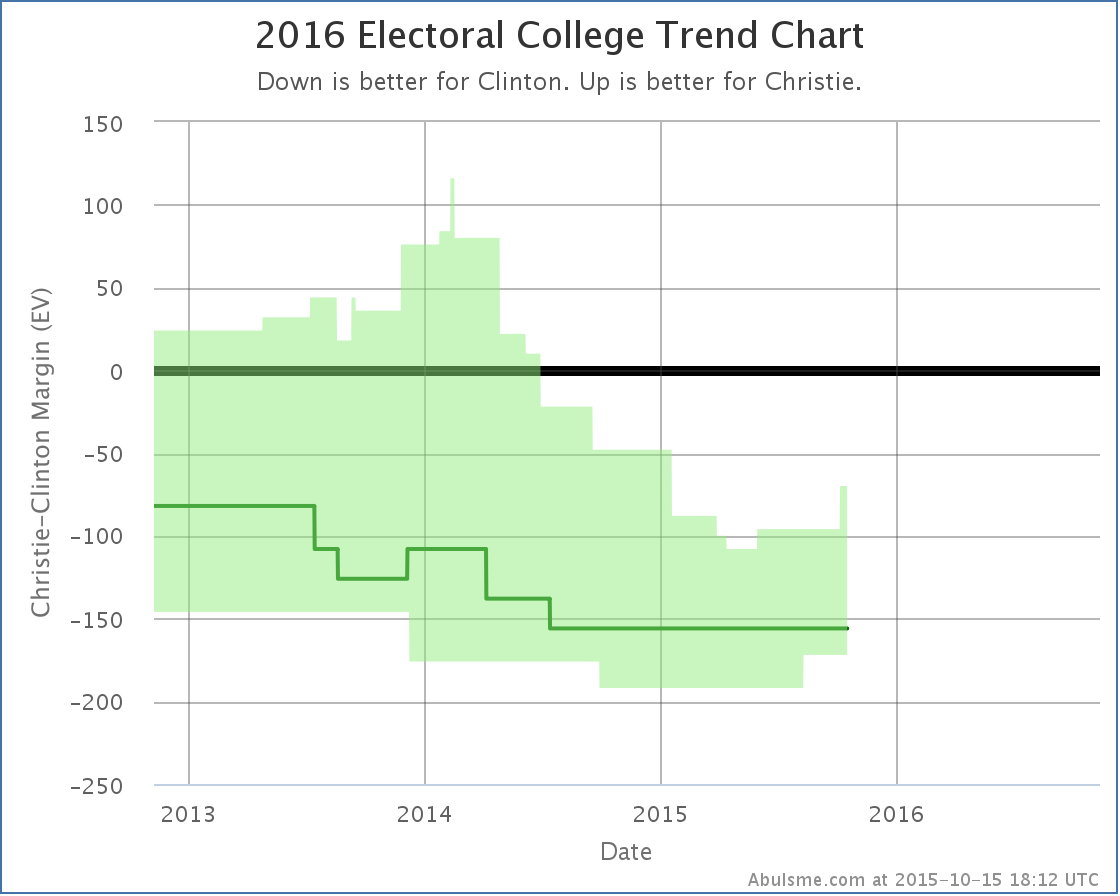
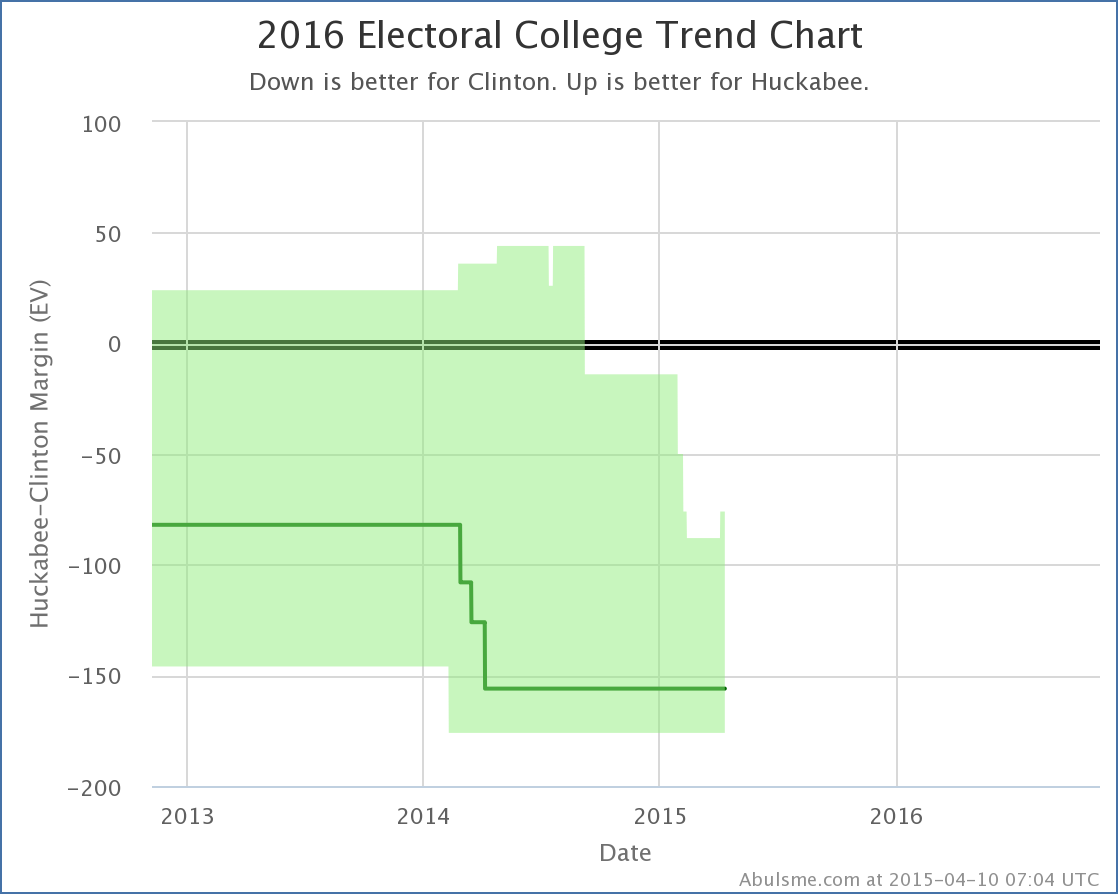
Christie’s best case, if he wins all of the close states, is now to lose by 70 electoral votes. His expected case is still to lose by 156 electoral votes. Unlike Bush, Christie is not competitive with Clinton at the moment. Things can change quickly though, so you never know! But with Christie at 1.9% in the RCP average of national Republican polls, I’m not sure if Christie will have a chance to find out.
390.1 days until the polls start to close!
Note: This post is an update based on the data on ElectionGraphs.com. All of the charts and graphs seen here are from that site. Graphs, charts and raw data can be found there for the race nationally and in each state for every candidate combination that has been polled at the state level. In addition, comparisons of the best polled candidate combinations both nationally and each in each state are available. All charts above are clickable to go to the current version of the detail page the chart is from, which may contain more up to date information than the snapshots on this page, which were current as of the time of this post. Follow @ElecCollPolls on Twitter for specific poll details as I add them. And like Election Graphs on Facebook!
To get the headline out of the way… for the first time since officially launching my 2016 electoral college polling tracking back in November, one of the Republicans with a significant amount of state level polling is within reach of Clinton. We now see a scenario where “if the election was held today” and the Republican was to outperform their polling… but by an amount that is not inconceivable… then the Republican would win.
Specifically, while Clinton is still ahead against all five of the “best polled” Republicans challenging her (Bush, Rubio, Paul, Christie and Huckabee), if you give Rubio not only all the states he is already ahead in, but also all of the states where Clinton’s lead is less than 5%, then we end up with Clinton 265 to Rubio 273, a narrow 8 electoral vote victory for Rubio. The idea here is that a 5% lead is small enough that it can easily slip away under the right circumstances. So this does’t mean that Rubio is actually ahead, but it means that Rubio winning against Clinton is within the realm of the plausible.
This also shows up in the “tipping point”, which now shows a Clinton lead of less than 5% for the first time since our launch:
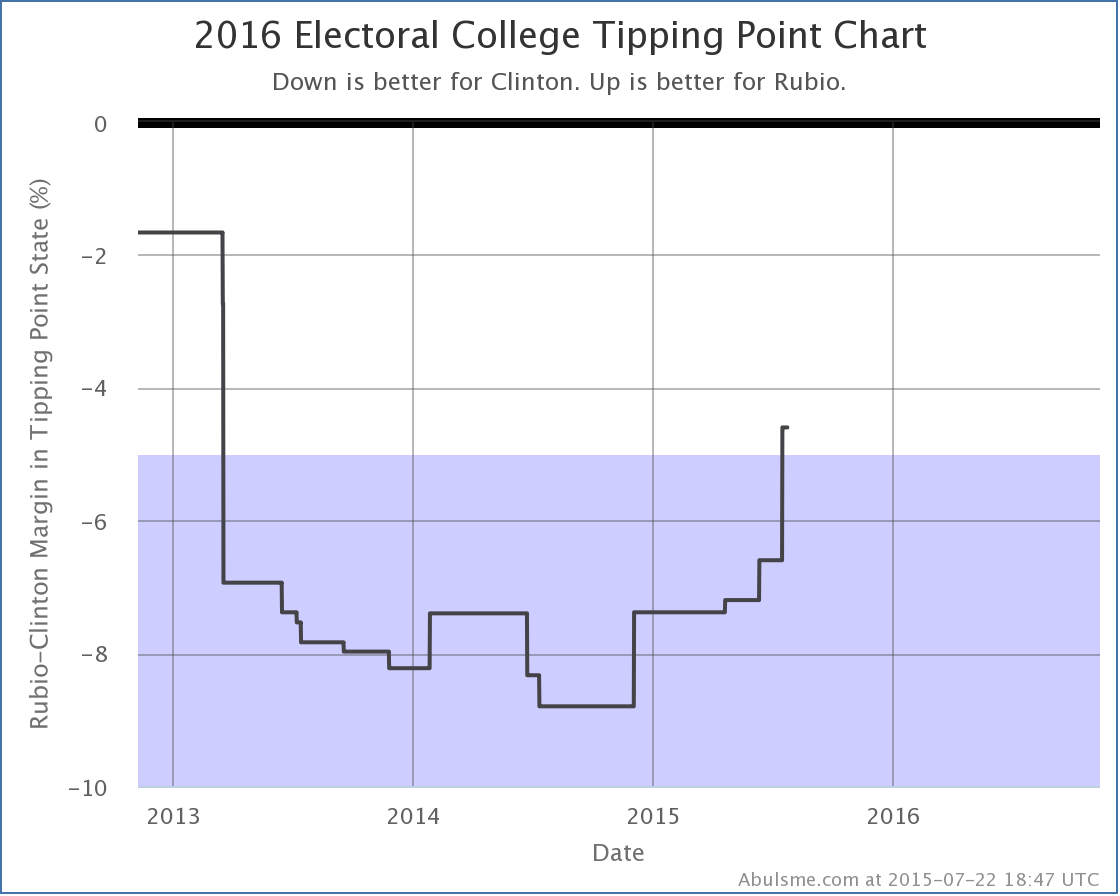
Rubio is the first Republican to manage this, but trends have been against Clinton in recent months. Bush is just barely short of this marker. His best case is to lose by only 4 electoral votes. If he makes one more state close, winning will also be within range. And Paul isn’t that much further behind.
Yes, yes, Clinton is still significantly ahead, the best any Republican does if you just give them the states they are actually ahead in is to match Romney’s loss in 2012. But still, we now have at least one Republican where the polls are close enough that a victory is at least imaginable! So as per the title we have a race!
Now the state level details for those who want them…
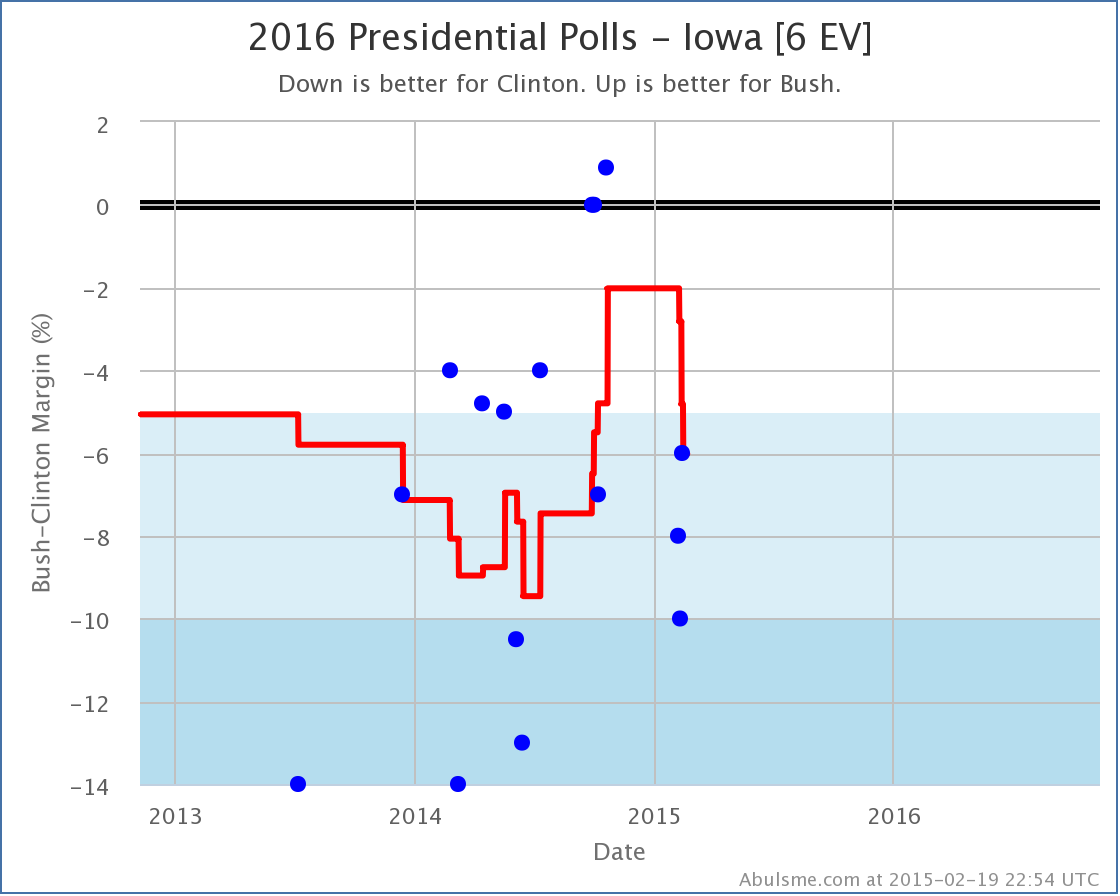
Qunnipiac released the latest results in their Presidential Swing State Poll series today. There was a lot of buzz about how bad it was for Clinton, showing her behind to Bush, Walker and Rubio in Colorado, Iowa and Virginia. Indeed, this single poll looked really bad for her in all three states… in fact enough out of line with other recent results that it is very tempting to think it may just be an outlier rather than a real indication of a major change.
Of course, that is why we do poll averages. Looking at the averages, adding these new results moves things toward the Republicans, but nowhere near as dramatically as if you just looked at the Quinnipiac results in isolation.
Quinnipiac polled nine different candidate combinations, but I only look at the five combinations that have the best polling over all. So I’m not going to talk about the Sanders vs Bush matchup that Quinnipiac polled. Sorry. (That’s the 17th best polled candidate combination by the way.)
Anyway, of the five best polled combinations, only Clinton vs Rubio had any significant changes. Beyond the headline, lets look at the two states that actually changed status.
First off, Colorado:
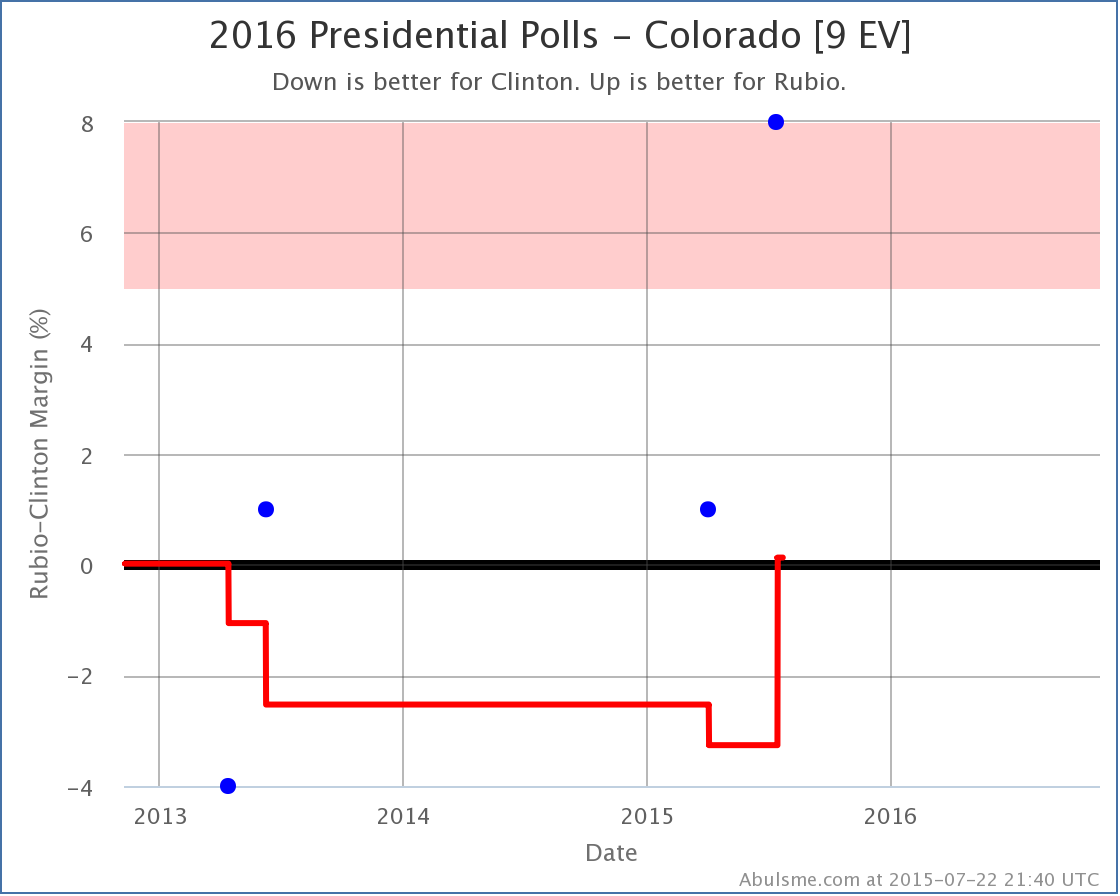 ‘ ‘
Clinton vs Rubio in Colorado has been very lightly polled… only four polls since the 2012 election, so the 2012 election results themselves are still included in the average. But the latest result is just enough to leave Rubio ahead by 0.1%. With Rubio now ahead in Colorado, the “expected” electoral college result moves to Clinton 338, Rubio 200, a 138 electoral vote margin for Clinton. (For comparison, Obama’s margin over Romney was 126 electoral votes.)
Virginia also changed categories:
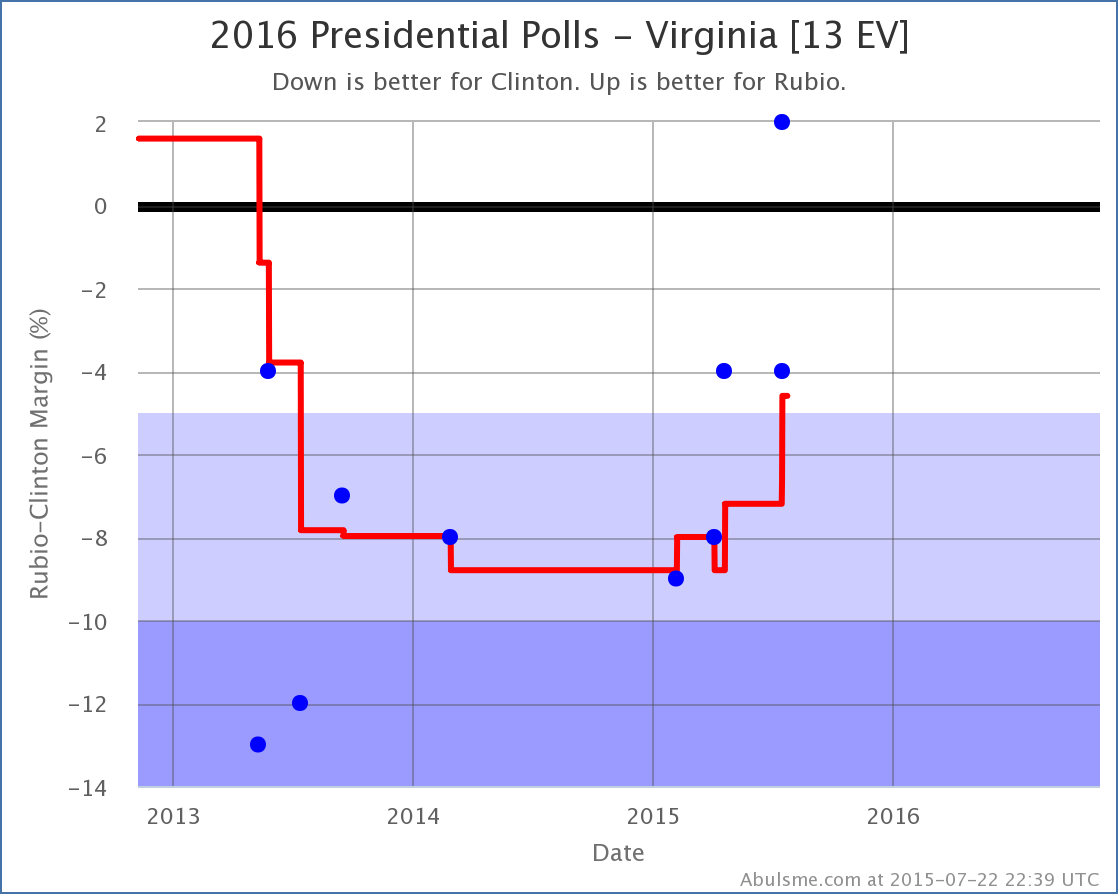
There have been quite a few more Clinton vs Rubio polls in Virginia than there were in Colorado. The new Quinnipiac poll accelerated a trend toward Rubio, and pushed Virginia from “Strong Clinton” to “Weak Clinton”. This is of course what prompted the improvement in Rubio’s best case and put him within reach of Clinton.
The full Clinton vs Rubio spectrum looks like this today:
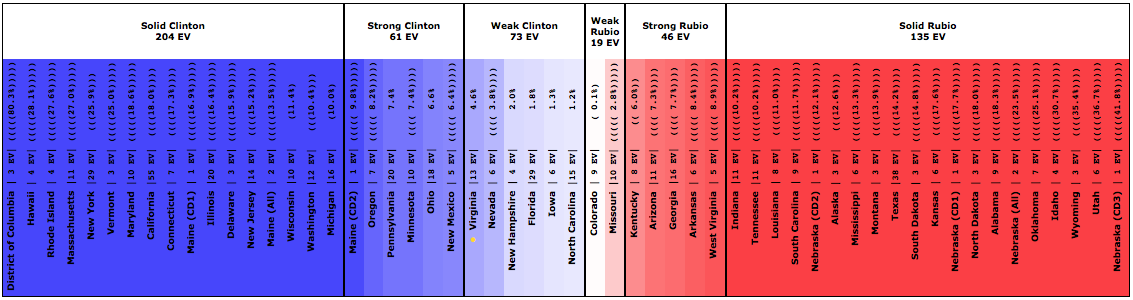
And the full summary:
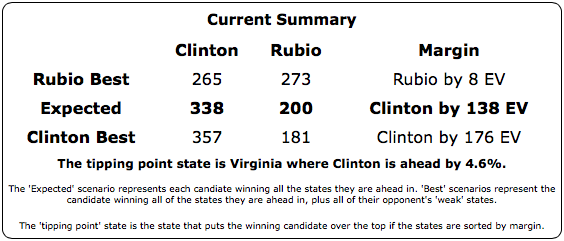
To win, Rubio would still need to flip North Carolina (1.2% Clinton lead), Iowa (1.3% Clinton lead), Florida (1.8% Clinton lead), New Hampshire (2.0% Clinton lead), Nevada (3.8% Clinton lead) and Virginia (4.6% Clinton lead). That sounds like a lot, but if national events or campaigning move things across all states, it means only 2.3% of voter have to change their minds to change the outcome. Even in today’s highly polarized climate, that is easily imaginable.
So, for the first time since the 2012 elections, it is starting to look like we have a real race. This is not unexpected. In my November post “The Race Begins” I said:
The real campaign against Clinton hasn’t ramped up yet. Lots of mud will be thrown. And the Republican candidates will get more and more visibility. Although anything is possible in either direction, it is quite possible that what we are seeing right now will be Clinton’s high water mark. The race is likely to get closer as we move through 2015 and people get more engaged.
Yup. That looks like what has been happening.
475.0 days until the first general election polls close.
Note: This post is an update based on the data on my 2016 Electoral College Analysis Site. All of the charts and graphs seen here are from that site. Graphs, charts and raw data can be found there for the race nationally and in each state for every candidate combination that has been polled at the state level. In addition, comparisons of the best polled candidate combinations both nationally and each in each state are available. All charts above are clickable to go to the current version of the detail page the chart is from, which may contain more up to date information than the snapshots on this page, which were current as of the time of this post. Follow @ElecCollPolls on Twitter for specific poll details as I add them.
Since my last electoral college post, there have been PPP polls in Virginia and Nevada. The only one of the top five “best polled” candidate combinations with a significant change is Clinton vs Paul, and it is good news for Paul.
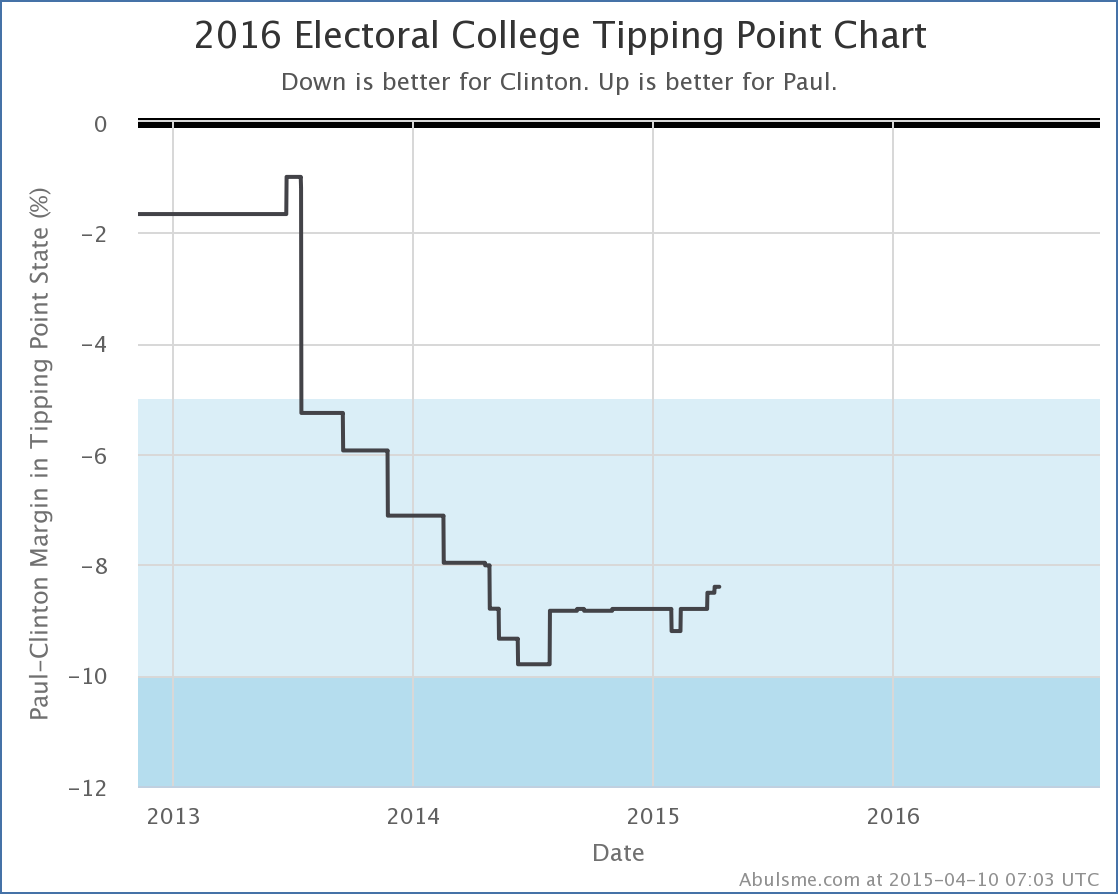
Clinton vs Paul
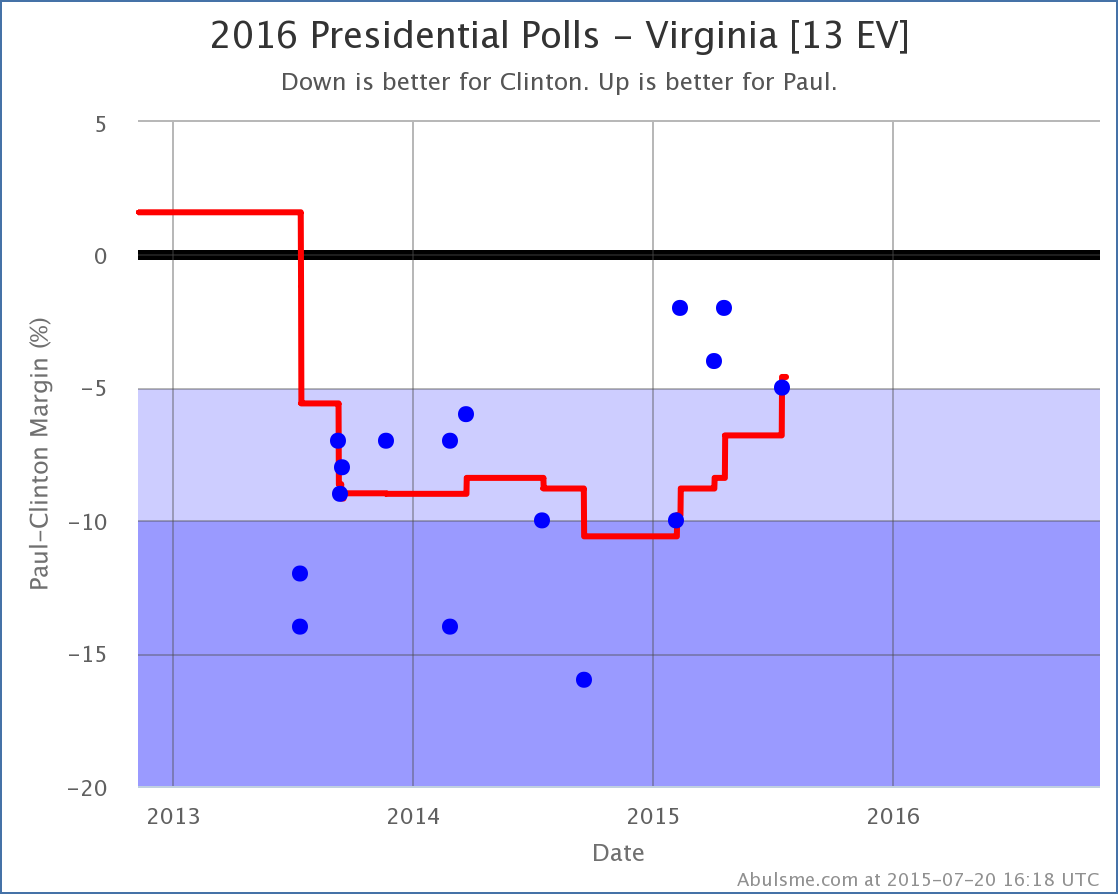
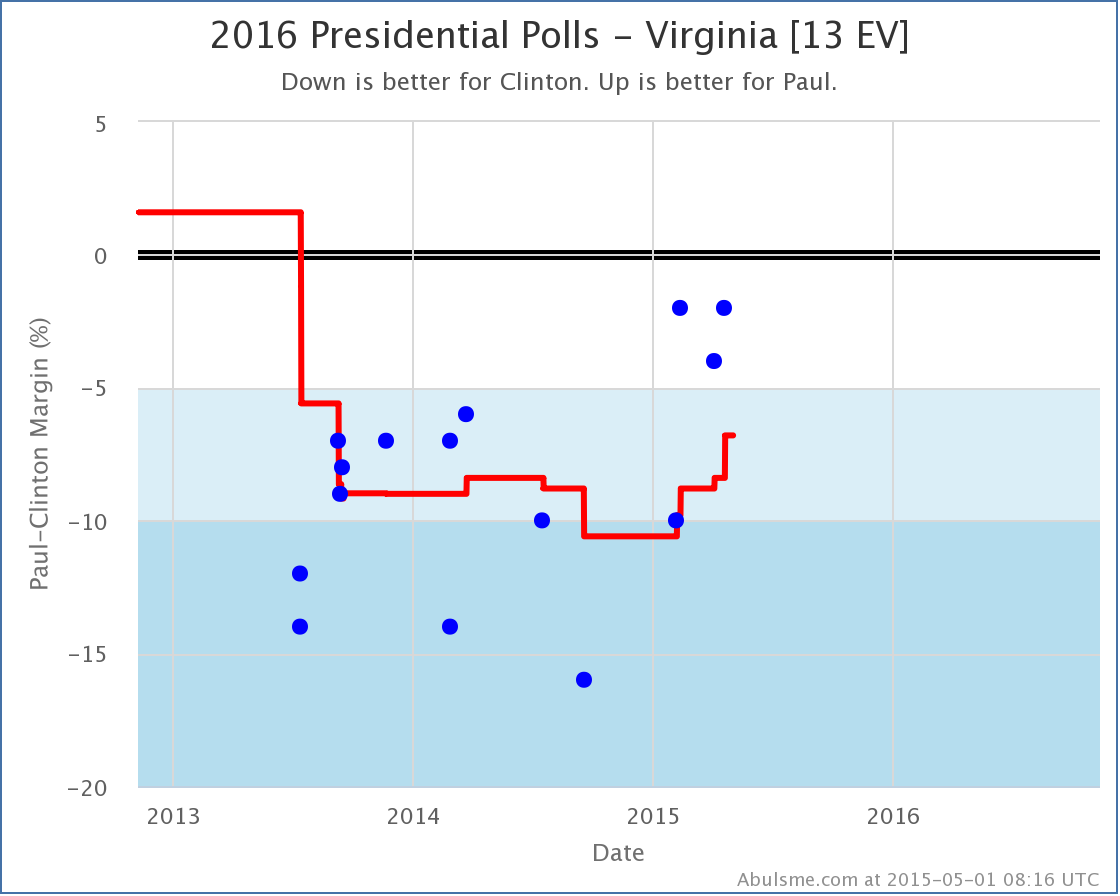
With this latest poll, my average of Clinton vs Paul in Virginia moves to Clinton by 4.6%. While still a substantial Clinton lead, it means Virginia moves to “Weak Clinton” in my average, and I now allow the possibility that Paul could win Virginia. This improves his “best case” where he wins all the states where he leads in the polls, plus all the states where Clinton is ahead by less than 5%.
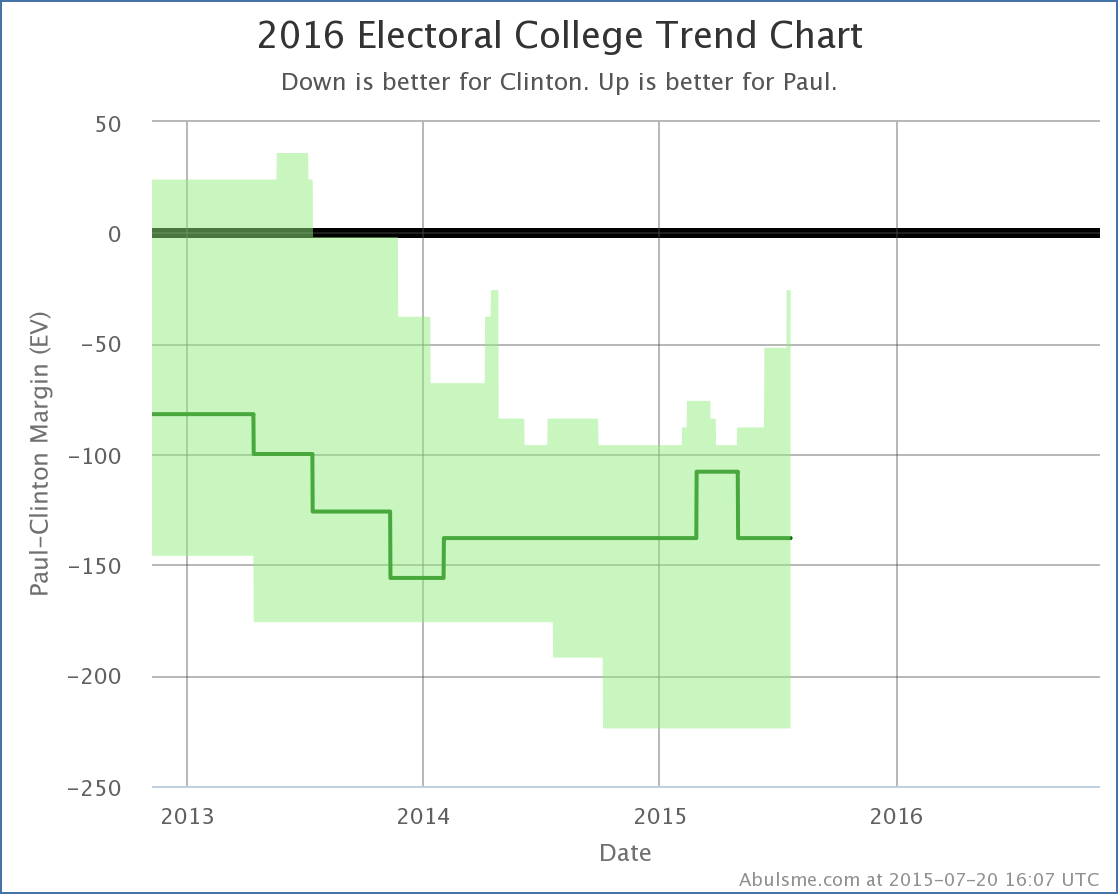
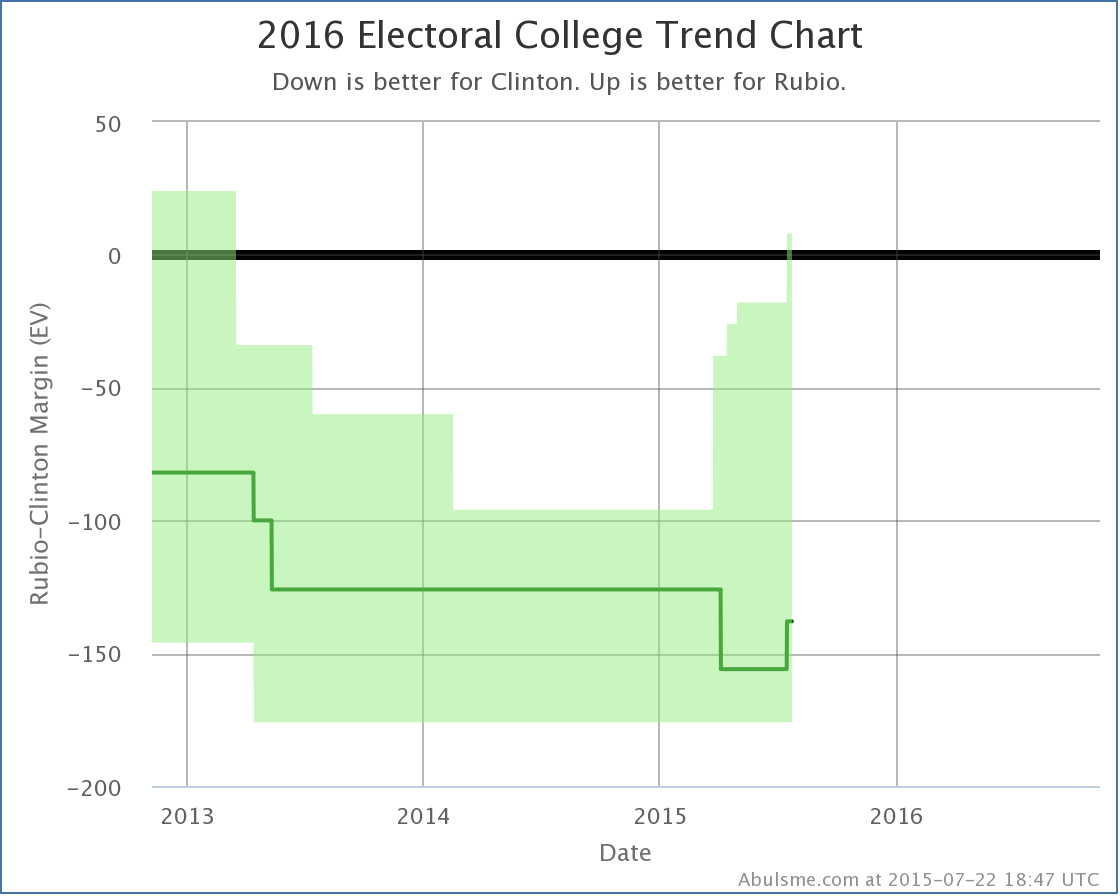
The spike on the upper right is this improvement. Paul’s best case here is still to lose by 26 electoral votes, but this is better than his best case has been since April 2014, and it has been on an upward trend since the beginning of May. So while he isn’t really moving the needle yet on actually bringing more states over to his side of the fence, he is making a few closer, which of course needs to happen first.
The change in Virginia also moved the “tipping point”… basically how far ahead the winning candidate is in the state that would “put them over the edge” in the electoral college. This is a measure of how much polls would have to move nationally, taking into account the structure of the electoral college, in order to flip the election to the other side.
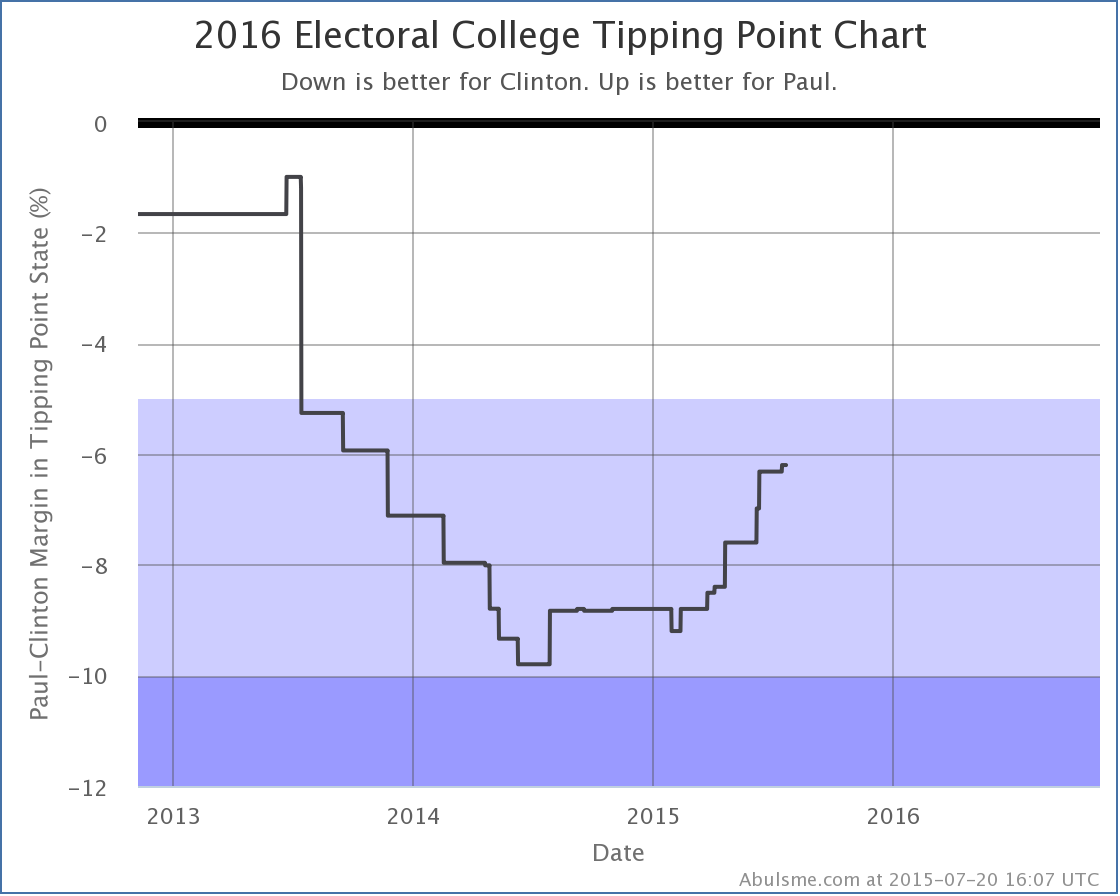
On this metric Paul has had nothing but moves in his direction since February. Slowly but surely his situation has been improving. It of course still has a long way to go. But the trend is there.
Everybody Else
So, we do have to ask the usual question. Is this really Paul getting stronger? Or is this just Clinton getting weaker? So lets look at the comparisons with all of the five best polled candidate combinations.
First Virginia:
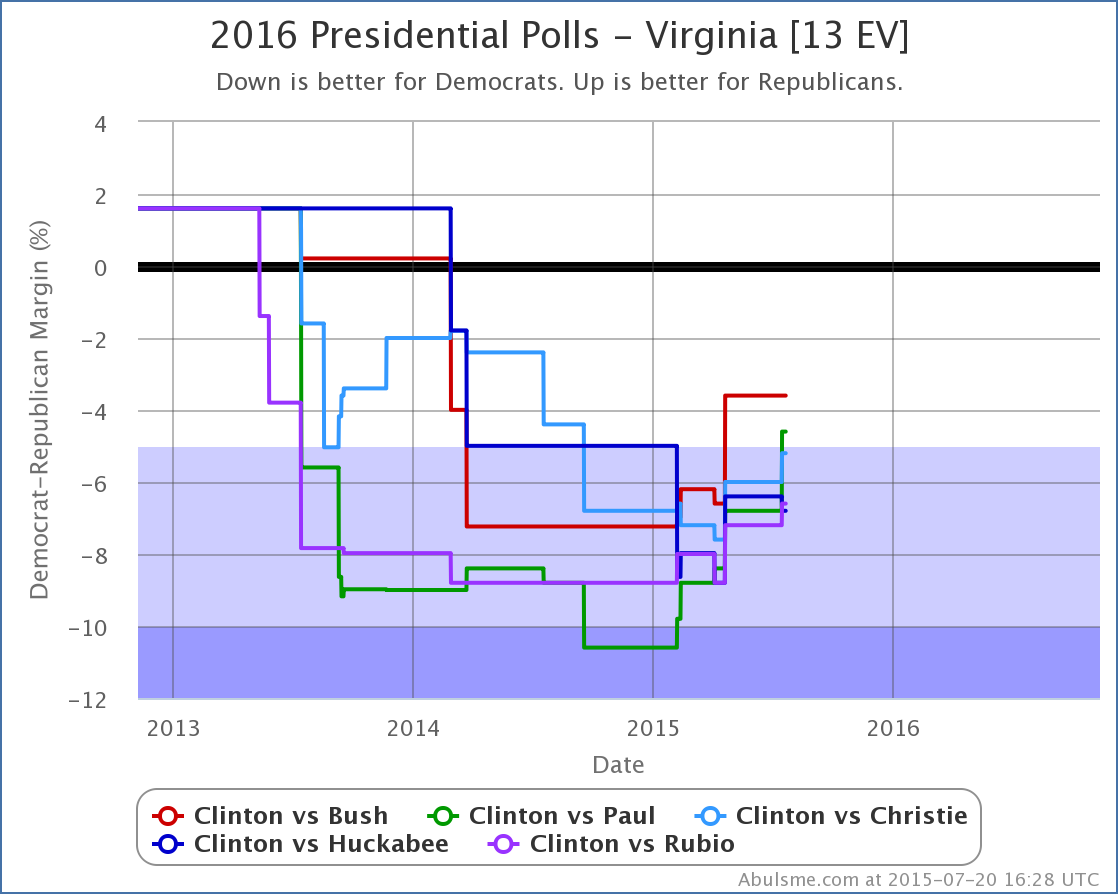
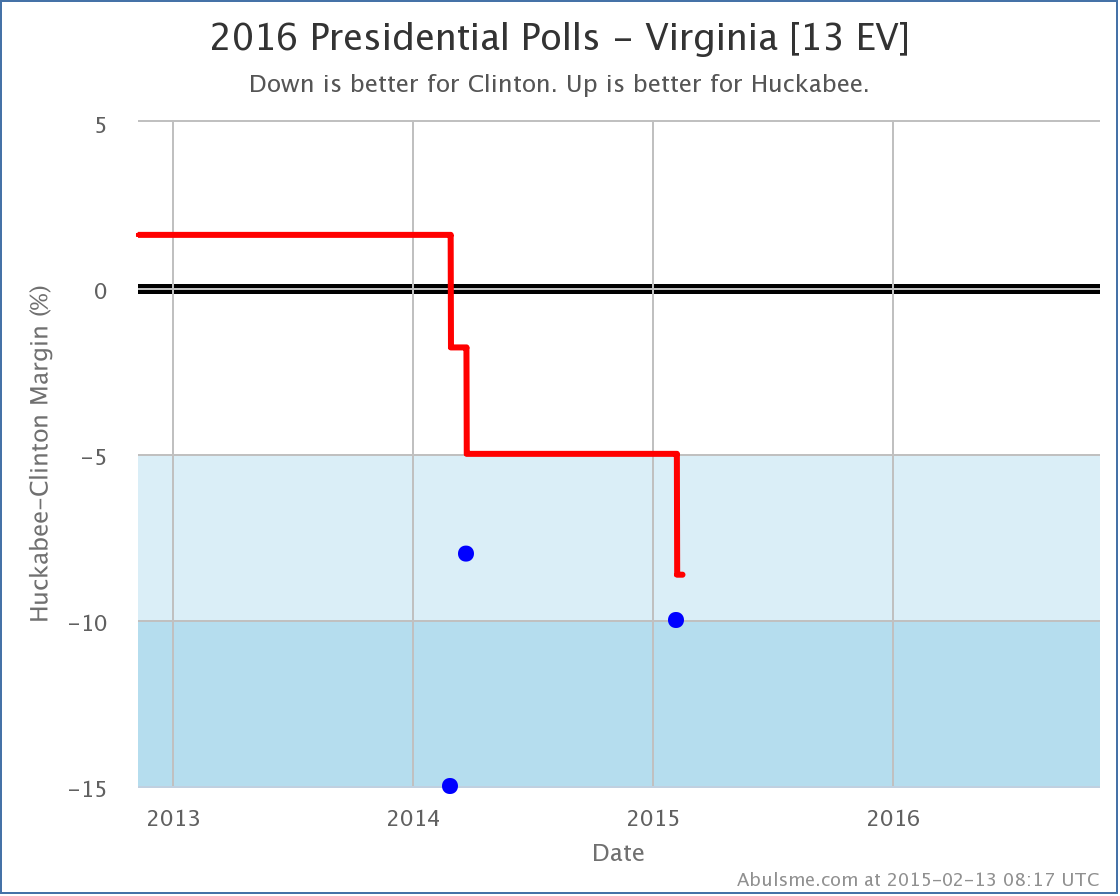
Looking back six months… Bush, Paul, Christie and Rubio have all improved vs Clinton. Only Huckabee has declined in that time frame.
Then the “best cases”:
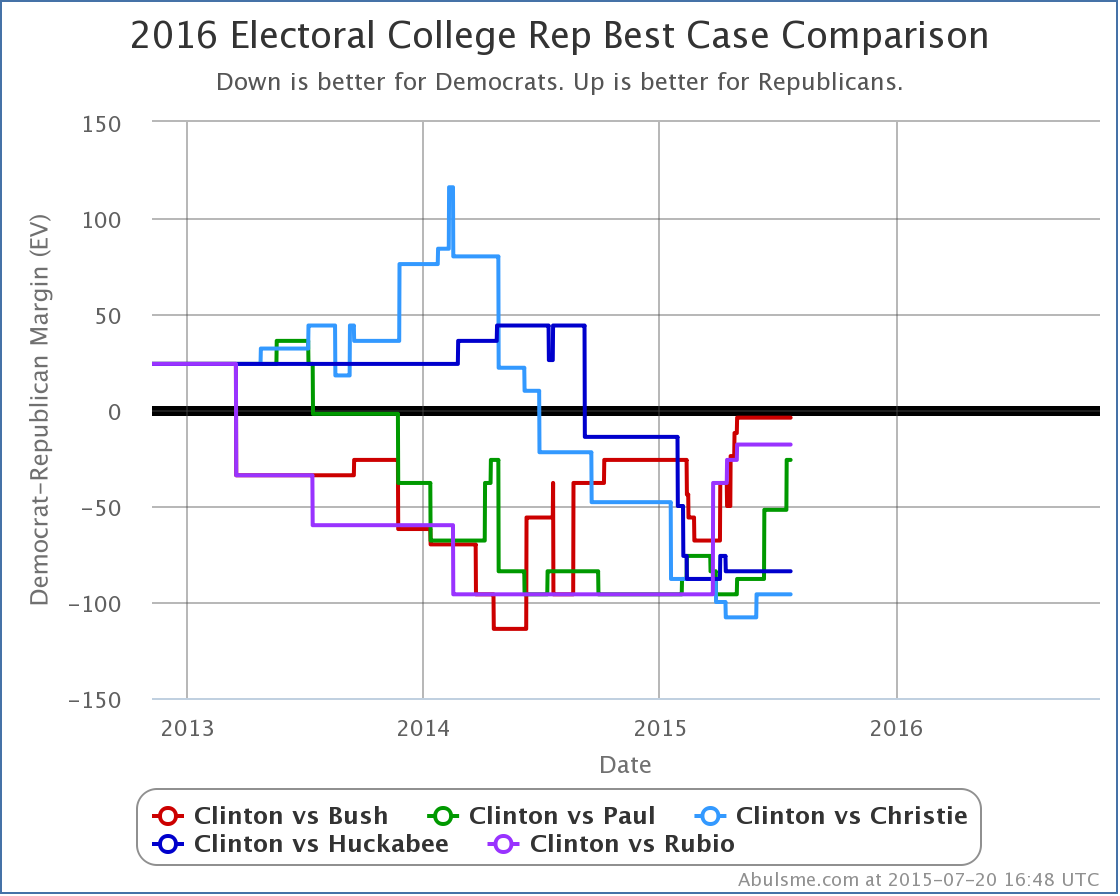
Again looking back six months, this time Bush, Paul and Rubio have all improved, while Christie and Huckabee have declined.
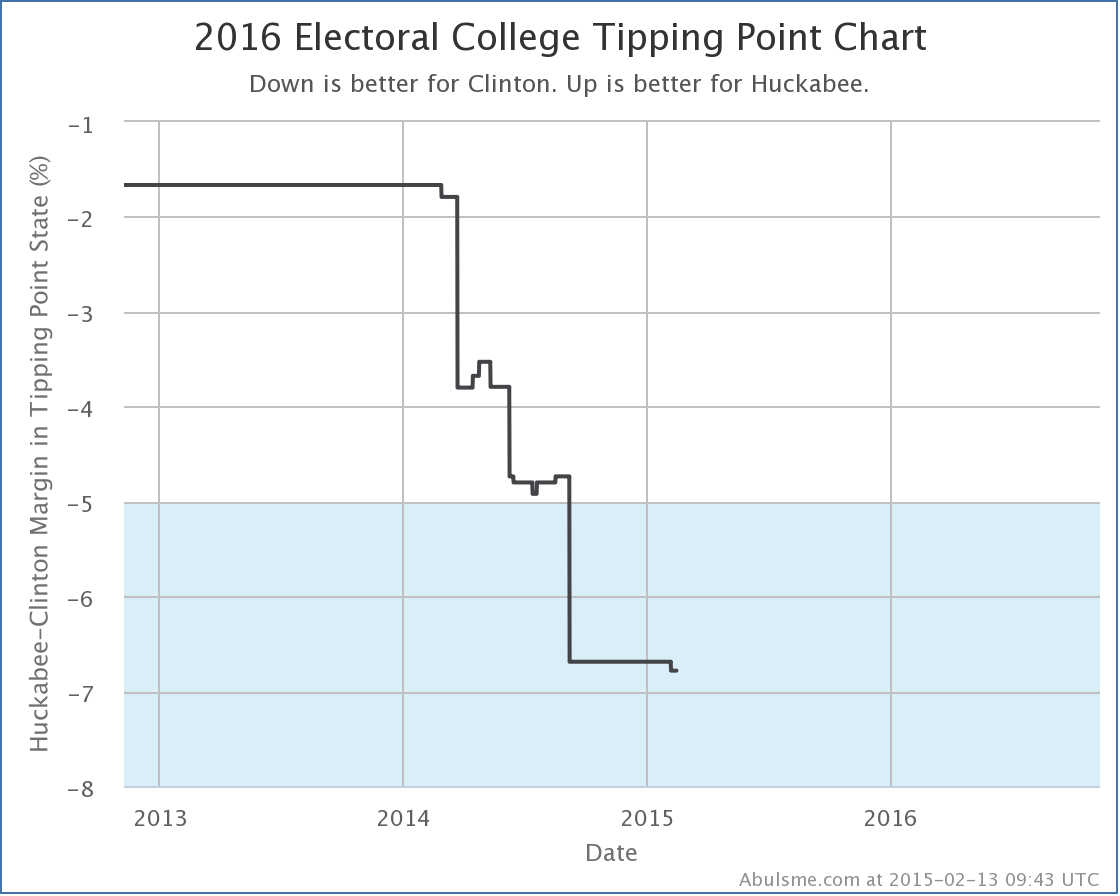
Finally, the tipping points:
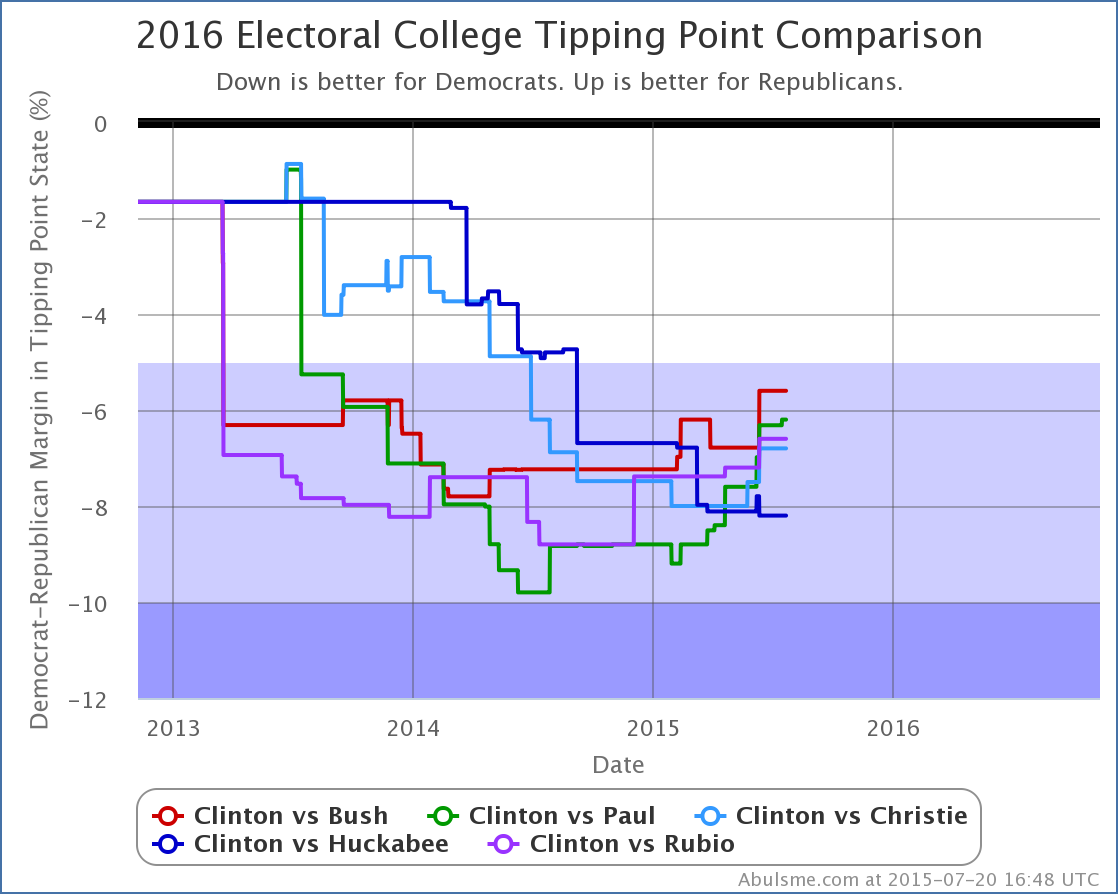
Once again, everybody is gaining on Clinton… except Huckabee. Poor Huckabee.
Anyway, together this means that Clinton seems to be weakening generally against most of the Republican candidates, this isn’t something special for Paul. Today’s update just happened to have him be the one to flip categories today.
Having said that though, if you look at the amount Paul has moved in the three graphs above vs the other four competitors, he’s had the biggest move in Virginia, the biggest move in tipping point, and the second largest move in “best case”. So perhaps there is actually something going on with Paul separate from the more general move against Clinton.
For any of that to matter though, he would still have to win the nomination, which is a long shot. But still…
477.3 days until polls start closing.
Note: This post is an update based on the data on my 2016 Electoral College Analysis Site. All of the charts and graphs seen here are from that site. Graphs, charts and raw data can be found there for the race nationally and in each state for every candidate combination that has been polled at the state level. In addition, comparisons of the best polled candidate combinations both nationally and each in each state are available. All charts above are clickable to go to the current version of the detail page the chart is from, which may contain more up to date information than the snapshots on this page, which were current as of the time of this post. Follow @ElecCollPolls on Twitter for specific poll details as I add them.
I added a bunch of new polls today, catching up after being preoccupied with something else the last few days.
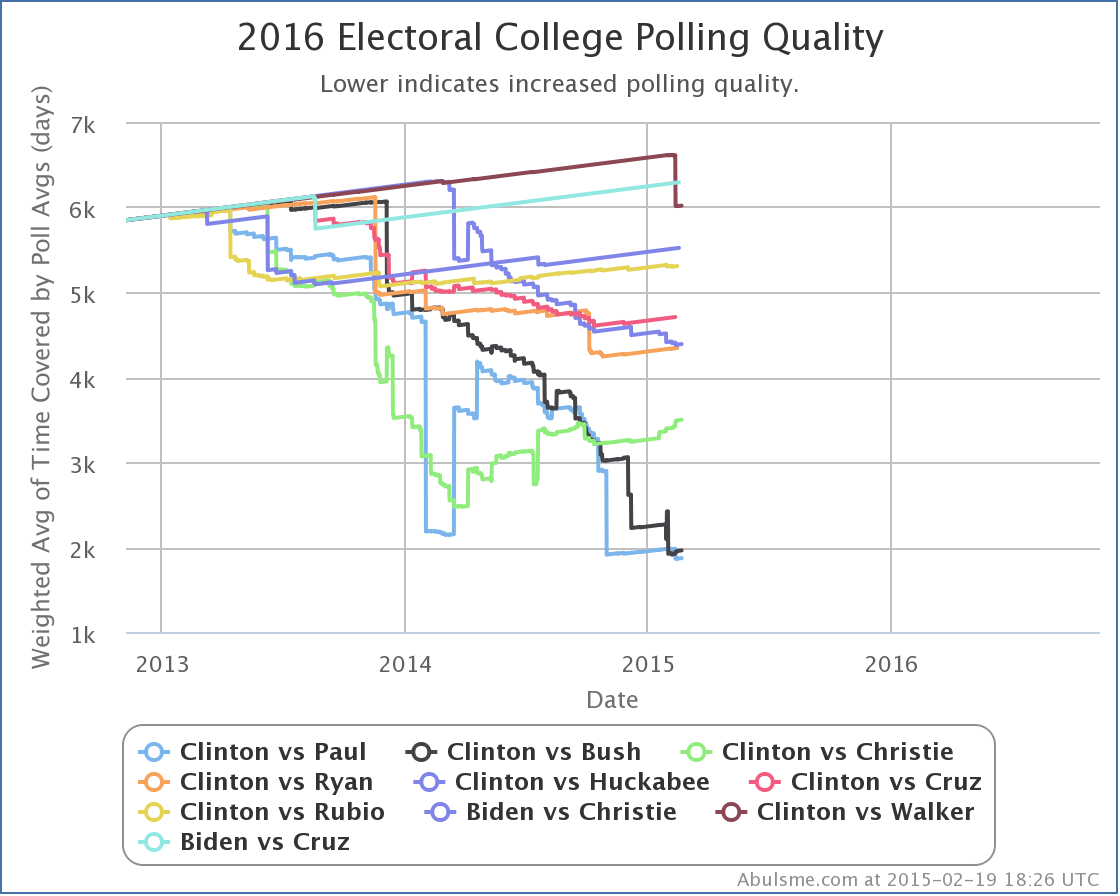
The first thing to note is a change to the “top five best polled” candidate pairs. With the latest batch of polling, a well polled state (North Carolina) that had been really close in Clinton vs Walker became less close, and thus this combination slipped out of the top five, replaced by Clinton vs Ryan again. I expect this won’t last long, with one of Clinton vs Rubio, Clinton vs Cruz, or Clinton vs Walker once again jumping onto the top five very soon.
Within the top five candidate combinations, there were two changes of note this time:
Clinton vs Paul
The latest polling in Virginia from CNU improves Paul’s situation in Virginia from losing by 8.4% to only losing by 6.8%. This does not change Virginia’s categorization as a “Strong Clinton” state, but since Virginia was the tipping point state, it moves that metric:
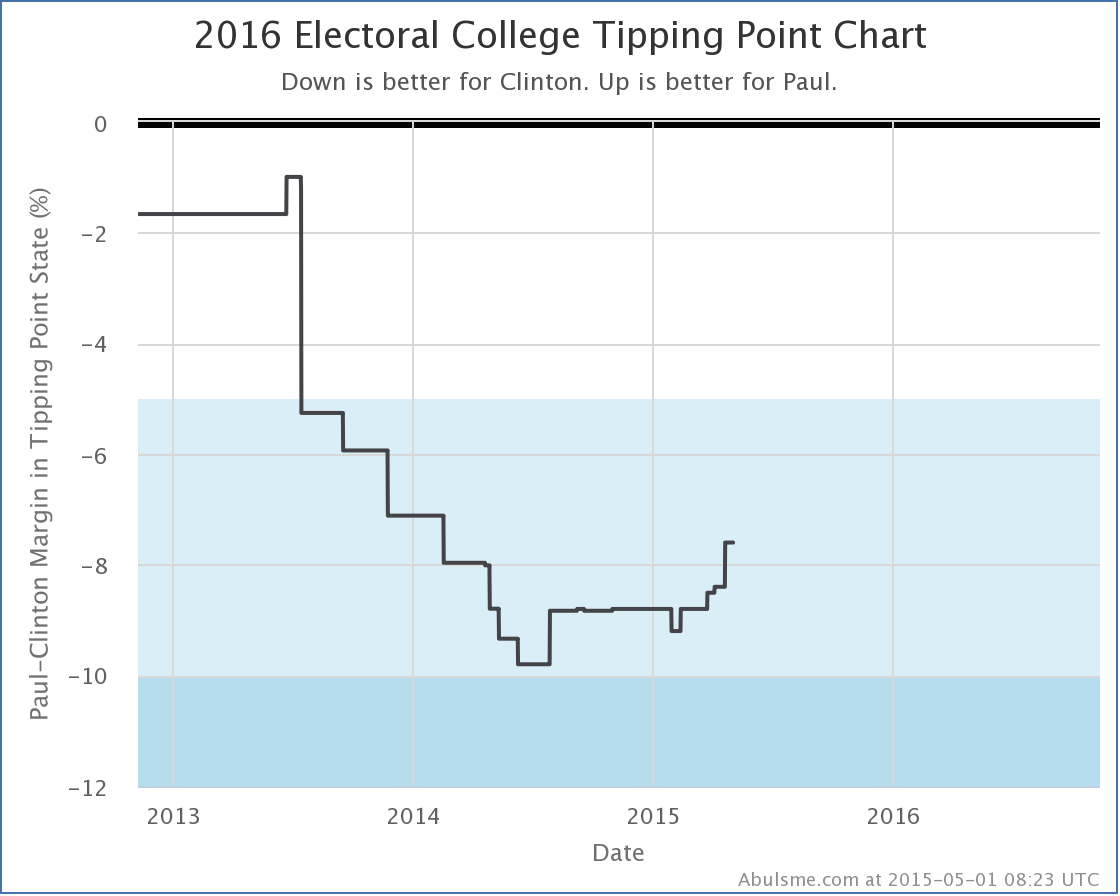
With this the tipping point moves from Clinton leading in Virginia by 8.4% to Clinton leading by 7.6% in Ohio. This is a nice bump toward Paul. We’re still in “Strong Clinton” territory by this metric of course, but this continues a general trend of Paul’s tipping point against Clinton improving ever since last summer. Paul and Bush are the only two Republicans in the current five best polled combinations that can claim a positive trend against Clinton on this metric.
Clinton vs Bush
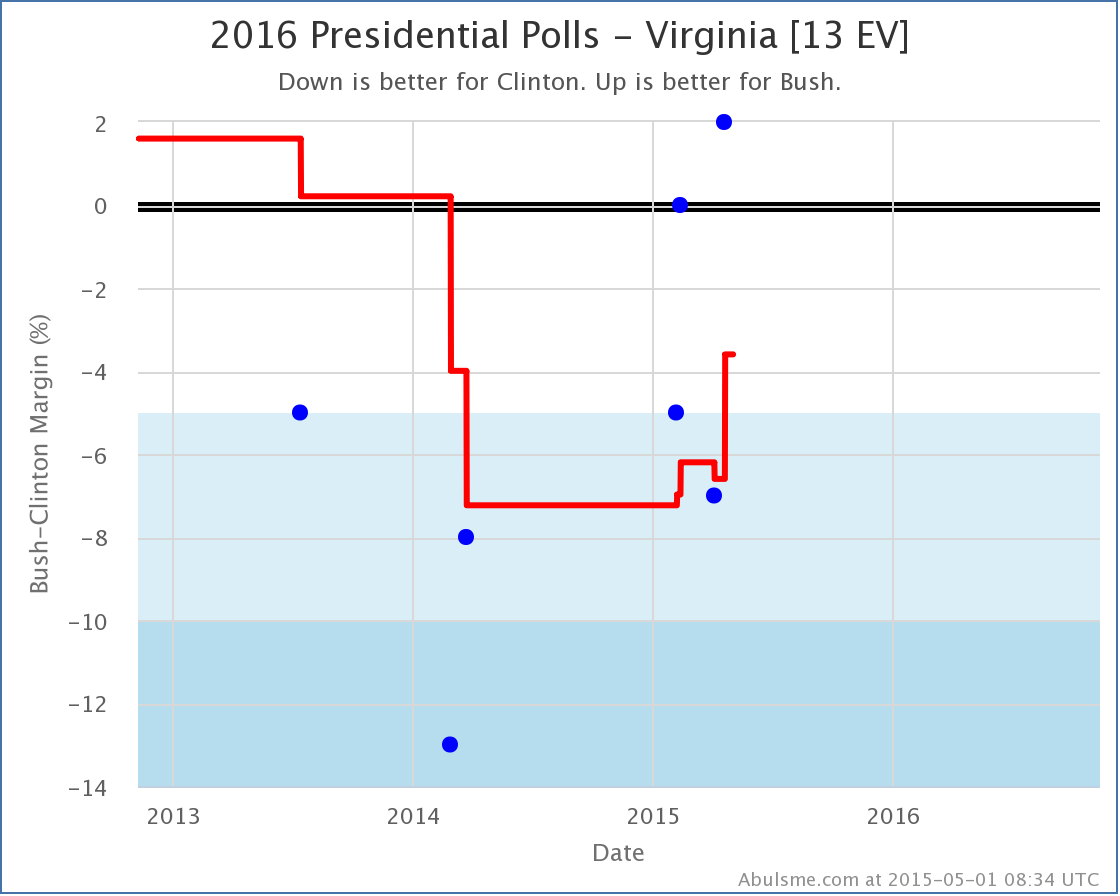
Once again it was the CNU Virginia poll making a difference. Clinton’s polling average lead vs Bush declines from 6.6% to 3.3% with this new poll. This moves Virginia from “Strong Clinton” to “Weak Clinton” and puts it back in play for Bush and improves his “best case” (which is where I give him not just the states he is ahead in, but all the states where Clinton is ahead by less than 5%):
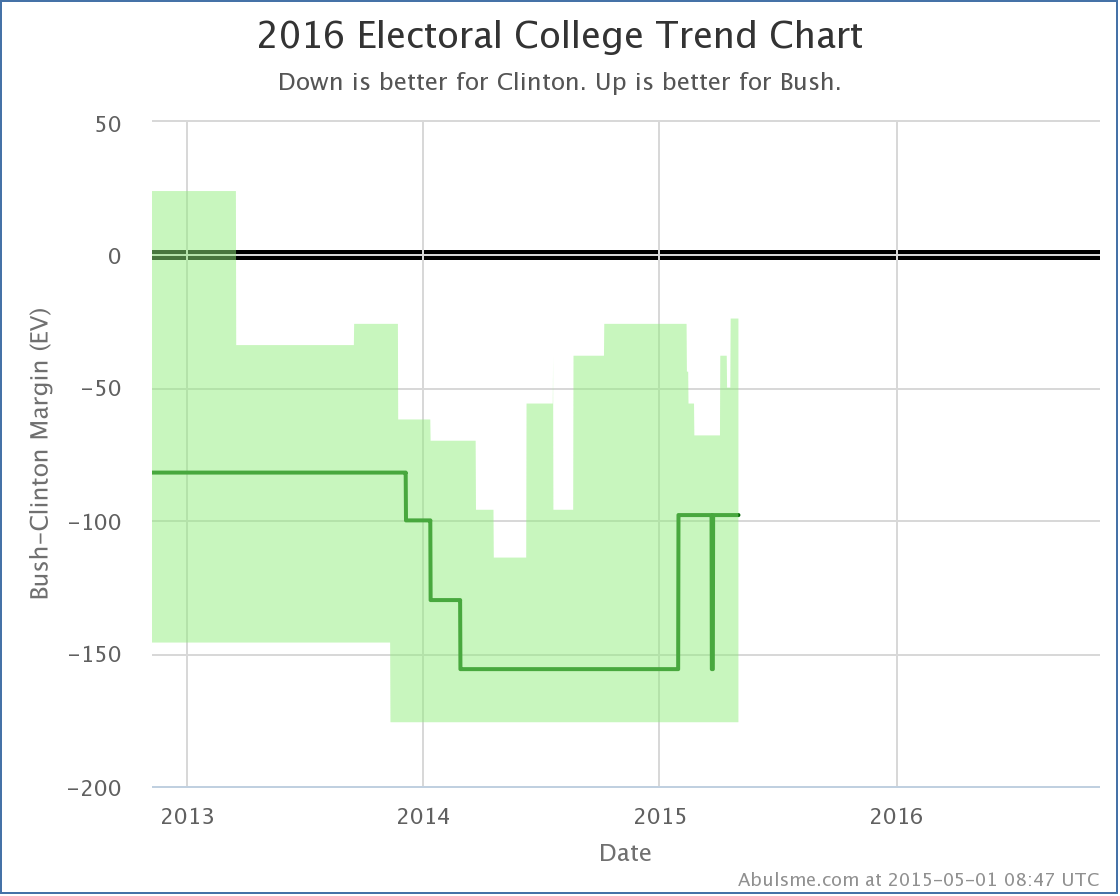
This brings Bush’s best case to losing to Clinton by only 24 electoral votes. This is the best best case Bush has had since there was any real significant polling on 2016. Bush is currently doing better against than the other four Republicans in the five best polled combos in every metric I’m tracking. If he can make at least another 12 electoral votes close… say perhaps Iowa (6 EV) and Minnesota (10 EV)… the two “Strong Clinton” states that are the weakest for Clinton at the moment… then for the first time since early 2013 (when polling data was still sparse and we were mainly relying on previous elections) we’ll have a real race, where the Republican is actually in contention.
Others
Normally I wouldn’t mention combinations not in the top five, but since Clinton vs Walker just fell off with this update, I’ll briefly note that the news was mixed for him in today’s batch of polls. On the one hand, he improved in Virginia, which improved his tipping point. On the other hand, North Carolina flipped from Weak Walker to Weak Clinton, increasing the amount he would be expected to lose to Clinton by if each of them won all the states they were ahead in.
Note: This post is an update based on the data on my 2016 Electoral College Analysis Site. All of the charts and graphs seen here are from that site. Graphs, charts and raw data can be found there for the race nationally and in each state for every candidate combination that has been polled at the state level. In addition, comparisons of the best polled candidate combinations both nationally and each in each state are available. All charts above are clickable to go to the current version of the detail page the chart is from, which may contain more up to date information than the snapshots on this page, which were current as of the time of this post.
Today’s big poll dump was from Quinnipiac, in the latest of their “Swing State Poll” series. This edition features polls from Colorado, Iowa and Virginia and is given the headline “Paul Blooms As Clinton Wilts“. That sounds pretty strong. But lets see how that headline holds up when we look at today’s updates in the context of poll averages rather than just results from one pollster, and looking beyond just the individual states with my method of classifying states.
Quinnipiac tested seven candidate combinations, but only four of those are in the “five best polled candidate combinations” by the measure I use here, so those are the ones I will talk about today. That would be Clinton vs Bush, Paul, Christie and Huckabee. (The fifth combo on the top five, Clinton vs Ryan, hasn’t been polled by anyone since February, but Cruz, Rubio and Walker, the next three by my metric, and also the others polled by Quinnipiac, still haven’t had enough polling to catch up and pass Ryan.)
So of those four, what were the actual changes in my models? There were changes for three candidate pairs. In all three cases the changes favored the Republican.
Clinton vs Bush
With today’s update, Clinton vs Bush once again becomes the “best polled” candidate combination by my metric, taking the spot from Bush vs Paul and thus becoming the default view on election2016.abulsme.com.
More importantly though, with today’s updates Clinton’s lead in the polling averages in both Colorado and Iowa dropped below 5%, putting those states back into play as “close states” that we consider possible for Bush to win. With these two back in play, Bush’s best case improves from Clinton 303 to Bush 235 before the update, to Clinton 288 to Bush 250 now, a loss by only 38 electoral votes. You can see the uptick in the top right part of the “bubble” representing the reasonable range of outcomes for Bush against Clinton given current polling:
Clinton vs Paul
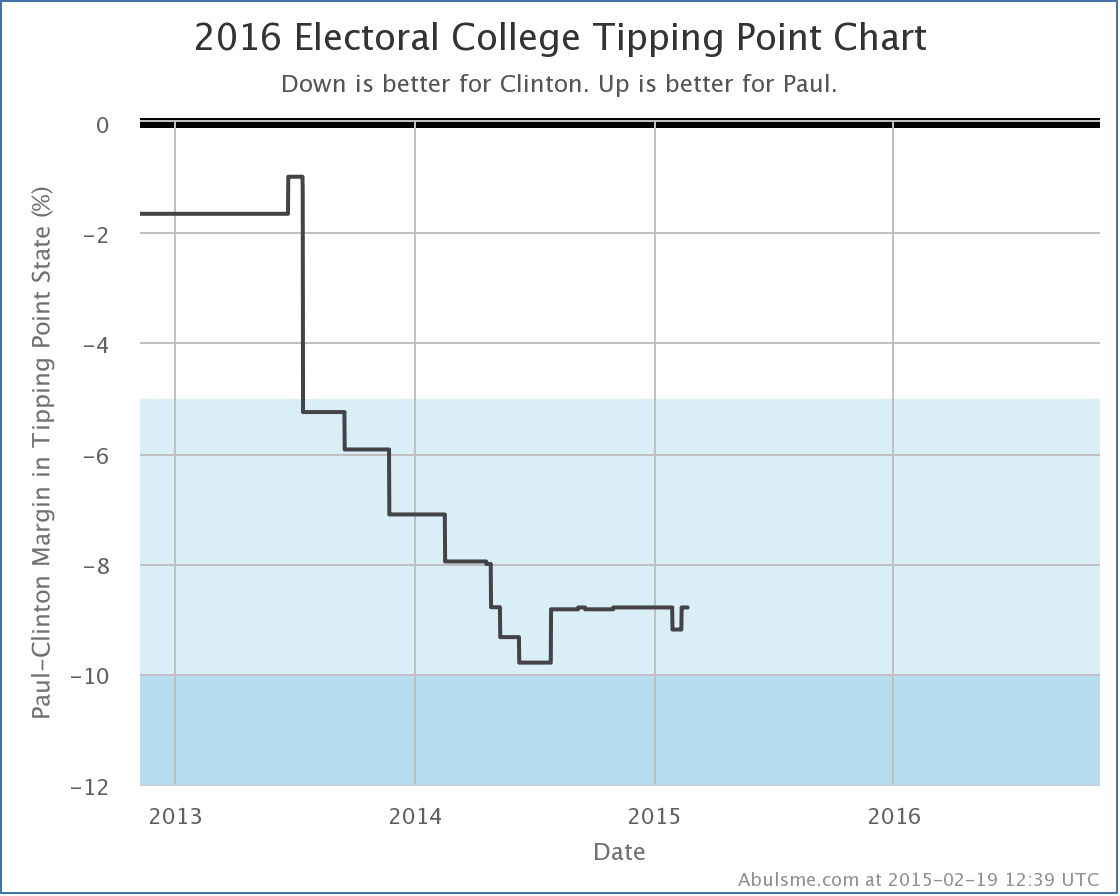
No states changed categories for Paul, despite the headline about Paul “blooming”. His average in Virginia however did improve from losing by 8.8% to only losing by 8.4%. This in turn moved his “tipping point margin”, a measure of how much polls need to move nationally to flip the electoral college, from being behind by 8.5% (with Wisconsin being the tipping point state) to being behind by 8.4% (with Virginia as the new tipping point state). This is the third tipping point change in a row in Paul’s direction. Almost starting to look like a trend.
Clinton vs Huckabee
With the new results from Quinnipiac, Clinton’s lead against Huckabee in Iowa falls from 6.6% to 4.6%. That’s a rather big drop, and it makes Iowa once again a “possible” for Huckabee. So his best case moves from losing by 88 electoral votes, to only losing by 76 electoral vote. You can see this at the top right of his “bubble”:
State Comparisons
Now, while Clinton does weaken in each of the three cases above, none of this really seems to justify the “Paul Blooms as Clinton Wilts” headline on the national level. But of course these polls weren’t at the national level. The headline was really specifically about the three states polled. So lets look at how each of the candidate pairs in question are doing in these three states specifically. In each one, just look at the very last change in the lines to see how this new poll result affected the averages. (All the charts in this section also include Clinton vs Ryan, but that line can be safely ignored, since Ryan wasn’t included in these polls.)
So, in order of the number of electoral votes:
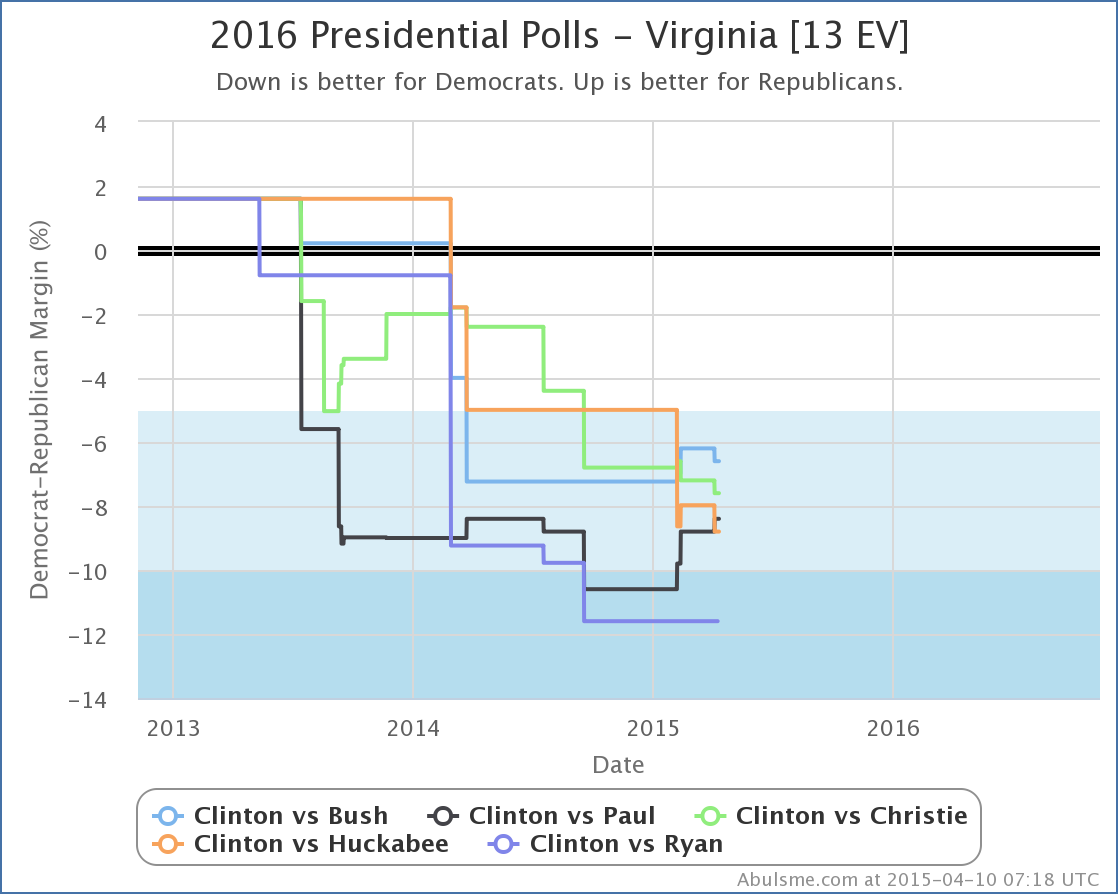
Bush, Christie and Huckabee actually fell further behind in Virginia as a result of this new polling. Paul was the only one of the four who actually improved in Virginia, reducing his deficit from 8.8% to 8.4% in my average. None of the four candidates made a move that changed the category though. Virginia is “Strong Clinton” against all four of these candidates, and this polling didn’t change that. Paul does stand out here though, by being the only one improving against Clinton.
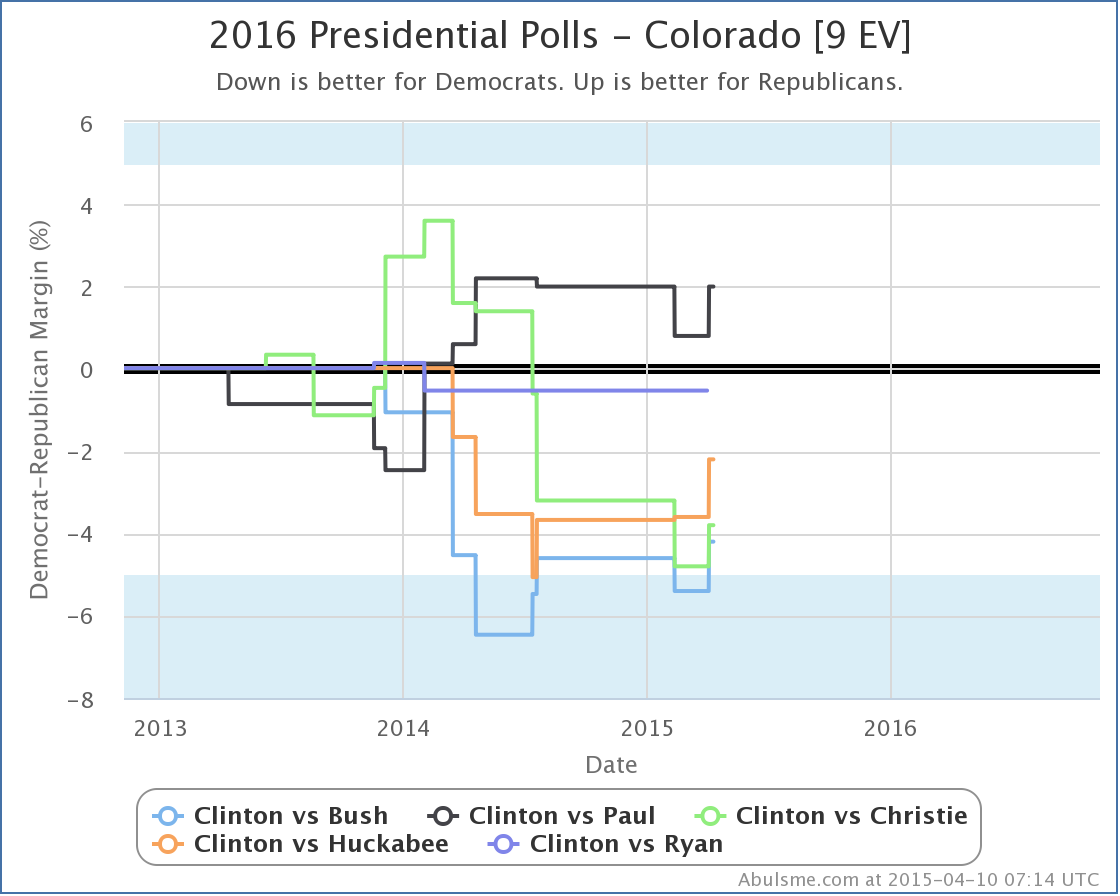
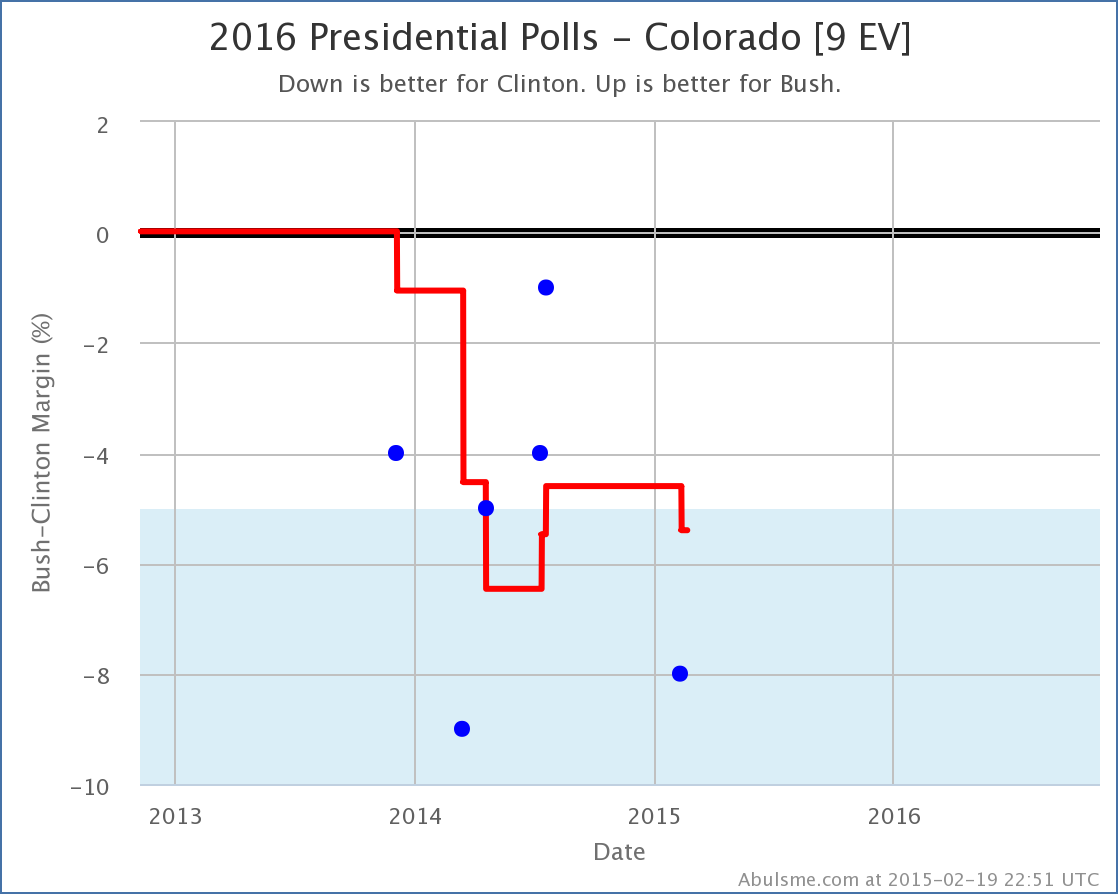
In Colorado all four of the candidates improve against Clinton as a result of the Quinnipiac poll. Bush actually moves into the white zone here, which as was mentioned earlier, means that the state is now a possible win for him. But this actually just brings Bush back in line with the rest of the pack. Colorado is a close state for all of these candidates.
Paul stands out in Colorado too, but not for the recent movement, but because he is the only one of these candidates who is showing that he could turn Colorado red again. (Colorado went blue for Obama in both 2012 and 2008, but was red in 2004, 2000 and 1996.) This is not new though. Paul has been consistently leading in the Colorado poll average against Clinton for over a year.
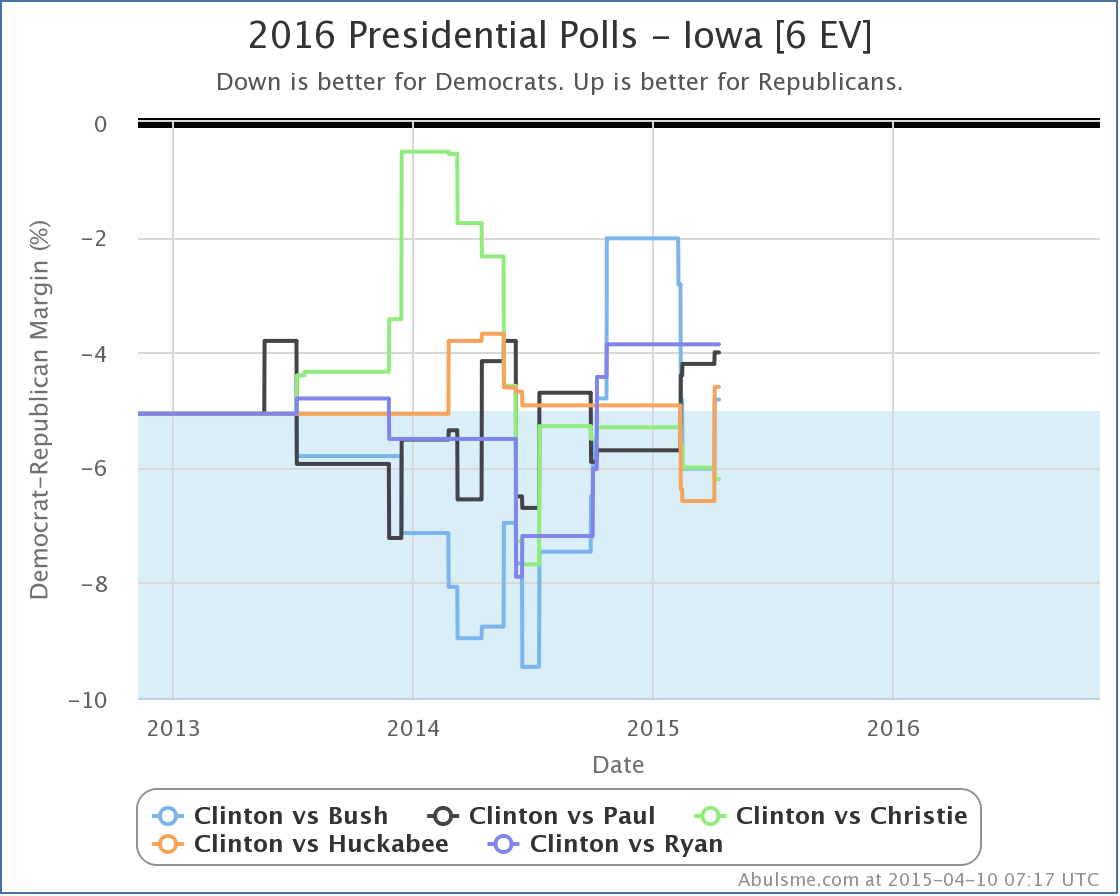
Bush, Paul and Huckabee all improved in Iowa, with Bush and Huckabee of course moving Iowa back into competitive territory, where Paul already was. Christie fell a bit further behind.
With all of the above, the moves were definitely not friendly to Clinton on the whole, but “wilting” looks like hyperbole. And while Paul does well here, so do Bush and Huckabee, arguably with moves just as significant as Paul’s if not more so.
So where does Quinnipiac get their headline?
Well, duh, they are only looking at their own polls. They are comparing their most recent results in these three states with the results of the last time they polled these three states back in February. I’m sure if you look at things with only that lens, it looks like exactly what they say it does. But you are ignoring a lot of data if you do that.
For instance, looking at only Quinnipiac data in Iowa, you see a move from Clinton having an 8.0% lead in February, to Paul being ahead by 1% now. Huge move, right? Massive momentum away from Clinton and toward Paul, right?
Lets look at the chart showing all the Clinton vs Paul polls in Iowa, not just Quinnipiac:
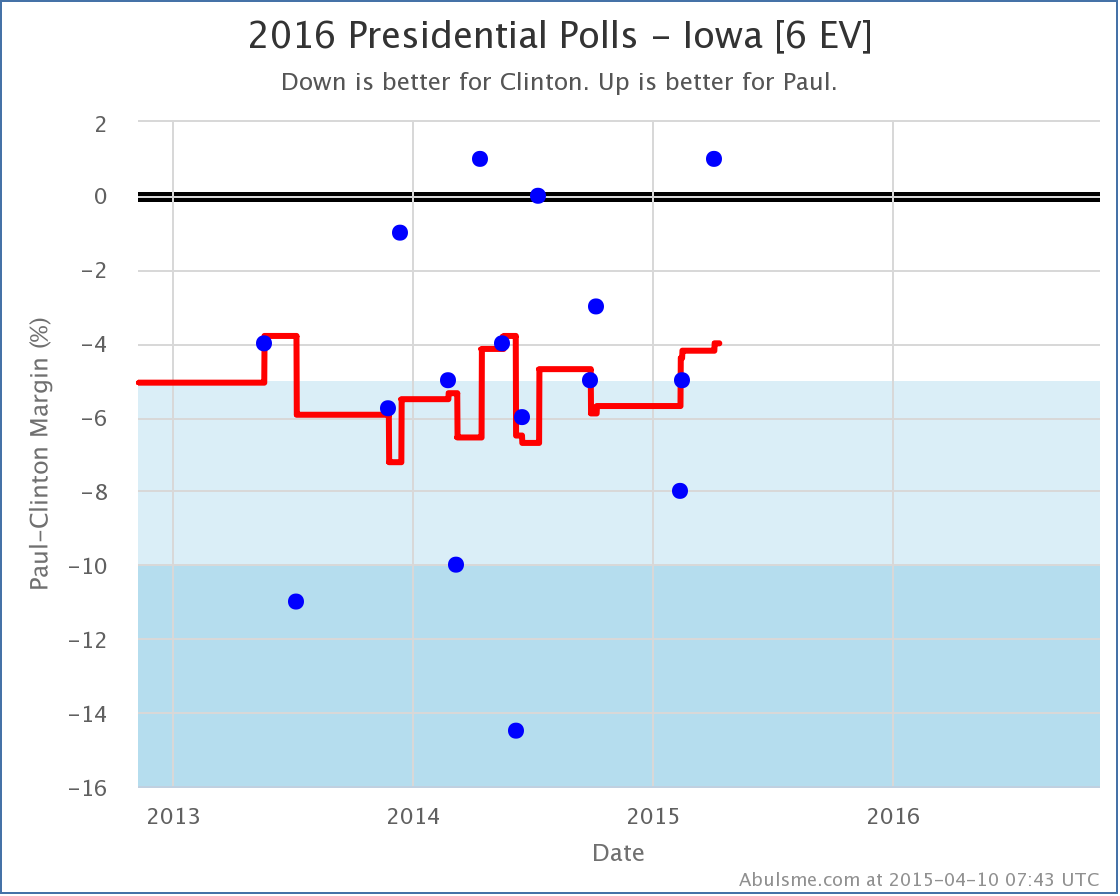
Hmmm… where did the trend go? Now, there have only been three polls so far in 2015, and it is true that each one has been better for Paul than the one before. But looking at the history of polling Clinton vs Paul in Iowa since the 2012 election, you see that the results are all over the place. There is huge scatter here. The results bounce all over the place. And so far, there has not been any sort of clear trend at all.
Yes, the new Quinnipiac poll looks great for Paul. He’s beating Clinton in Iowa! But there was a poll about a year ago that said that too. It wasn’t backed up by other polls though and wasn’t the sign of a big trend toward Paul. It was just more random variation. It wasn’t real.
Could this new poll be the first signs of a real long term movement? Maybe. Maybe not.
Kids, this is why we look at poll averages instead of individual polls.
If there is an actual big movement toward Paul, or any of the other Republican candidates, we’ll know soon enough as more and more polls start showing that movement. But no such clear trend is visible yet for any of the candidates with the most polling.
(I mentioned at the top that right now Clinton vs Cruz is the 6th best polled combo, Clinton vs Rubio is at #7, and Clinton vs Walker is at #8. You can click through on those links if you want to see what those look like at the moment. The amount of state level polling still isn’t great on those guys, so interpret the charts carefully.)
Note: This post is an update based on the data on my 2016 Electoral College Analysis Site. All of the charts and graphs seen here are from that site. Graphs, charts and raw data can be found there for the race nationally and in each state for every candidate combination that has been polled at the state level. In addition, comparisons of the best polled candidate combinations both nationally and each in each state are available. All charts above are clickable to go to the current version of the detail page the chart is from, which may contain more up to date information than the snapshots on this page, which were current as of the time of this post.
Another day and yet more polls moving things around. So lets go…
As usual click on any of the charts for more detail.
Clinton vs Paul
First of all, the latest batch of polls has Clinton vs Paul once again the “best polled” candidate combination, pushing Clinton vs Bush out of that spot. Keep in mind this does NOT mean they are the frontrunners in their respective parties, just that there have been more polls in the closest states than there have been for other candidate pairs. This means the default view on election2016.abulsme.com is now Clinton vs Paul. But the gap between them on my polling quality metric is very small, so don’t be surprised if they switch places again.
Next, a new poll in Virginia improved Paul’s standing slightly. No category change, Virginia is still a “Strong Clinton” state based on current polling against Paul. But the tipping point was moved:
The tipping point moves from Clinton by 9.2% in Ohio, to Clinton by 8.8% in Virginia. This represents how big a uniform move in the polls across ALL states would have to happen to give Paul the edge in the Electoral college. This is basically because at the moment, to win, Paul would have to flip North Carolina (0.2% Clinton lead), Nevada (2.8% Clinton lead), Iowa (4.2% Clinton lead), New Hampshire (4.9% Clinton lead), Minnesota (7.0% Clinton lead), Michigan (8.6% Clinton lead), and Virginia (8.8% Clinton lead). [This is the list of states that are closest that would need to be flipped, there are of course other combinations that would do the trick if Paul flipped states with even bigger Clinton leads.]
Since Virginia would be the state that would put Paul over the top, it is the tipping point state and the margin there is the amount everything would have to move to make this scenario happen.
Clinton vs Bush
This combination sees relevant changes in Colorado, Iowa and Virginia.
In Colorado, Clinton’s lead grows to over 5%, so this state moves out of contention and into “Strong Clinton”. (For now anyway, but do I really need to repeat just how early things are, and how relatively sparse polling still is too?)
Same thing in Iowa. Although in Iowa, it looks like we might have a situation where the polling is returning to “normal” after a couple of outlier polls, while you could argue that in Colorado, the “true” state might just be bouncing around the 5% boundary line.
In either case, we shouldn’t be too surprised if the states get closer again.
With both of these states moving out of the “Weak Clinton” category, Bush’s overall best case against Clinton deteriorates a bit:
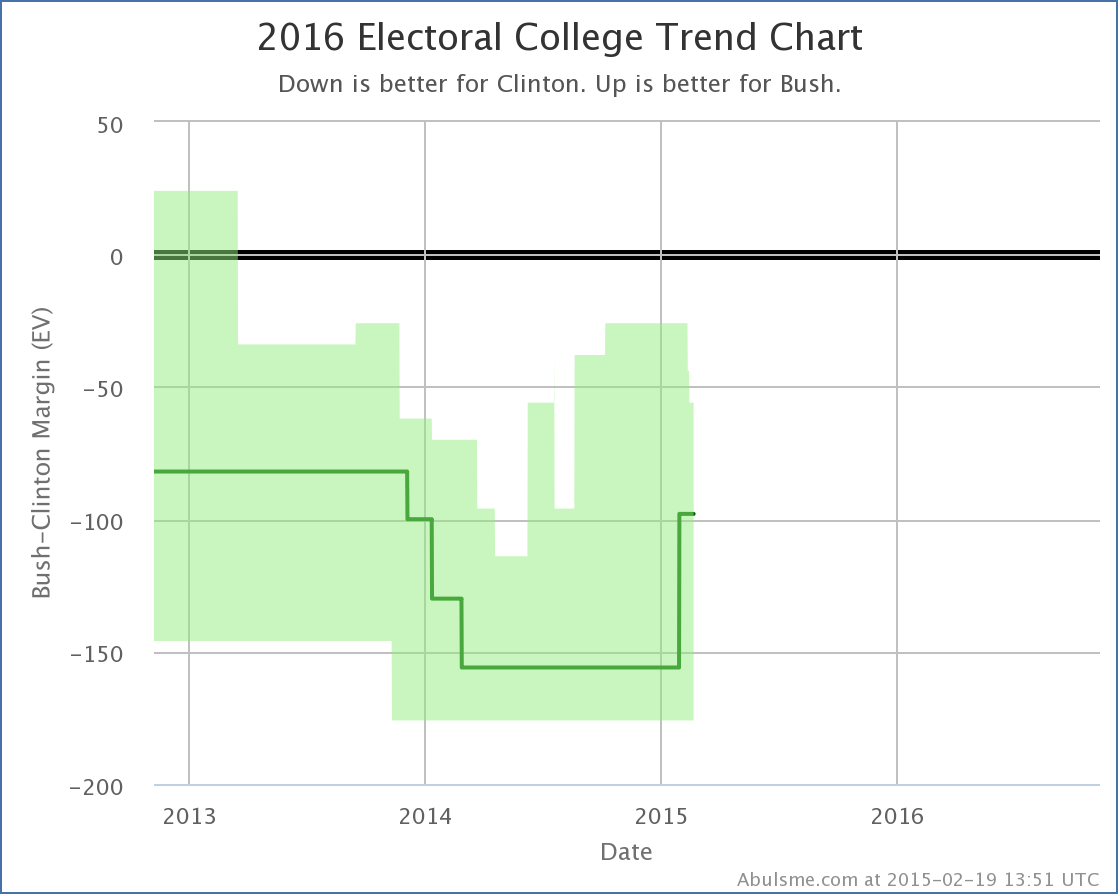
With this (plus another Iowa poll that was added yesterday) Bush’s best case against Clinton moves from losing by 26 electoral votes to losing by 56 electoral votes.
But while things haven’t been moving his way in Colorado or Iowa, in Virginia the latest polls have actually been moving toward Bush. No category changes… Virginia moved from a 7.0% Clinton lead to a 6.2% Clinton lead. This was enough to move the tipping point in Bush’s direction:
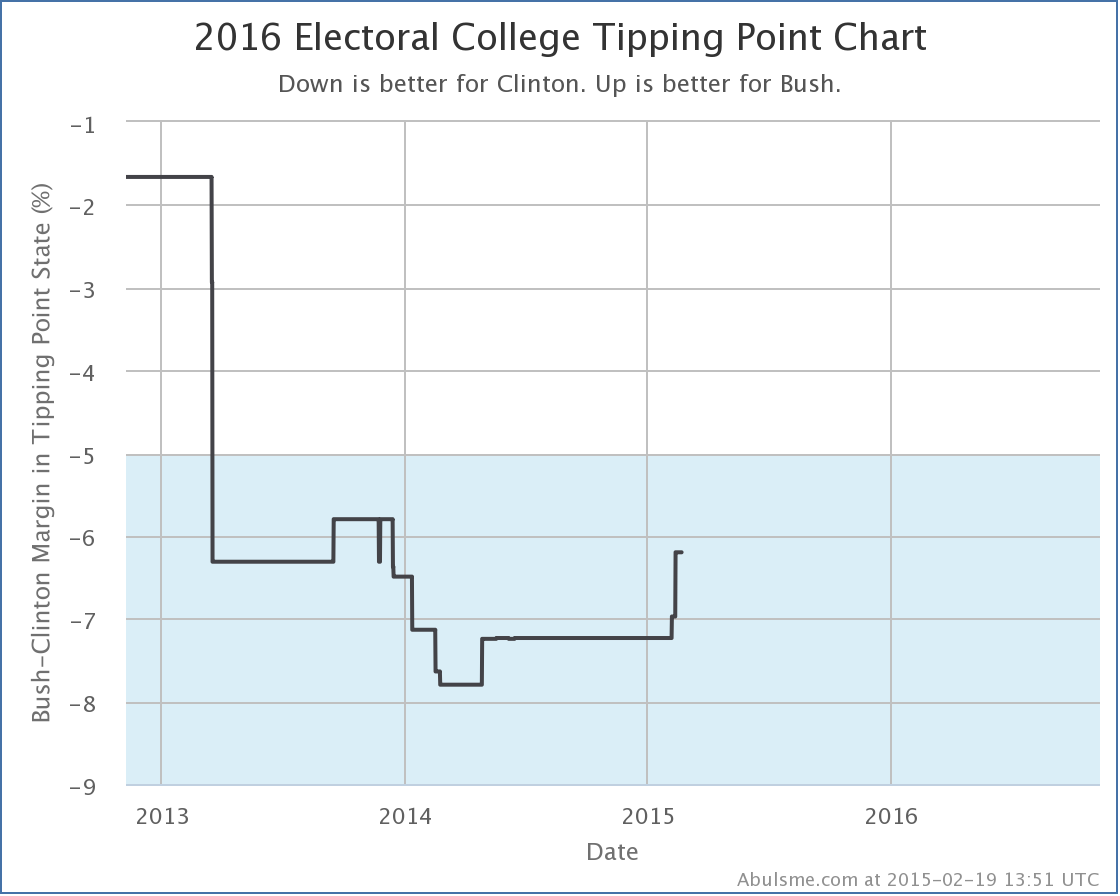
Virginia was the tipping point before this move, and it didn’t leapfrog any other states, so the tipping point stays in Virginia as it moves.
So Bush’s best case is getting worse, but his overall position is getting better? Yes, basically.
With current polling Iowa and Colorado now look like they aren’t competitive. So that is worse for Bush. But in order to win, Bush would have to flip a LOT of states, and the one he needs that he is furthest behind in is Virginia… but he is now not quite as far behind there. So if he is going to move all the states he needs to in order to win, he’s actually got a little bit less to move overall, even though Iowa and Colorado just moved a little further away.
Other folks
Just yesterday I was noting that Clinton vs Walker, despite being talked about quite a lot was still #18 on the ranking of best polled candidate combinations. With todays polls, he burst into the Top 10, debuting at #9, pushing Biden vs Rubio out of the Top 10. Still a bit away from the Top 5 combinations that I highlight here as having enough polling to say something useful about the race, but getting closer. If he continues to get lots of polling attention, while Clinton vs Ryan and Clinton vs Cruz and such do not, then he may get there sooner rather than later.
We are 634.6 days from the first polls closing as I write this message. But yet here I am with the fourth of these updates in a two week period. I honestly didn’t expect the polling to be picking up quite this fast. But it seems to be. So be it.
Please keep in mind that everything here describes where things are now, and how things are trending NOW. We are far enough from the 2016 election that nothing here represents a prediction for what will happen in 2016. But knowing how things look now and observing the trends still provides interesting insight.
Today I added new polls from CNU in Virgina and from Bloomberg / Saint Anselm / Purple in New Hampshire. These resulted in changes worth noting* for three candidate pairs. I’ll review them quickly in order of the magnitude of the change.
Click on any of the charts to go to the election2016.abulsme.com site for more detail.
Clinton vs Huckabee
Huckabee had only been hanging on to the “Weak Clinton” category in Virginia by virtue of the fact that I pad my poll average with previous general election results if there are not yet five actual polls between the candidates in question. With the third poll directly pitting Clinton vs Huckabee in Virginia, Huckabee falls much further behind, and Virginia now seems to slip out of reach. Huckabee’s best case vs Clinton therefore gets worse.
Without Virginia in the mix, Huckabee’s “best case” (where he wins all the states he is ahead in, plus all of the states where Clinton is ahead by less than 5%) is now to lose to Clinton by 76 electoral votes.
This change also drops the “tipping point” (which represents how much of a uniform shift in polling across all states would be needed to flip the election) further in Clinton’s direction. The tipping point state for Clinton vs Huckabee is now Minnesota, where Clinton is ahead by 6.8%.
Clinton vs Paul
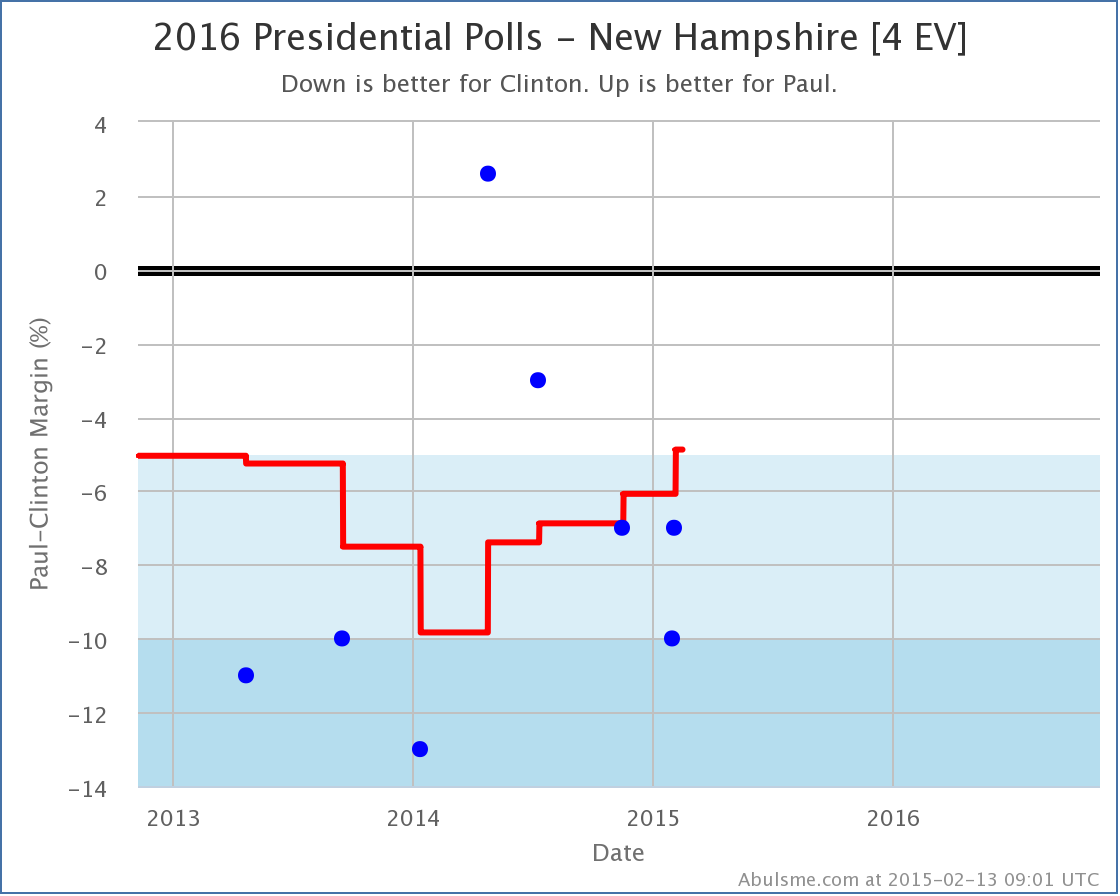
This chart of Clinton vs Paul polls in New Hampshire is interesting, and actually shows one of the disadvantages of using an average of the most recent polls, rather than some more sophisticated sort of trend smoothing. Paul’s average vs Clinton has been steadily improving for the last year. But if you look at the individual polls, you see that this is because some really bad polls for Paul from 2013 and early 2014 were “aging off” the average, being replaced by some relatively good polls for him from the last year, including one where he was actually ahead!
But if you actually look at the trend of the individual polls since then, the trend has been back toward Clinton. With a straight up poll average, this trend in the last five polls is invisible. We just know that the average of the newest five is higher than that of the five most recent polls not counting the brand new one. Basically, a poll where Paul was behind by 13% was replaced by a poll where Paul was only behind by 7%, so the average moved toward Paul… even though there may be a different trend if you look within the five polls actually used in the average.
If the trend in the last five polls is real (it may or may not be) then it would not be surprising to see New Hampshire fall back into “Strong Clinton” territory with the next poll.
For now though, we grant Paul the possibility of winning New Hampshire in his “best case” which is now to lose to Clinton by only 88 electoral votes.
Clinton vs Bush
No changes in best, worst or expected case for Bush against Clinton, but since the tipping point in this case was Virginia, and we had polling in Virginia, it is not unsurprising that the tipping point here moved, if only a little.
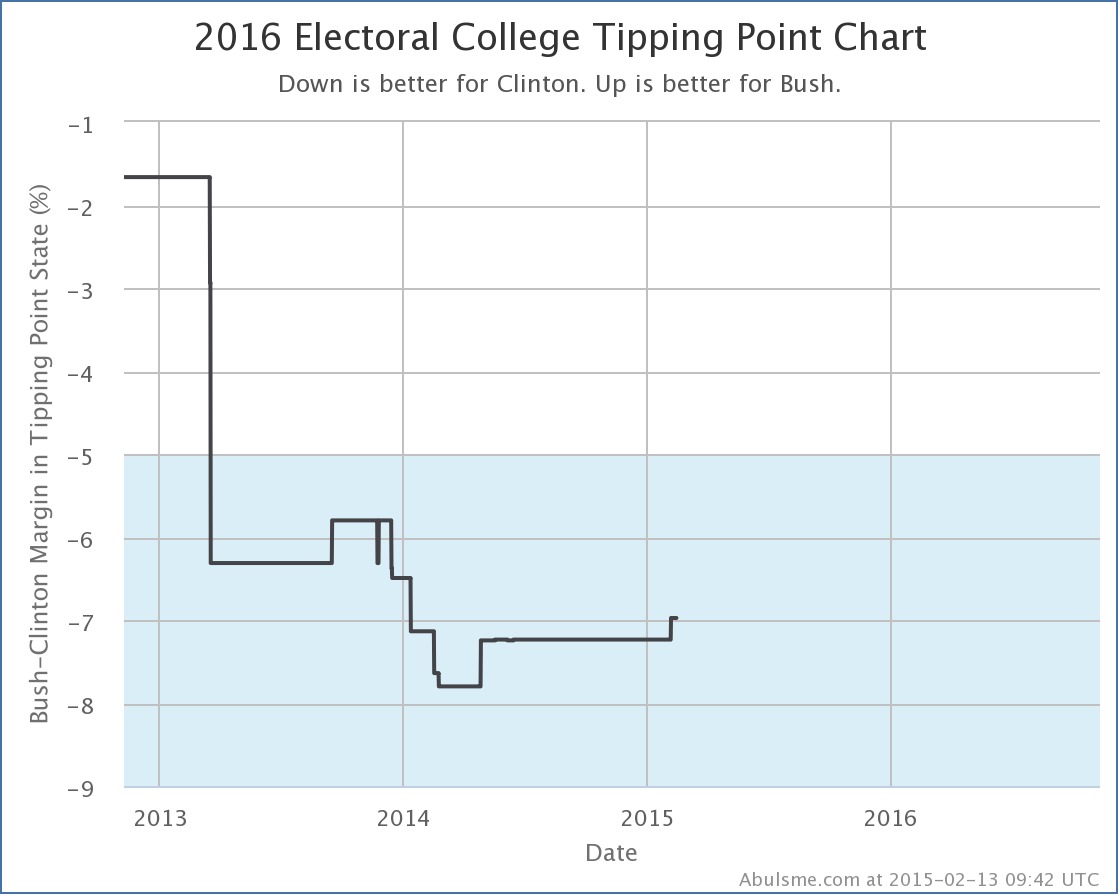
The tipping point here remains Virginia, but Bush moves from being behind 7.2% there, to only being behind by 7.0%.
And that is it for today’s update. Please explore election2016.abulsme.com to find more detail and interesting bits and pieces.
* For now, “Changes worth noting” are when the best, worst, or expected cases for one of the five best polled candidate pairs changes, when the tipping point changes by at least 0.1% for one of those candidate pairs, or if a new candidate pair becomes “best polled” or replaces one of the current five pairs on the list.
|
|