This is the website of Abulsme Noibatno Itramne (also known as Sam Minter).
Posts here are rare these days. For current stuff, follow me on Mastodon
|
Polls added since last update: Ohio, Pennsylvania, California, Arizona, Florida, Michigan, North Carolina, New Hampshire, Nevada, Wisconsin, Oregon, Vermont, Alaska, Colorado, Idaho, Iowa, Maine (All), Missouri, Oklahoma, Texas, Utah.
In addition to a number of actual new polls, I recently got a helpful batch of data from Darryl, another election modeler who posts at horsesass.org. His latest update is here. His analysis uses state polling averages, but then runs a Monte Carlo simulation to generate a distribution of possible outcomes and win odds, rather than simply the electoral result range based on the close states going one way or another like I do here. Good stuff, you should check it out.
In any case, Darryl sent me a batch of polls he had in his database that I had apparently missed. Most of these were older polls and though they jiggled the lines in the past a bit, did not change the current analysis. Except in one state: Colorado.
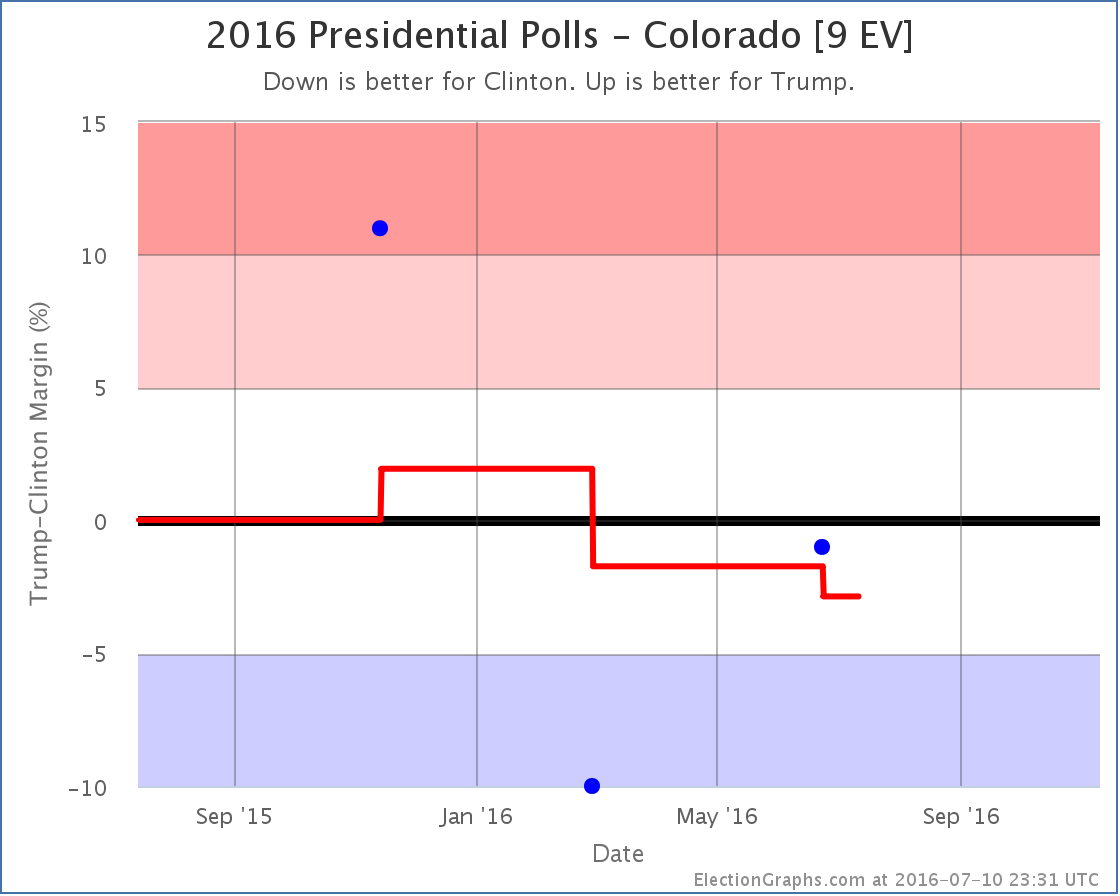
Colorado has been very lightly polled given how it is one of the states that has actually gone both ways in the last five elections. The poll Darryl had found which I had missed was a Keating poll back in February, that showed Clinton with a significant lead. With only three Clinton vs Trump polls total so far, and old elections filling out the polling average, that one poll makes a difference.
With that poll now in place, the average moves from “Weak Trump” to “Weak Clinton”. In fact, since it was an older poll that was responsible for the change, Colorado has actually been “Weak Clinton” for months now, we just didn’t know it. This change is now reflected in all the graphs.
Everything on the center “expected result” line since late February moves down 18 as Colorado’s 9 electoral votes flip from red to blue. Colorado still looks close though. Clinton’s lead is only 2.9% and the three polls we do have range from Clinton up 10%, to Trump up 11%. We still don’t have a really great picture of Colorado. More polls are needed there.
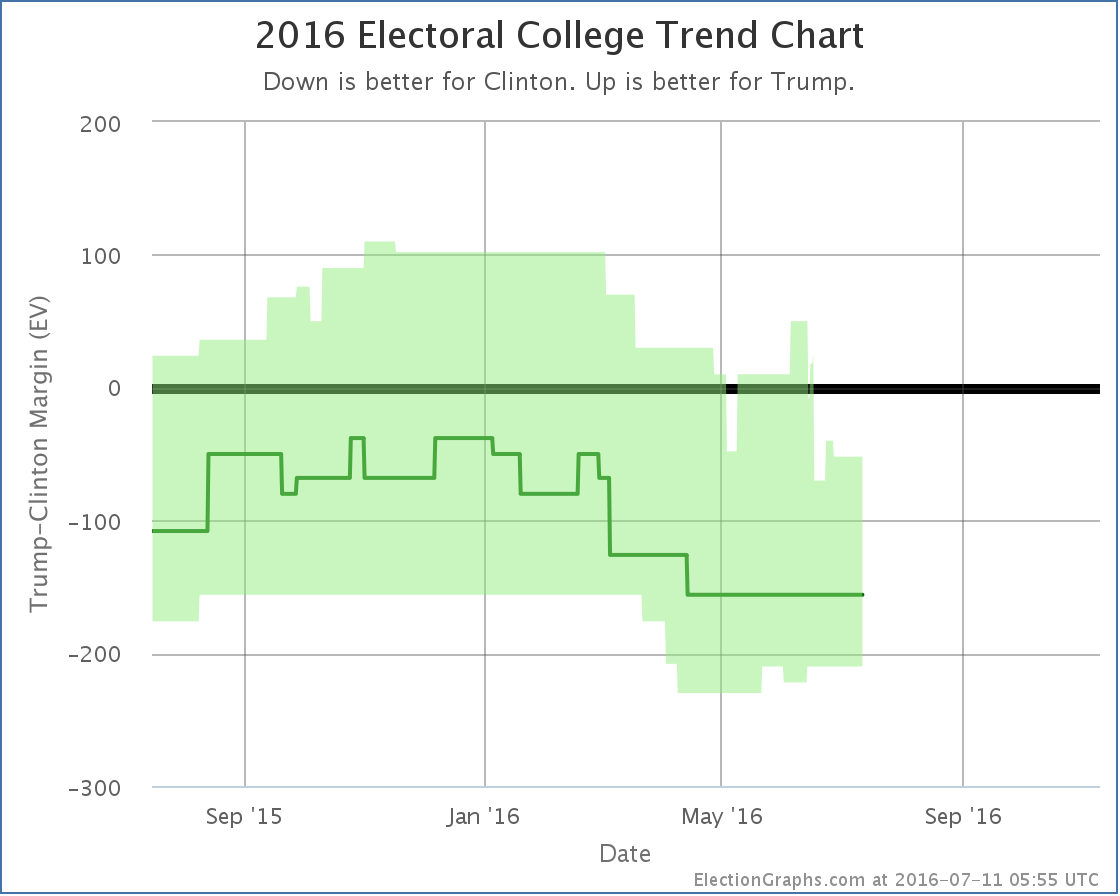
In the mean time, the new national summary looks like this:
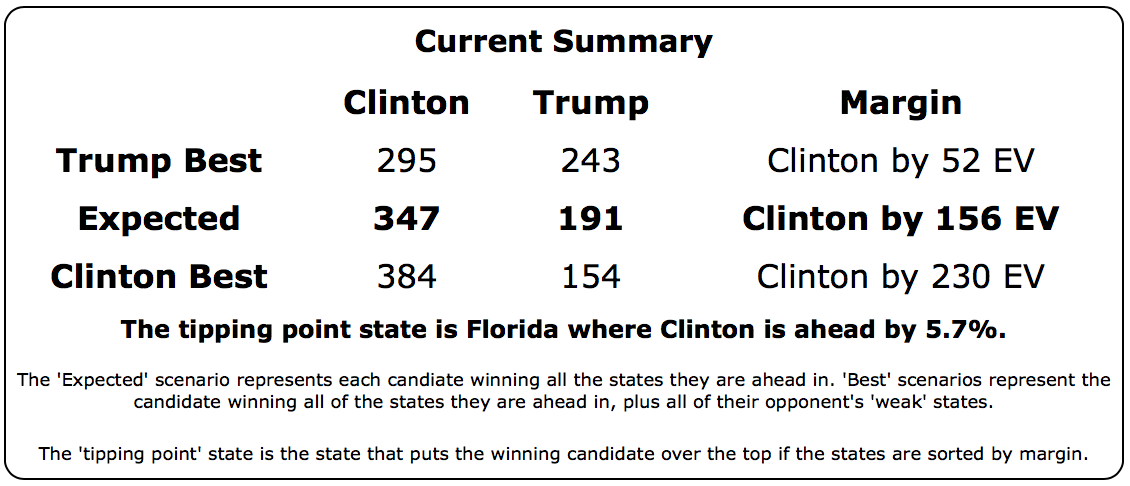
We still have a picture of Clinton dominating Trump. Even if Trump wins all the close states, he still loses. In the expected case, Trump’s result is still better than McCain but worse than Romney. A loss to be sure, but a loss comparable to the Republican losses in the last two elections, not an unusually bad loss.
We are now only a week away from the Republican convention. There is usually a bit of a bounce after a convention (although it usually doesn’t last too long). But this year is unusual. Who knows what we will see.
120.3 days until polls start to close on Election 2016.
Note: This post is an update based on the data on ElectionGraphs.com. Election Graphs tracks both a poll based estimate of the Electoral College and a numbers based look at the Delegate Races. All of the charts and graphs seen in this post are from that site. Additional graphs, charts and raw data can be found there. Follow @ElectionGraphs on Twitter or like Election Graphs on Facebook to see announcements of updates or to join the conversation. For those interested in individual general election poll updates, follow @ElecCollPolls on Twitter for all the polls as they are added. If you find the information in these posts interesting or useful, please consider visiting the tip jar.
This week on Curmudgeon’s Corner Sam and Ivan talk about Election 2016 of course. But first some bits about Mike the headless chicken, the comments on Sam’s Election Graphs site, stamp prices, Hey Siri, and a movie Sam watched. When they do get to the election they cover Trump’s shutout in Colorado, Trump’s general malpractice in delegate wrangling, the odds of a contested convention, the accusations of cheating in both parties, and much more!
Click below to listen or subscribe… then let us know your own thoughts!

Recorded 2016-04-14
Length this week – 1:20:15
 1-Click Subscribe in iTunes 1-Click Subscribe in iTunes
 View Podcast in iTunes View Podcast in iTunes
 View Raw Podcast Feed View Raw Podcast Feed
 Download MP3 File Download MP3 File
 Follow the podcast on Facebook Follow the podcast on Facebook
Show Details:
- (0:00:41-0:22:29) But First
- Ivan in his Car
- Mike the Headless Chicken
- Election Graphs Comments
- Stamp Prices
- Facebook Bots
- Hey Siri
- Movie: Mississippi Burning (1988)
- (0:23:08-1:00:14) Election 2016
- Trump shutout in Colorado
- Delegate wrangling malpractice
- Contested Convention Scenarios
- Ryan saying no… Again
- Odds of Trump getting majority
- Trump Trends
- Cruz wooing delegates
- (1:00:53-1:19:55) Election 2016 Continued
- Cheating? Stealing? Unfair? Rigged?
- Sanders “contesting” the convention
- Sanders attempts to woo superdelegates
- Edit wars on Wikipedia Superdelegate list
- Denial from Trump and Sanders people
- What Sanders and Trump didn’t do
- When is New York again?
- Thoughtful Trump people wanted
Colorado is odd in that it dribbled out delegates over a couple of weeks. The 6 from the 1st and 6th congressional districts were already included when the Michigan results came out. Those 6 were all Cruz. Since then I added notes about the rest of Colorado’s congressional districts to the Michigan post. Cruz won all 15 of those delegates. Then yesterday Cruz won all 13 at large delegates.
There are 3 more delegates from Colorado who are state party leaders and have not yet expressed a preference.
But Cruz has won all 34 of Colorado’s delegates that were available via the caucus process.
Since March 23rd, Trump has gotten bad news in Alaska, American Samoa, Louisiana, North Dakota, Wisconsin and Colorado. Some of those were “new” results in states, others were just updates as more information came in. Either way, none of those updates went Trump’s way.
Lets look at the chart:
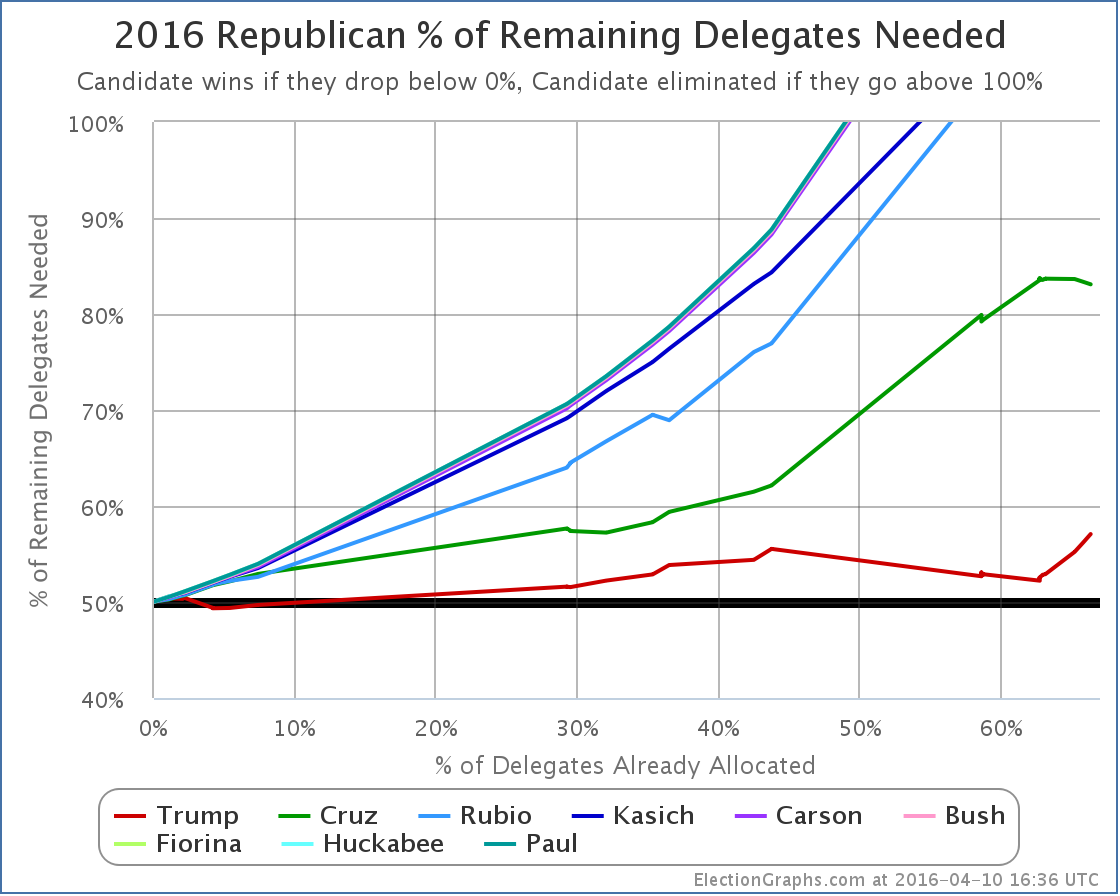
After Arizona and Utah Trump needed 52.22% of the remaining delegates to be on a winning pace.
Since then the delegate deltas have been Cruz +78, Trump +6, Rubio +4, Kasich +1. And that Kasich delegate is being generous interpreting one uncommitted delegate’s comments. That might actually be a Cruz delegate in the end.
So Cruz got 78/89 = 87.6% of the delegates.
Trump got 6/89 = 6.7% of the delegates.
Needless to say this is far below the 52.22% Trump needed to improve his position.
Instead, he goes from needing 52.22% of the remaining delegates to needing 57.07%. This is huge change.
Winning 57.07% of the delegates would represent a 23% improvement over the 46.46% of delegates pace he has so far. That is a pretty substantial improvement.
Trump is in the worst position he has been so far. This is not where he wants to be. Everything is going in the wrong direction.
But is it time to assume a contested convention yet? The drum beat about that has certainly begun.
I could do my usual of calculating an estimate for New York from current polling, and then look where that puts us, but other folks have done more in depth projections. I’ll specifically point out two:
Both of these two outline scenarios where Trump can still get to 1237. These are not highly unlikely scenarios like those required to get to a Sanders win on the Democratic side, but rather perfectly reasonable possibilities given current polling data. Trusting current polls completely, Wang actually gets a 92% chance of Trump getting the delegate majority. When he adjusts for the fact Cruz has been over performing his polls, that drops to 70%. This is by no means certain, but it is still more likely than not.
In addition you can run your own simulations at The Upshot or FiveThirtyEight. With either of these it is not that hard to get Trump to 1237. Try it yourself. It is fun.
My own take is that some of Wang’s assumptions about how uncommitted delegates will break is a bit generous to Trump given his performance so far with uncommitted and unbound delegates. So 70% chance of an outright majority seems a bit high.
In the last Curmudgeon’s Corner podcast I said my gut feel was that we have a 60% chance of a multiple-ballot convention at this point. Which would mean a 40% chance that Trump wins outright. (I allowed for some additional chance of convention shenanigans like trying to change the rules to unbind delegates on the first ballot, or that the results of there 1st ballot would be unclear until the actual vote due to uncommitted delegates.)
Trump was EXPECTED to do badly in Colorado and Michigan… perhaps not quite this badly, but still it means that it is easy to get distracted by notions of “momentum” that may or may not be real. The fact that Trump did well in Arizona, but then badly in Colorado does not represent a change in the state of the race. It is just a function of the makeup of those states and the calendar. To see if things have really changed from being “right on the edge between a Trump win and a contested convention” we need to see deviations against how the remaining states are expected to play out.
We haven’t seen that quite yet.
But all the anti-Trump forces are pushing against him hard and Trump has no margin for error in the remaining states. He has to do well in all the places he is expected to do well. He might actually need to exceed expectations by a bit. If he starts dipping, even a little bit, then we are at a contested convention. And given what appears to be Cruz’s skill at collecting “ghost delegates” who are bound to Trump on the first ballot but who really support Cruz, a Trump loss on the first ballot almost certainly means Cruz (or maybe someone else, but probably Cruz) wins on a later ballot.
Keep watching New York and if Trump stays over 50% in the popular vote, which will get him all or almost all of the delegates. That is the next big test. If Trump underperforms expectations in New York, we almost certainly will have a multi-ballot convention. If he matches or exceeds expectations, then the path to an outright Trump win remains open.
[Update 2016-04-13 15:19 UTC: Update from North Carolina. Net Change: Carson +1, Trump -1.]
Note: This post is an update based on the data on ElectionGraphs.com. Election Graphs tracks both a poll based estimate of the Electoral College and a numbers based look at the Delegate Races. All of the charts and graphs seen in this post are from that site. Additional graphs, charts and raw data can be found there. All charts above are clickable to go to the current version of the detail page the chart is from, which may contain more up to date information than the snapshots on this page, which were current as of the time of this post. Follow @ElectionGraphs on Twitter or like Election Graphs on Facebook to see announcements of updates or to join the conversation. For those interested in individual general election poll updates, follow @ElecCollPolls on Twitter for all the polls as they are added.
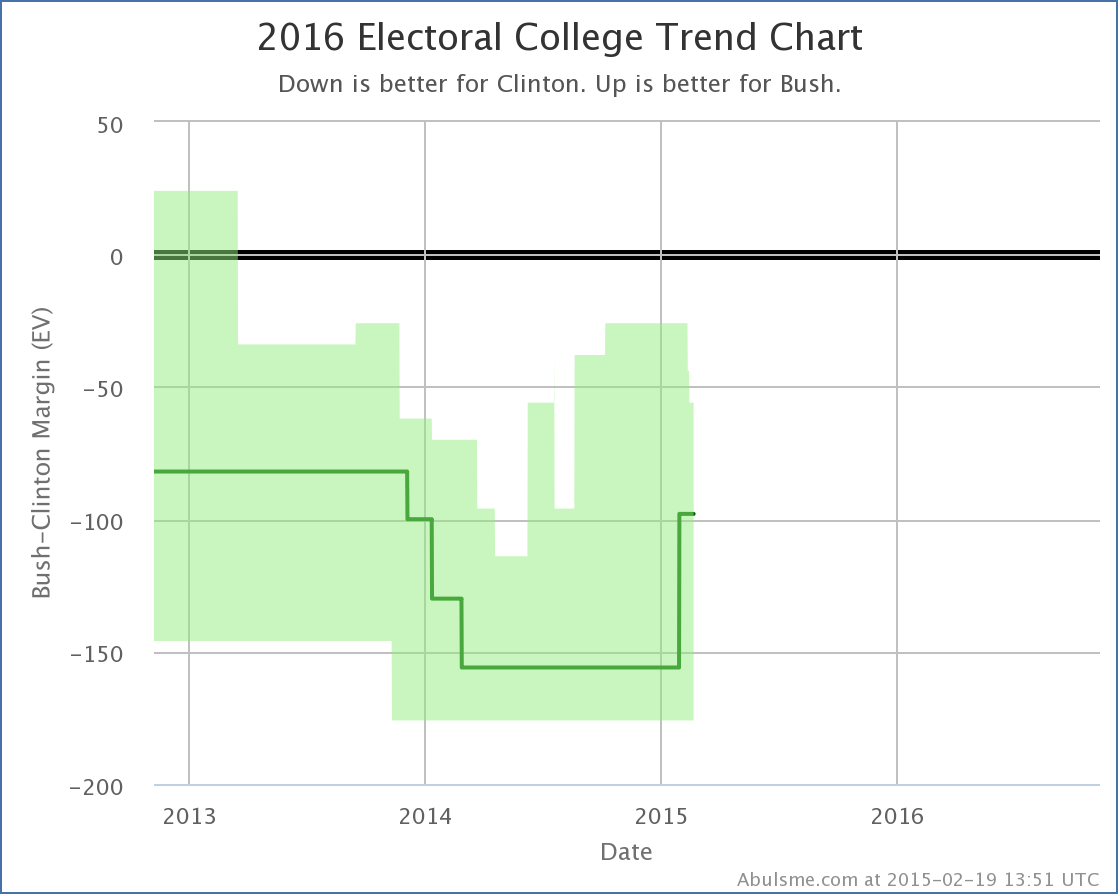
To get the headline out of the way… for the first time since officially launching my 2016 electoral college polling tracking back in November, one of the Republicans with a significant amount of state level polling is within reach of Clinton. We now see a scenario where “if the election was held today” and the Republican was to outperform their polling… but by an amount that is not inconceivable… then the Republican would win.
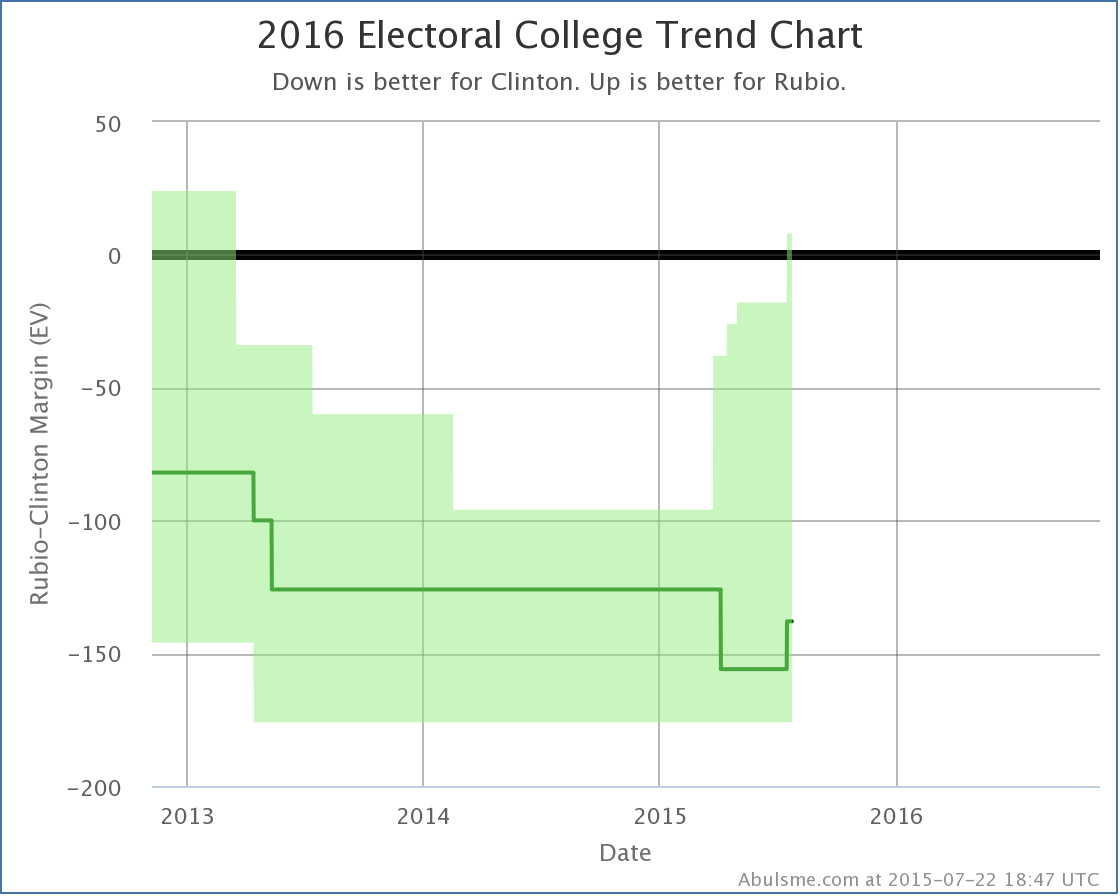
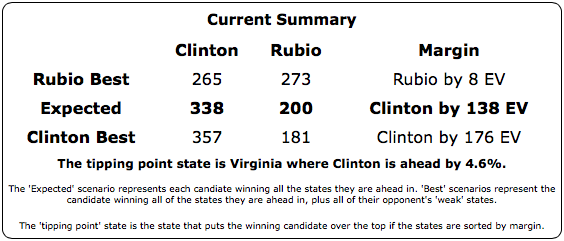
Specifically, while Clinton is still ahead against all five of the “best polled” Republicans challenging her (Bush, Rubio, Paul, Christie and Huckabee), if you give Rubio not only all the states he is already ahead in, but also all of the states where Clinton’s lead is less than 5%, then we end up with Clinton 265 to Rubio 273, a narrow 8 electoral vote victory for Rubio. The idea here is that a 5% lead is small enough that it can easily slip away under the right circumstances. So this does’t mean that Rubio is actually ahead, but it means that Rubio winning against Clinton is within the realm of the plausible.
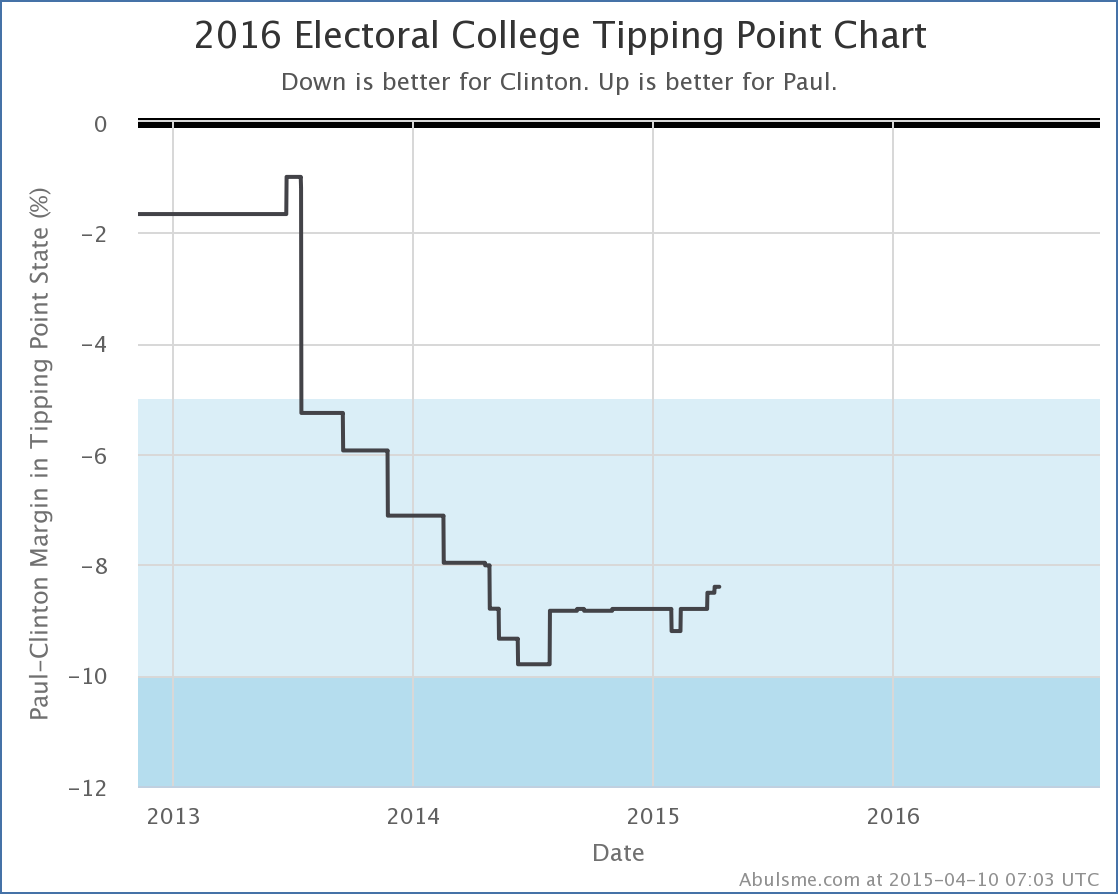
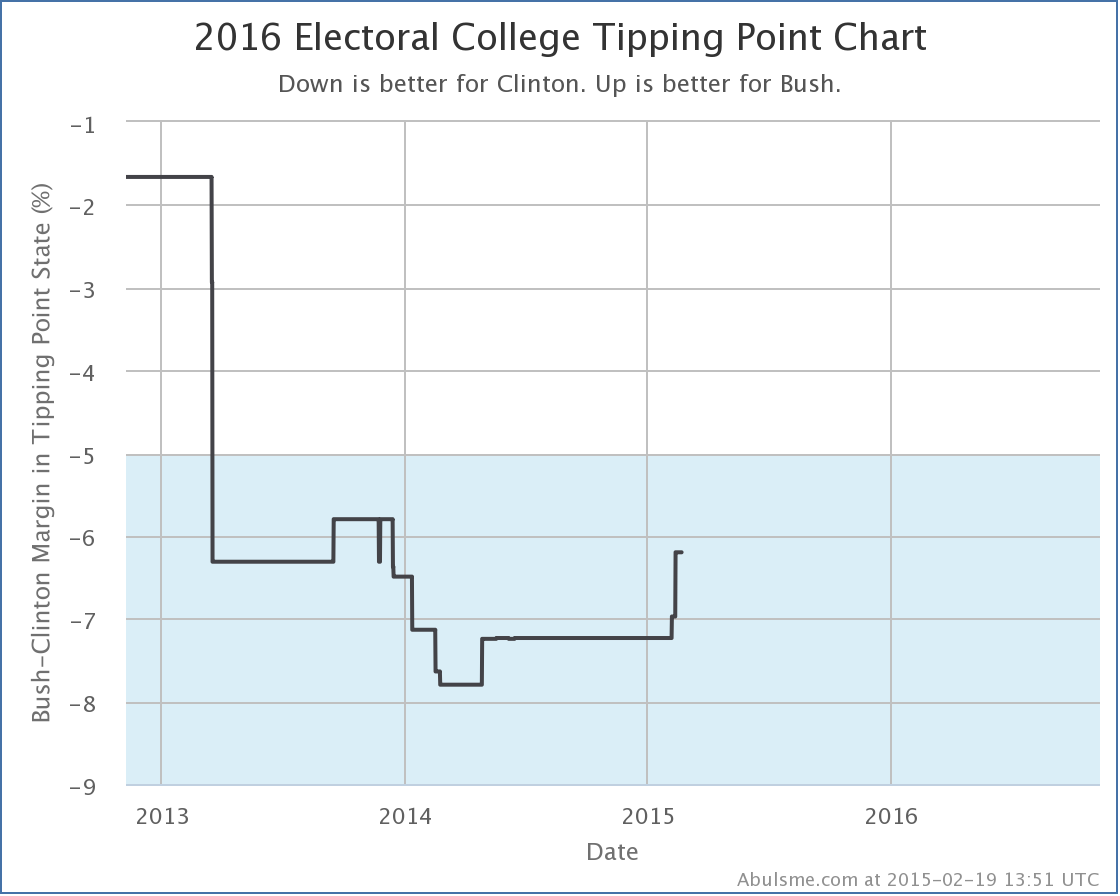
This also shows up in the “tipping point”, which now shows a Clinton lead of less than 5% for the first time since our launch:
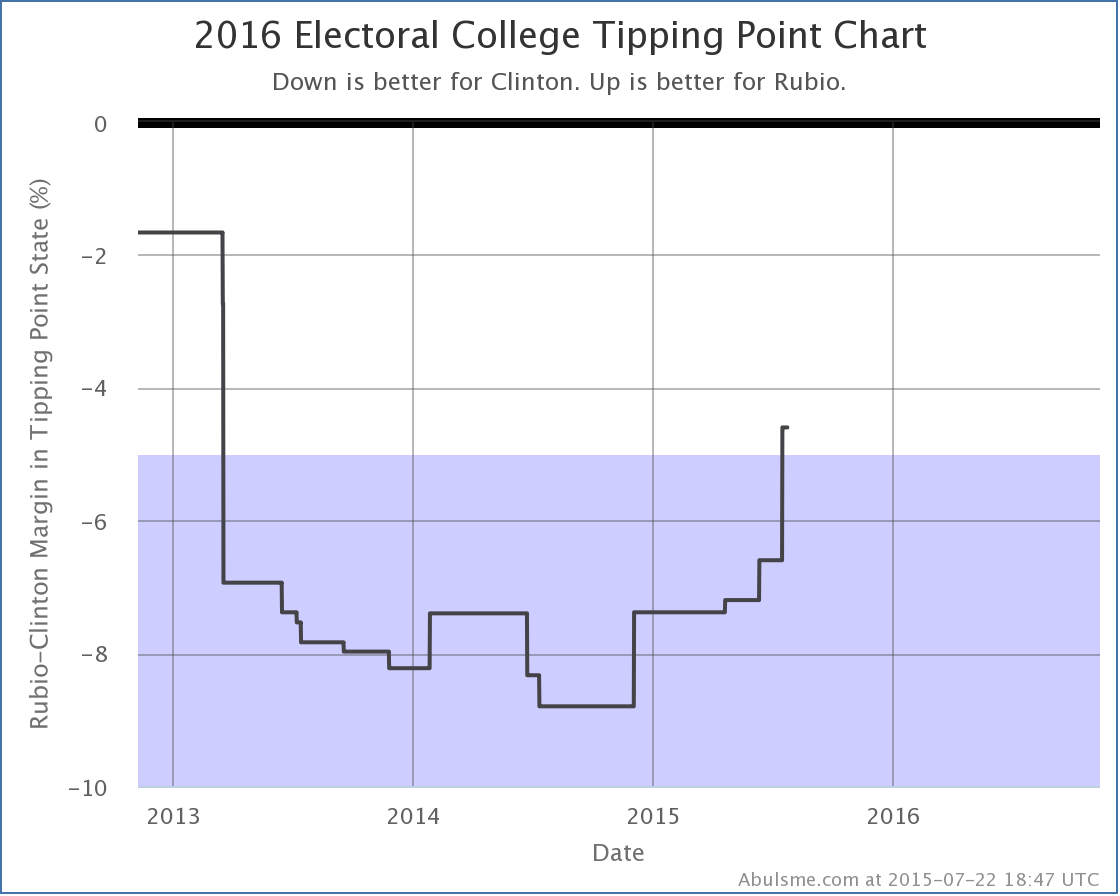
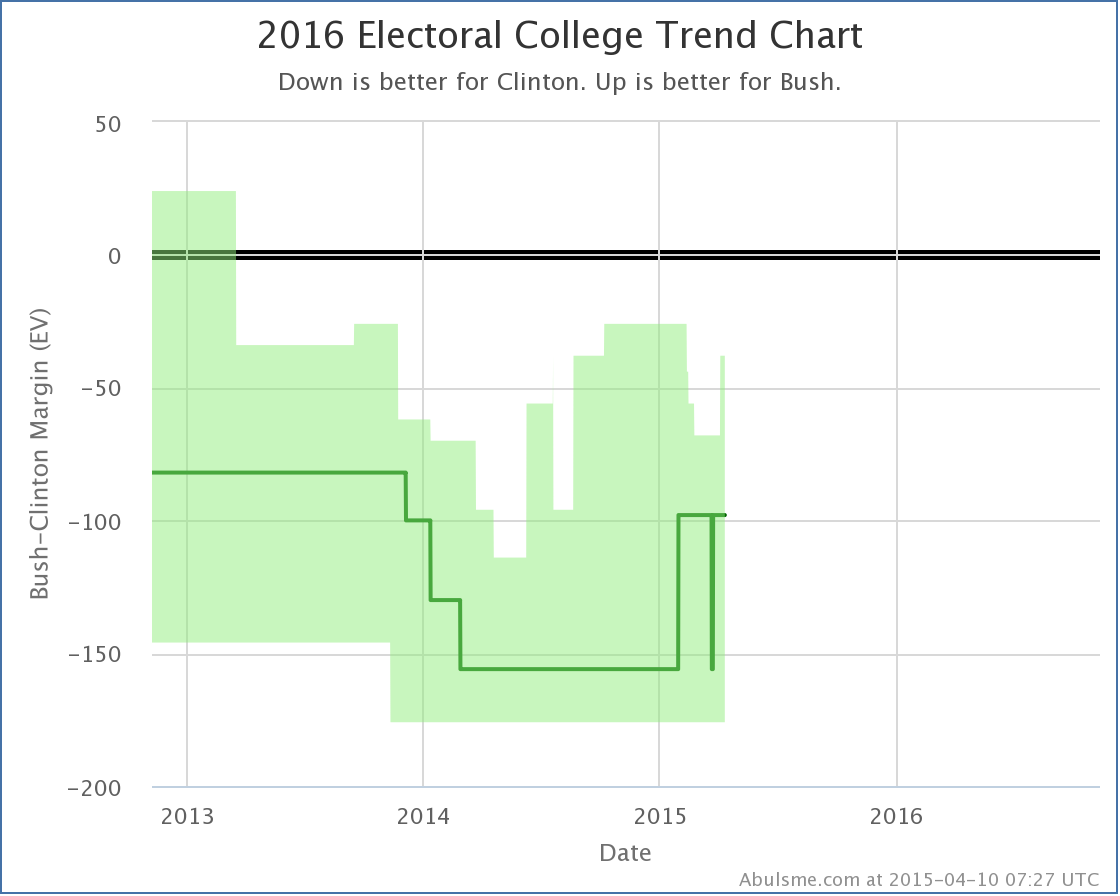
Rubio is the first Republican to manage this, but trends have been against Clinton in recent months. Bush is just barely short of this marker. His best case is to lose by only 4 electoral votes. If he makes one more state close, winning will also be within range. And Paul isn’t that much further behind.
Yes, yes, Clinton is still significantly ahead, the best any Republican does if you just give them the states they are actually ahead in is to match Romney’s loss in 2012. But still, we now have at least one Republican where the polls are close enough that a victory is at least imaginable! So as per the title we have a race!
Now the state level details for those who want them…
Qunnipiac released the latest results in their Presidential Swing State Poll series today. There was a lot of buzz about how bad it was for Clinton, showing her behind to Bush, Walker and Rubio in Colorado, Iowa and Virginia. Indeed, this single poll looked really bad for her in all three states… in fact enough out of line with other recent results that it is very tempting to think it may just be an outlier rather than a real indication of a major change.
Of course, that is why we do poll averages. Looking at the averages, adding these new results moves things toward the Republicans, but nowhere near as dramatically as if you just looked at the Quinnipiac results in isolation.
Quinnipiac polled nine different candidate combinations, but I only look at the five combinations that have the best polling over all. So I’m not going to talk about the Sanders vs Bush matchup that Quinnipiac polled. Sorry. (That’s the 17th best polled candidate combination by the way.)
Anyway, of the five best polled combinations, only Clinton vs Rubio had any significant changes. Beyond the headline, lets look at the two states that actually changed status.
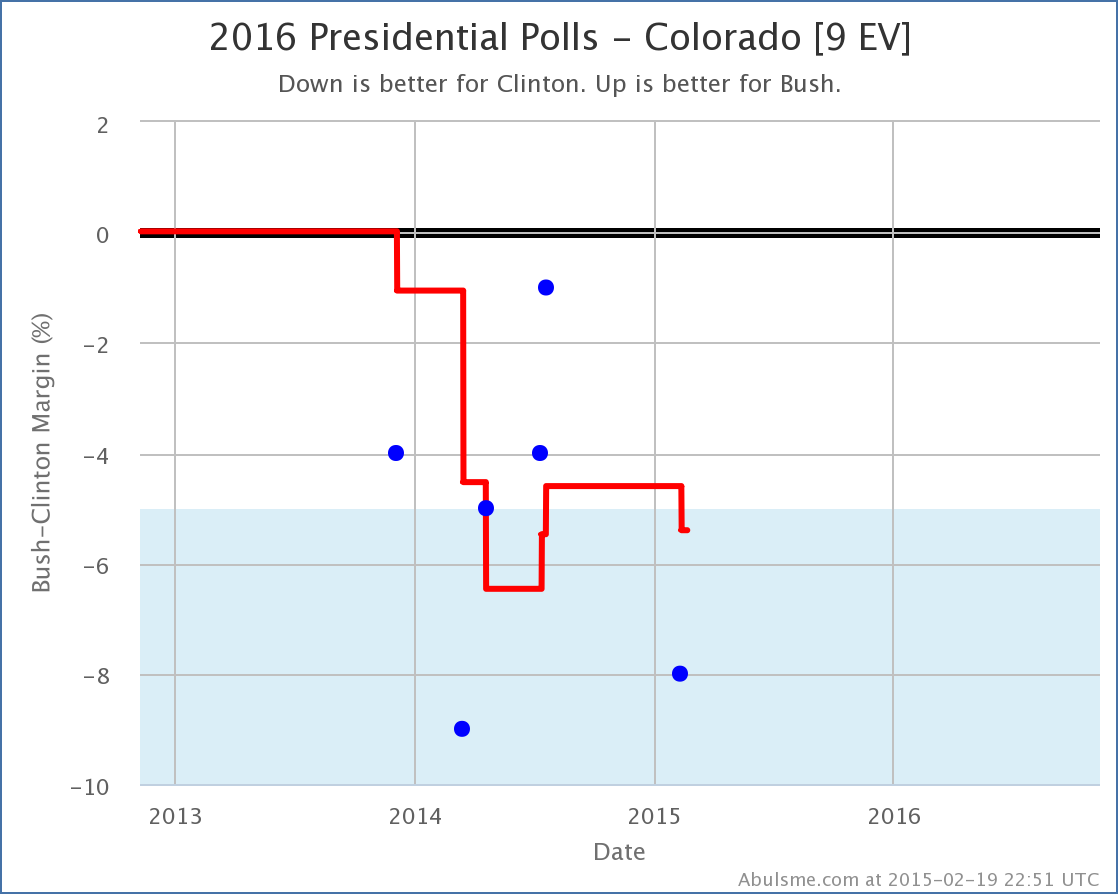
First off, Colorado:
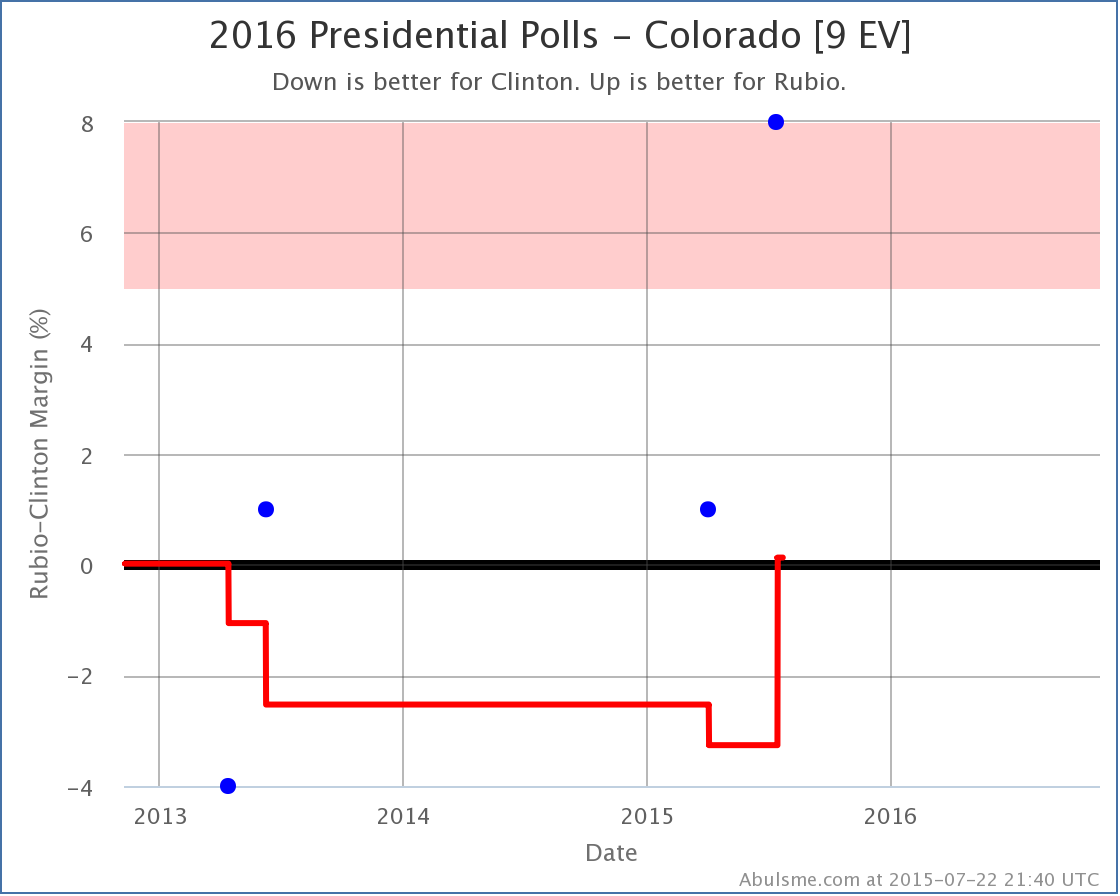 ‘ ‘
Clinton vs Rubio in Colorado has been very lightly polled… only four polls since the 2012 election, so the 2012 election results themselves are still included in the average. But the latest result is just enough to leave Rubio ahead by 0.1%. With Rubio now ahead in Colorado, the “expected” electoral college result moves to Clinton 338, Rubio 200, a 138 electoral vote margin for Clinton. (For comparison, Obama’s margin over Romney was 126 electoral votes.)
Virginia also changed categories:
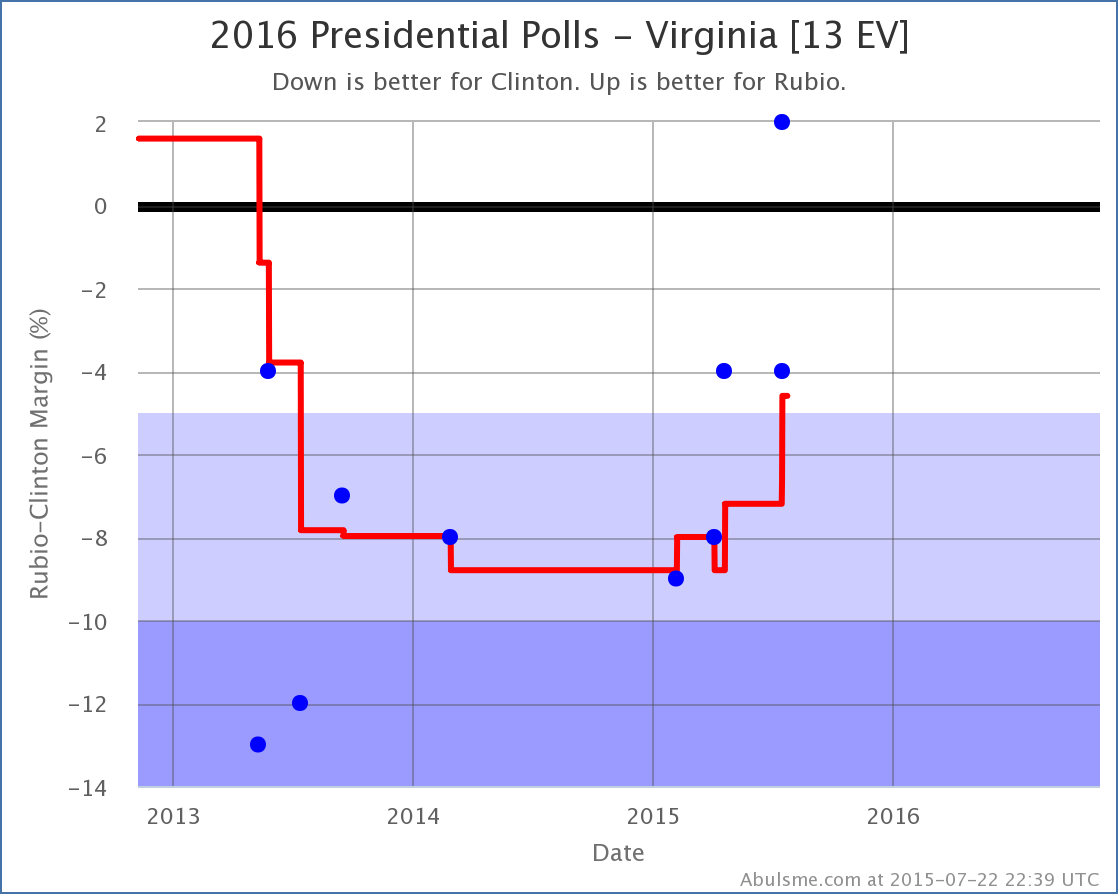
There have been quite a few more Clinton vs Rubio polls in Virginia than there were in Colorado. The new Quinnipiac poll accelerated a trend toward Rubio, and pushed Virginia from “Strong Clinton” to “Weak Clinton”. This is of course what prompted the improvement in Rubio’s best case and put him within reach of Clinton.
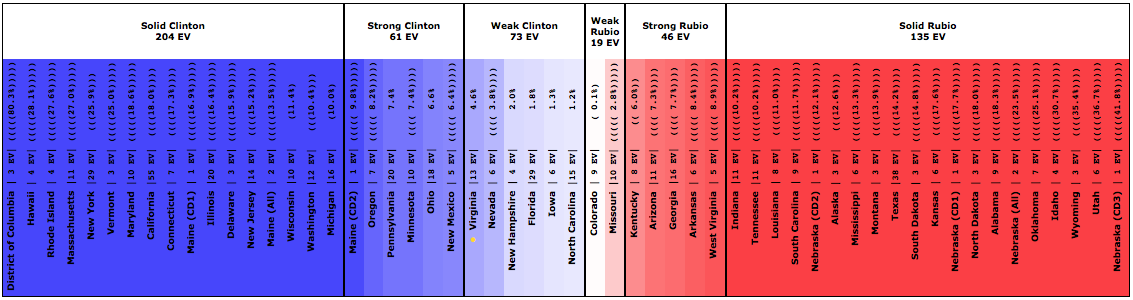
The full Clinton vs Rubio spectrum looks like this today:
And the full summary:
To win, Rubio would still need to flip North Carolina (1.2% Clinton lead), Iowa (1.3% Clinton lead), Florida (1.8% Clinton lead), New Hampshire (2.0% Clinton lead), Nevada (3.8% Clinton lead) and Virginia (4.6% Clinton lead). That sounds like a lot, but if national events or campaigning move things across all states, it means only 2.3% of voter have to change their minds to change the outcome. Even in today’s highly polarized climate, that is easily imaginable.
So, for the first time since the 2012 elections, it is starting to look like we have a real race. This is not unexpected. In my November post “The Race Begins” I said:
The real campaign against Clinton hasn’t ramped up yet. Lots of mud will be thrown. And the Republican candidates will get more and more visibility. Although anything is possible in either direction, it is quite possible that what we are seeing right now will be Clinton’s high water mark. The race is likely to get closer as we move through 2015 and people get more engaged.
Yup. That looks like what has been happening.
475.0 days until the first general election polls close.
Note: This post is an update based on the data on my 2016 Electoral College Analysis Site. All of the charts and graphs seen here are from that site. Graphs, charts and raw data can be found there for the race nationally and in each state for every candidate combination that has been polled at the state level. In addition, comparisons of the best polled candidate combinations both nationally and each in each state are available. All charts above are clickable to go to the current version of the detail page the chart is from, which may contain more up to date information than the snapshots on this page, which were current as of the time of this post. Follow @ElecCollPolls on Twitter for specific poll details as I add them.
Today’s big poll dump was from Quinnipiac, in the latest of their “Swing State Poll” series. This edition features polls from Colorado, Iowa and Virginia and is given the headline “Paul Blooms As Clinton Wilts“. That sounds pretty strong. But lets see how that headline holds up when we look at today’s updates in the context of poll averages rather than just results from one pollster, and looking beyond just the individual states with my method of classifying states.
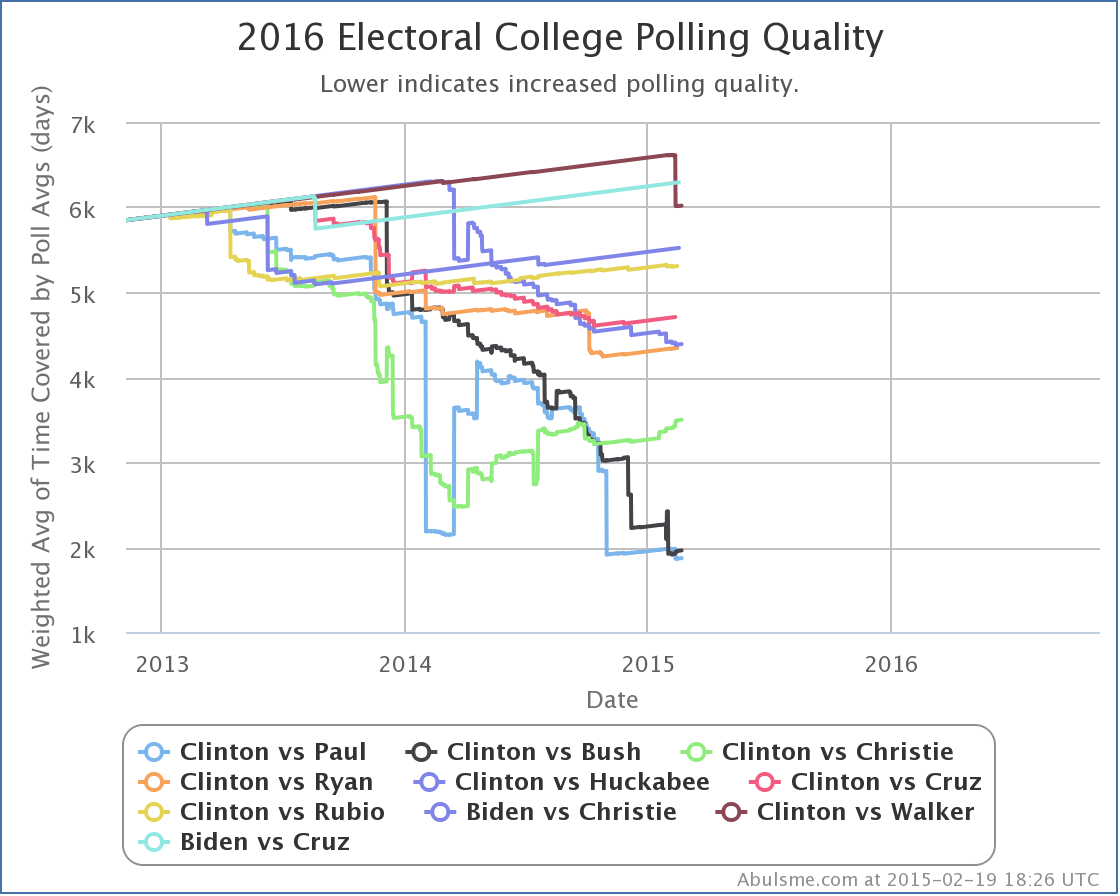
Quinnipiac tested seven candidate combinations, but only four of those are in the “five best polled candidate combinations” by the measure I use here, so those are the ones I will talk about today. That would be Clinton vs Bush, Paul, Christie and Huckabee. (The fifth combo on the top five, Clinton vs Ryan, hasn’t been polled by anyone since February, but Cruz, Rubio and Walker, the next three by my metric, and also the others polled by Quinnipiac, still haven’t had enough polling to catch up and pass Ryan.)
So of those four, what were the actual changes in my models? There were changes for three candidate pairs. In all three cases the changes favored the Republican.
Clinton vs Bush
With today’s update, Clinton vs Bush once again becomes the “best polled” candidate combination by my metric, taking the spot from Bush vs Paul and thus becoming the default view on election2016.abulsme.com.
More importantly though, with today’s updates Clinton’s lead in the polling averages in both Colorado and Iowa dropped below 5%, putting those states back into play as “close states” that we consider possible for Bush to win. With these two back in play, Bush’s best case improves from Clinton 303 to Bush 235 before the update, to Clinton 288 to Bush 250 now, a loss by only 38 electoral votes. You can see the uptick in the top right part of the “bubble” representing the reasonable range of outcomes for Bush against Clinton given current polling:
Clinton vs Paul
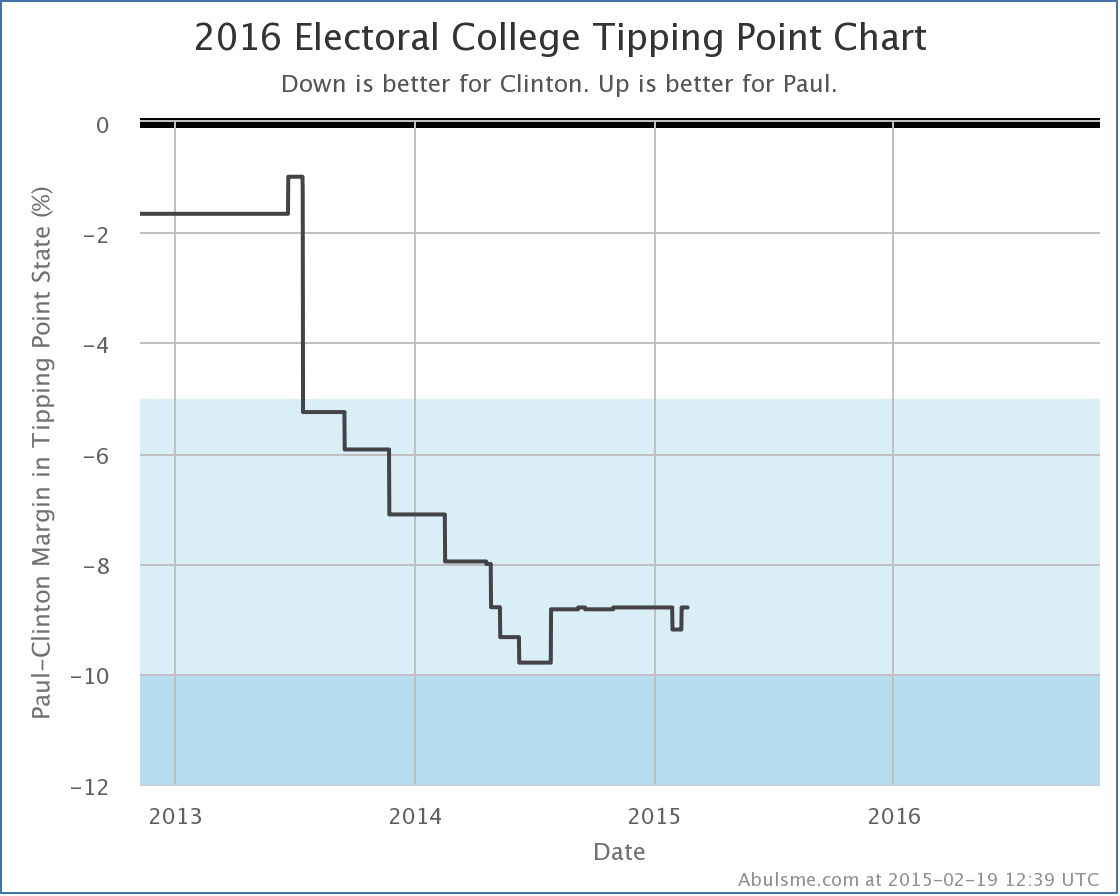
No states changed categories for Paul, despite the headline about Paul “blooming”. His average in Virginia however did improve from losing by 8.8% to only losing by 8.4%. This in turn moved his “tipping point margin”, a measure of how much polls need to move nationally to flip the electoral college, from being behind by 8.5% (with Wisconsin being the tipping point state) to being behind by 8.4% (with Virginia as the new tipping point state). This is the third tipping point change in a row in Paul’s direction. Almost starting to look like a trend.
Clinton vs Huckabee
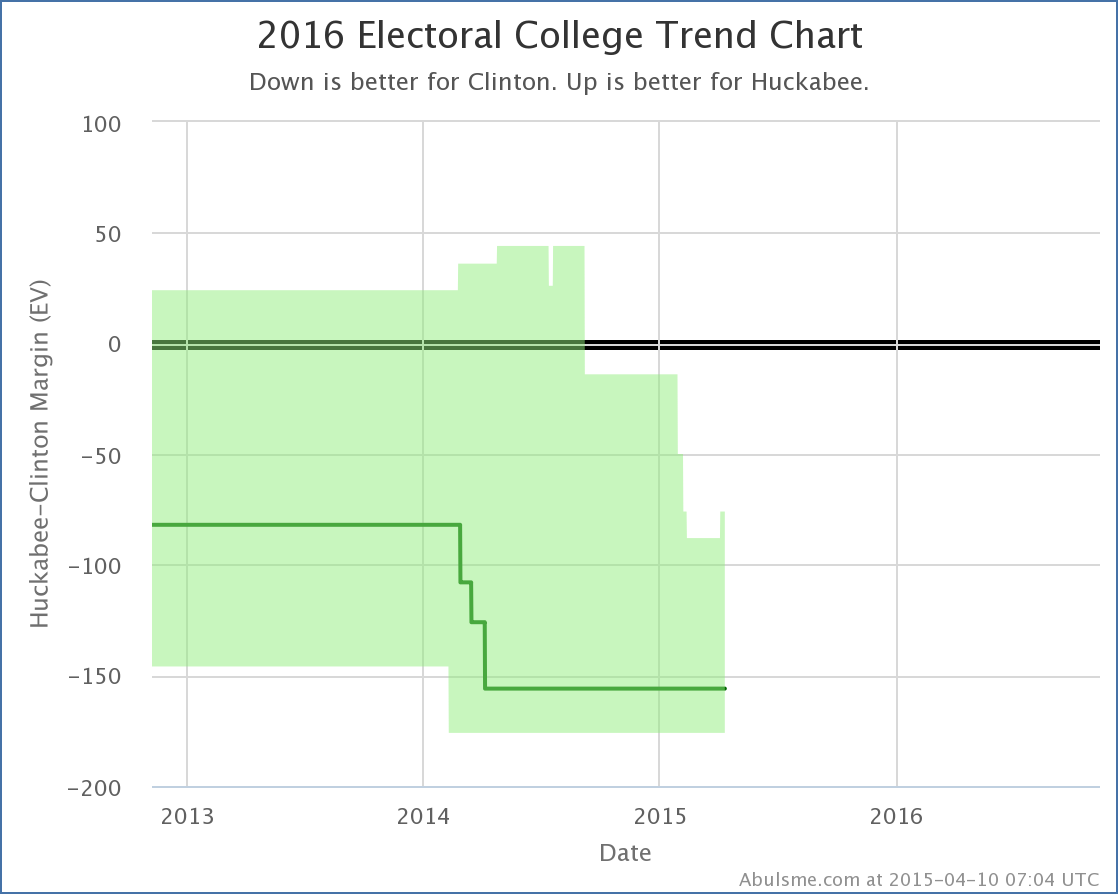
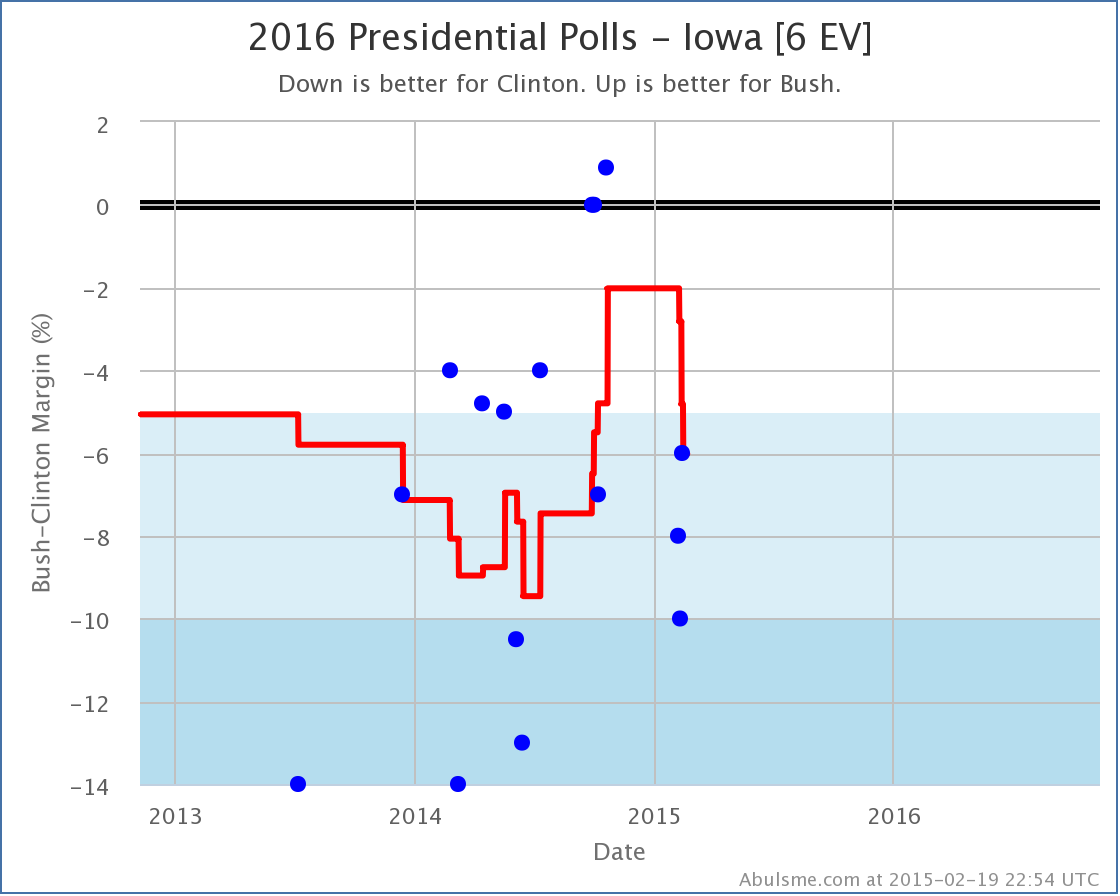
With the new results from Quinnipiac, Clinton’s lead against Huckabee in Iowa falls from 6.6% to 4.6%. That’s a rather big drop, and it makes Iowa once again a “possible” for Huckabee. So his best case moves from losing by 88 electoral votes, to only losing by 76 electoral vote. You can see this at the top right of his “bubble”:
State Comparisons
Now, while Clinton does weaken in each of the three cases above, none of this really seems to justify the “Paul Blooms as Clinton Wilts” headline on the national level. But of course these polls weren’t at the national level. The headline was really specifically about the three states polled. So lets look at how each of the candidate pairs in question are doing in these three states specifically. In each one, just look at the very last change in the lines to see how this new poll result affected the averages. (All the charts in this section also include Clinton vs Ryan, but that line can be safely ignored, since Ryan wasn’t included in these polls.)
So, in order of the number of electoral votes:
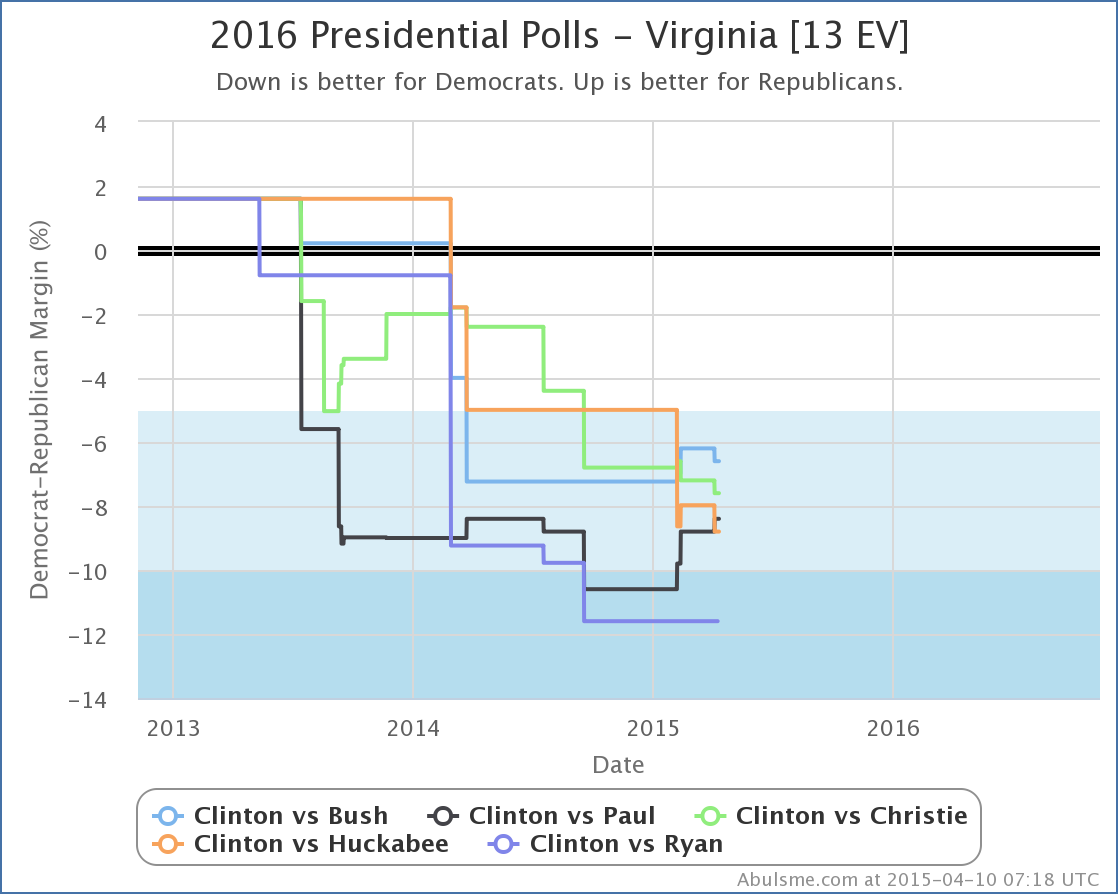
Bush, Christie and Huckabee actually fell further behind in Virginia as a result of this new polling. Paul was the only one of the four who actually improved in Virginia, reducing his deficit from 8.8% to 8.4% in my average. None of the four candidates made a move that changed the category though. Virginia is “Strong Clinton” against all four of these candidates, and this polling didn’t change that. Paul does stand out here though, by being the only one improving against Clinton.
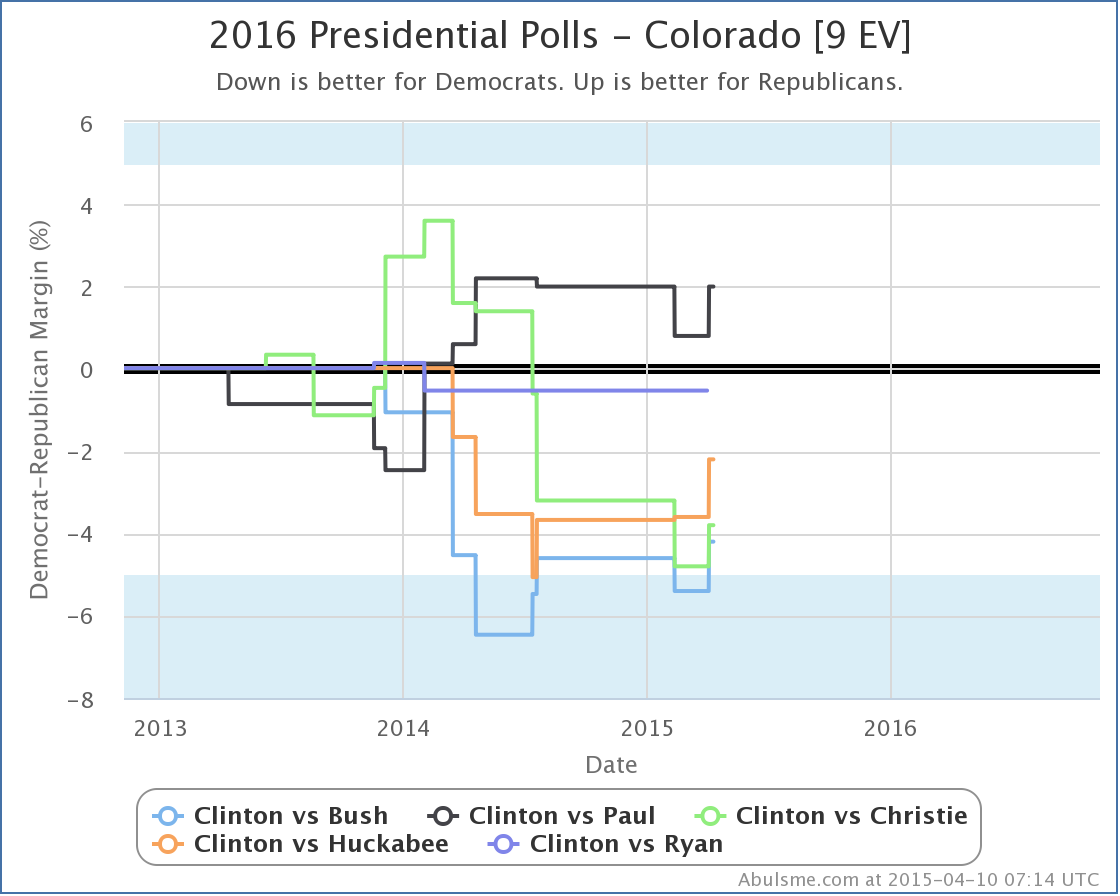
In Colorado all four of the candidates improve against Clinton as a result of the Quinnipiac poll. Bush actually moves into the white zone here, which as was mentioned earlier, means that the state is now a possible win for him. But this actually just brings Bush back in line with the rest of the pack. Colorado is a close state for all of these candidates.
Paul stands out in Colorado too, but not for the recent movement, but because he is the only one of these candidates who is showing that he could turn Colorado red again. (Colorado went blue for Obama in both 2012 and 2008, but was red in 2004, 2000 and 1996.) This is not new though. Paul has been consistently leading in the Colorado poll average against Clinton for over a year.
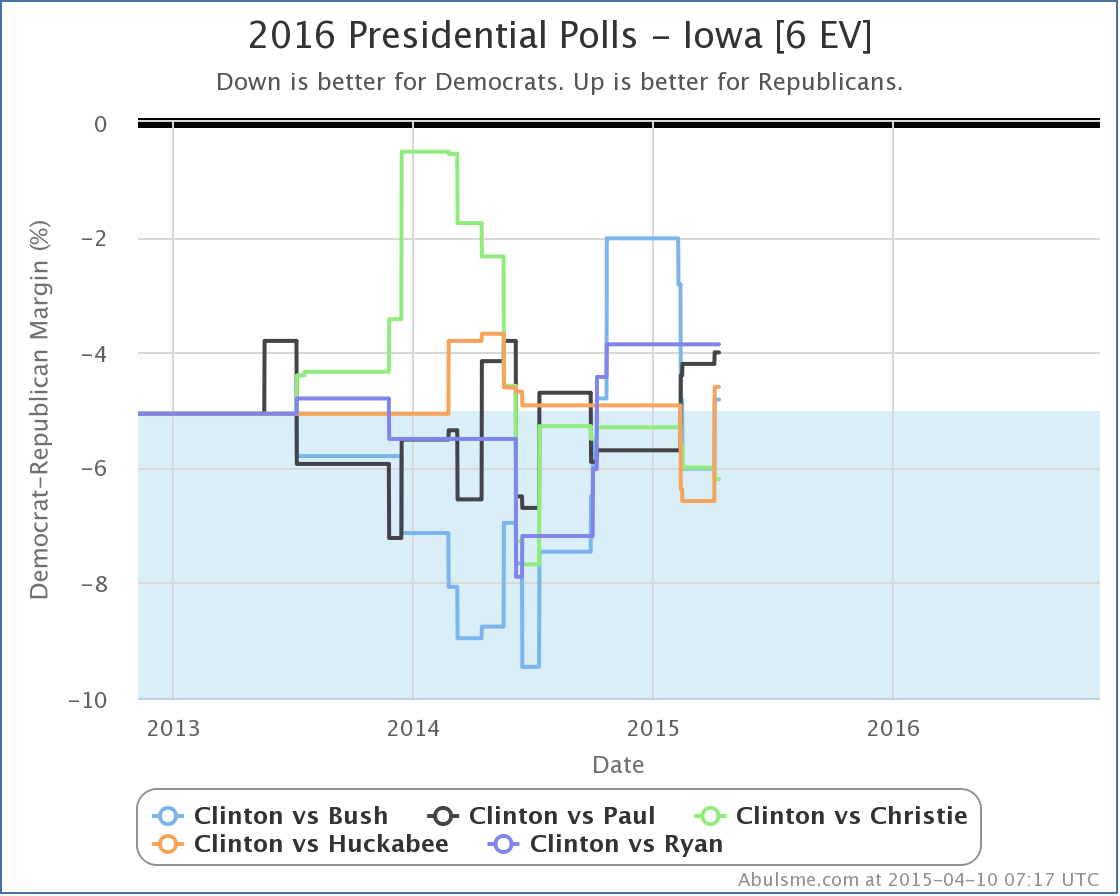
Bush, Paul and Huckabee all improved in Iowa, with Bush and Huckabee of course moving Iowa back into competitive territory, where Paul already was. Christie fell a bit further behind.
With all of the above, the moves were definitely not friendly to Clinton on the whole, but “wilting” looks like hyperbole. And while Paul does well here, so do Bush and Huckabee, arguably with moves just as significant as Paul’s if not more so.
So where does Quinnipiac get their headline?
Well, duh, they are only looking at their own polls. They are comparing their most recent results in these three states with the results of the last time they polled these three states back in February. I’m sure if you look at things with only that lens, it looks like exactly what they say it does. But you are ignoring a lot of data if you do that.
For instance, looking at only Quinnipiac data in Iowa, you see a move from Clinton having an 8.0% lead in February, to Paul being ahead by 1% now. Huge move, right? Massive momentum away from Clinton and toward Paul, right?
Lets look at the chart showing all the Clinton vs Paul polls in Iowa, not just Quinnipiac:
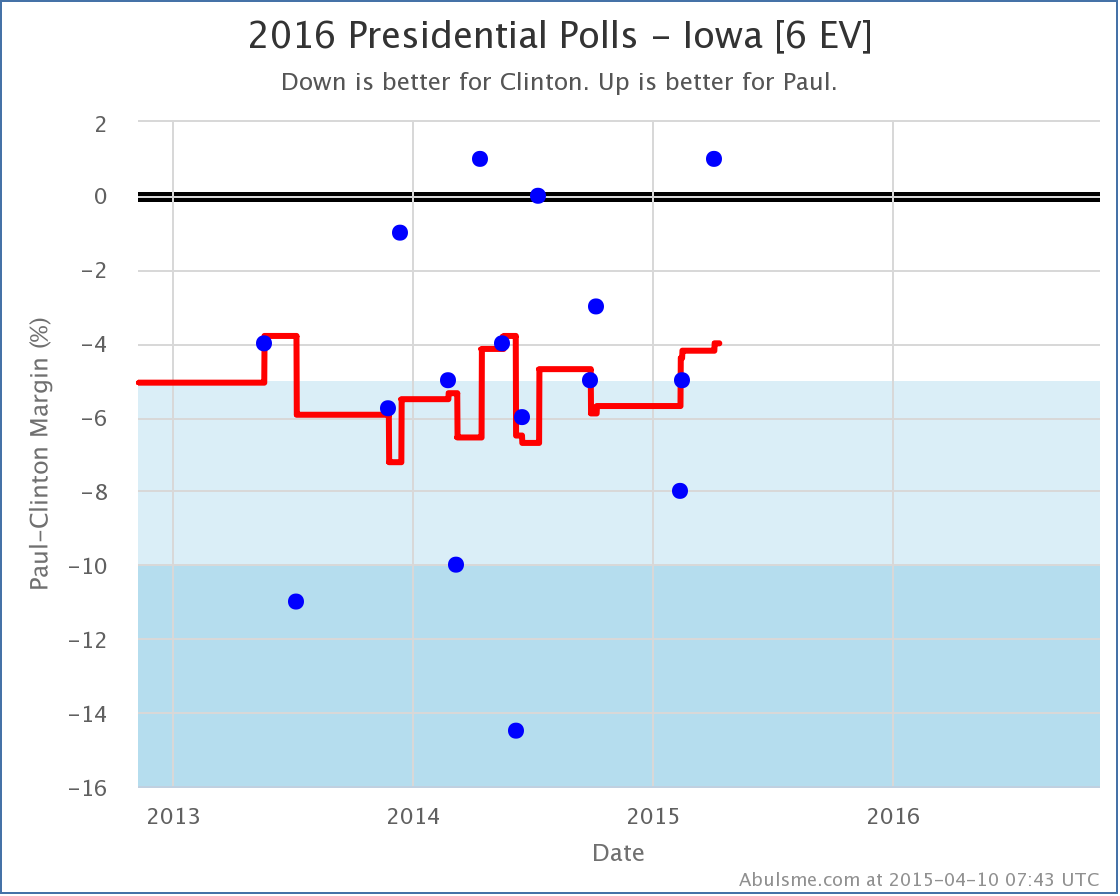
Hmmm… where did the trend go? Now, there have only been three polls so far in 2015, and it is true that each one has been better for Paul than the one before. But looking at the history of polling Clinton vs Paul in Iowa since the 2012 election, you see that the results are all over the place. There is huge scatter here. The results bounce all over the place. And so far, there has not been any sort of clear trend at all.
Yes, the new Quinnipiac poll looks great for Paul. He’s beating Clinton in Iowa! But there was a poll about a year ago that said that too. It wasn’t backed up by other polls though and wasn’t the sign of a big trend toward Paul. It was just more random variation. It wasn’t real.
Could this new poll be the first signs of a real long term movement? Maybe. Maybe not.
Kids, this is why we look at poll averages instead of individual polls.
If there is an actual big movement toward Paul, or any of the other Republican candidates, we’ll know soon enough as more and more polls start showing that movement. But no such clear trend is visible yet for any of the candidates with the most polling.
(I mentioned at the top that right now Clinton vs Cruz is the 6th best polled combo, Clinton vs Rubio is at #7, and Clinton vs Walker is at #8. You can click through on those links if you want to see what those look like at the moment. The amount of state level polling still isn’t great on those guys, so interpret the charts carefully.)
Note: This post is an update based on the data on my 2016 Electoral College Analysis Site. All of the charts and graphs seen here are from that site. Graphs, charts and raw data can be found there for the race nationally and in each state for every candidate combination that has been polled at the state level. In addition, comparisons of the best polled candidate combinations both nationally and each in each state are available. All charts above are clickable to go to the current version of the detail page the chart is from, which may contain more up to date information than the snapshots on this page, which were current as of the time of this post.
Another day and yet more polls moving things around. So lets go…
As usual click on any of the charts for more detail.
Clinton vs Paul
First of all, the latest batch of polls has Clinton vs Paul once again the “best polled” candidate combination, pushing Clinton vs Bush out of that spot. Keep in mind this does NOT mean they are the frontrunners in their respective parties, just that there have been more polls in the closest states than there have been for other candidate pairs. This means the default view on election2016.abulsme.com is now Clinton vs Paul. But the gap between them on my polling quality metric is very small, so don’t be surprised if they switch places again.
Next, a new poll in Virginia improved Paul’s standing slightly. No category change, Virginia is still a “Strong Clinton” state based on current polling against Paul. But the tipping point was moved:
The tipping point moves from Clinton by 9.2% in Ohio, to Clinton by 8.8% in Virginia. This represents how big a uniform move in the polls across ALL states would have to happen to give Paul the edge in the Electoral college. This is basically because at the moment, to win, Paul would have to flip North Carolina (0.2% Clinton lead), Nevada (2.8% Clinton lead), Iowa (4.2% Clinton lead), New Hampshire (4.9% Clinton lead), Minnesota (7.0% Clinton lead), Michigan (8.6% Clinton lead), and Virginia (8.8% Clinton lead). [This is the list of states that are closest that would need to be flipped, there are of course other combinations that would do the trick if Paul flipped states with even bigger Clinton leads.]
Since Virginia would be the state that would put Paul over the top, it is the tipping point state and the margin there is the amount everything would have to move to make this scenario happen.
Clinton vs Bush
This combination sees relevant changes in Colorado, Iowa and Virginia.
In Colorado, Clinton’s lead grows to over 5%, so this state moves out of contention and into “Strong Clinton”. (For now anyway, but do I really need to repeat just how early things are, and how relatively sparse polling still is too?)
Same thing in Iowa. Although in Iowa, it looks like we might have a situation where the polling is returning to “normal” after a couple of outlier polls, while you could argue that in Colorado, the “true” state might just be bouncing around the 5% boundary line.
In either case, we shouldn’t be too surprised if the states get closer again.
With both of these states moving out of the “Weak Clinton” category, Bush’s overall best case against Clinton deteriorates a bit:
With this (plus another Iowa poll that was added yesterday) Bush’s best case against Clinton moves from losing by 26 electoral votes to losing by 56 electoral votes.
But while things haven’t been moving his way in Colorado or Iowa, in Virginia the latest polls have actually been moving toward Bush. No category changes… Virginia moved from a 7.0% Clinton lead to a 6.2% Clinton lead. This was enough to move the tipping point in Bush’s direction:
Virginia was the tipping point before this move, and it didn’t leapfrog any other states, so the tipping point stays in Virginia as it moves.
So Bush’s best case is getting worse, but his overall position is getting better? Yes, basically.
With current polling Iowa and Colorado now look like they aren’t competitive. So that is worse for Bush. But in order to win, Bush would have to flip a LOT of states, and the one he needs that he is furthest behind in is Virginia… but he is now not quite as far behind there. So if he is going to move all the states he needs to in order to win, he’s actually got a little bit less to move overall, even though Iowa and Colorado just moved a little further away.
Other folks
Just yesterday I was noting that Clinton vs Walker, despite being talked about quite a lot was still #18 on the ranking of best polled candidate combinations. With todays polls, he burst into the Top 10, debuting at #9, pushing Biden vs Rubio out of the Top 10. Still a bit away from the Top 5 combinations that I highlight here as having enough polling to say something useful about the race, but getting closer. If he continues to get lots of polling attention, while Clinton vs Ryan and Clinton vs Cruz and such do not, then he may get there sooner rather than later.


Three states move between my categories today. One moves toward Romney, two move toward Obama. That sounds like a mixed day, but on balance the benefit goes to Obama. As usual, lets look at the states in order by electoral college weight, but now I’ll zoom in to only show 3 months of polls rather than a year since we are getting close to the end (under three weeks!) and polls are coming in so quickly…

First up, Colorado. According to the five poll average, the state went from an Obama lead of 4.9% on September 23rd, down to a Romney lead of 1.3% on October 8th. With today’s update, Obama takes a very slim 0.5% lead again. This is essentially a tie, but with this the state tips ever so slightly back onto the Obama side of the ledger.

Georgia is Romney’s one piece of good news for the day, but there are a bunch of caveats.
Romney’s lead in Georgia hits 10%, so we move it to the “Strong Romney” category. But this is largely due to one poll from September that looks like an outlier, so absent other movement backing up that poll, Georgia is likely to revert back to “Weak Romney” once that poll ages off. If we even have enough more polls in Georgia before the election to do that. It has been pretty sparsely polled.
More to the point though, it doesn’t really matter if Romney’s lead in Georgia is just under 10% or just over 10%. Either way, Georgia is a Romney state, and there is no realistic scenario where Obama wins Georgia. Georgia is safe for Romney. So while winning by a bit larger margin may be “nice” for Romney, it doesn’t actually help him at all in the contest with Obama.

Obama’s lead in Michigan topped out at 9.7% on September 20th. It declined to a 4.0% lead on October 8th. It has now popped back up to 6.1%. It seems that the post-debate movement toward Romney was relatively short lived. In the last three months the degree of Obama’s lead in Michigan has bounced around quite a bit. It has however always been a lead. A few isolated polls aside, Romney has never held the lead in the five poll average in Michigan. For awhile there it looked like Michigan was close. Not so much any more.
All of this leads us to the new summary:
|
Romney |
Obama |
| Romney Best Case |
301 |
237 |
| Current Status |
248 |
290 |
| Obama Best Case |
191 |
347 |
Since Georgia doesn’t affect any of these three situations, what we see here is basically just Obama strengthening again. Some of the gains Romney had made in the last couple of weeks are just slipping back away from him. Yesterday Obama’s lead in Pennsylvania once again became substantial enough to not call it a close state. Today the same happens to Michigan. And Obama retakes the lead in Colorado.
It certainly looks like Romney peaked between August 12th and August 15th and things are now heading back in Obama’s direction, without Romney ever actually taking the lead in the electoral college model. If initial reactions to the second debate are any indication, at the very least we should expect no further downward plummeting by Obama, and perhaps even more additional upside for Obama beyond that.
Caution needs to be urged in interpreting this though. Only a small number of states have moved so far, and just barely over the respective category lines. More polls could easily reverse the recent changes. If these initial trends continue over the next few days though, we’ll get a very solid picture.
None of the polls included so far include the time period after the second debate. That will of course be the next thing to watch for. Will there be big noticeable effects from the second debate as there were after the first one?
Of course to win, Romney needs to do more than just hold on to his previous gains. He actually needs to bring even more states over to his side in order to win. If he couldnt’ do it last week, then what exactly can he do now to make it happen?
At the moment Obama’s lead is still very narrow. Romney has many potential ways to win. It is still a close race. But the movement seems to be shifting toward Obama again.
Note: Chart and map from the Abulsme.com 2012 Electoral College Prediction page. Both assume Obama vs Romney with no strong third party candidate and show polling as it currently exists. Things will change before election day. On the map red is Romney, blue is Obama, gold states are too close to call. Lines on the chart represent how many more electoral votes a candidate would have than is needed to tie under several different scenarios. Up is good for Obama, Down is good for Romney.


Two states changing status today, and both are bad news for Obama. Lets get right to it:

Prior to the debate last week, Obama’s lead in the five poll average in Nevada was 5.9%, which was a substantial enough lead for Obama that Nevada was not in the list of states that were within reach for Romney. We now have the first post-debate poll, and it shows a tied race in the state. This is just one poll out of five, but it causes the five poll average to drop to a 4.1% Obama lead. So once again I list Nevada as just “Lean Obama” and it contributes to Romney’s best case.
Although it is a drop from where the state was before the debate, “Lean Obama” is actually where Nevada has been most of the last year, so to some degree this is reversion to the mean. Obama had a bunch of strong polls in September, but those are now in the rear view mirror, replaced by the worst numbers he has had in the state all year. (It is important to point out that some of these bad numbers were from polls taken BEFORE the debate.)
The five poll average is still buoyed by some strong late September polls. Unless Obama gets a quick bounce back in the next few polls, I expect Obama’s lead in Colorado will diminish further as those polls age off.

In Colorado before the debate Obama was 3.3% ahead in the five poll average. There have now been four polls that ended after the debate and the state flips to a 1.3% Romney lead. This is the first time in the last year that Romney has been in the lead in Colorado according to the five poll average. Unlike Nevada, where the state was down from a spike toward Obama, but had so far only returned to well traveled territory, in this case Romney is breaking new ground. Romney adds what had been a narrow but consistent Obama state to his column.
So, the new summary:
|
Romney |
Obama |
| Romney Best Case |
287 |
251 |
| Current Status |
244 |
294 |
| Obama Best Case |
191 |
347 |
Before any discussion, time to eat some crow. On September 6th I said:
…my gut is saying the beginning of September will have marked Romney’s post-primary high water mark in my models. So write that down. I’m going out on that limb. You can all call me on it when it proves to be completely wrong.
So what is the comparison between now and the beginning of September?
- On September 1st, Romney got 180 electoral votes in Obama’s best case. He now gets 191.
- On September 1st, Romney got 235 electoral votes in the “Current” case. He now gets 244.
- On September 1st, Romney got 317 electoral votes in his own best case. He now gets 287.
Well, OK. I never specified how exactly to judge this, but two out of three of the lines being better than they were seems like it should qualify, especially since one of them is the “current” line. By that mark, Romney is now at the best point he has been since the very beginning of January.
To be fair to myself, from that moment onward, in almost every update, I did mention that there was one way for Romney to come back again, and that was for Obama to majorly screw up. I perhaps stated this most clearly in my update from September 27th, which turned out to be Obama’s peak:
Yes, there could be more bad economic news. Yes, Obama could start making huge mistakes and somehow screw this up. But the magnitude of what would be necessary to reverse this gets larger by the day and the scenarios less likely.
At this point Romney needs Obama to catastrophically implode. That is unlikely.
This is done. Obama wins.
Uh… umm…. unless Obama himself screws it up, or something completely unexpected of epic proportions happens.
Gotta always add the caveats. :-)
If you believe the most hyperventilating reports out there, a catastrophic Obama implosion is indeed what seems to have happened at the first debate. It seems it was not as unlikely as I expected. I presumed both Obama and Romney would put in not great but competent debate performances and the net effect would be essentially zero. Instead we saw a brand new Romney, hitting his stride in a way he never had in the previous year, and an Obama who looked like he didn’t want to be there and was phoning it in at best.
Although Obama peaked before the debate, as each post-debate poll comes in, what a couple of weeks ago seemed like an insurmountable lead for Obama is getting transformed into a genuinely close race. A number of people doing detailed analyses of the polls have pointed out that if you look carefully at the dates on both state and national polls, there is tentative evidence that Romney’s debate bounce may have already peaked and is now starting to recede. So this may be a good time to do another detailed look at where the swing states stand, and what it would take for Romney to win.
First thing to point out… despite the fairly significant drop Obama has seen since his peak… he is still ahead! (For the moment anyway.) Some national polling averages now show Romney ahead in the popular vote, but remember we do not have a national election, we have 51 smaller elections. Looking at the states using my five poll average, here is where we now stand, looking not just at my categories, but also specifically at the magnitude of the candidate leads in the close states.
With only the states where Romney is ahead by more than 5%, Romney gets to 191 electoral votes.
Then we add in the close states where he is ahead:
- North Carolina (15 ev) – Romney leads by 2.9% – 1/5 polls after the debate
- Colorado (9 ev) – Romney leads by 1.3% – 4/5 polls after the debate
- Florida (29 ev) – Romney leads by 0.2% – 2/5 polls after the debate
That gets Romney to 244 electoral votes if he can hold his lead in those three states. You need 269 electoral votes to tie (a situation Romney would probably win in the house) or 270 electoral votes to win outright. So Romney needs 25 more electoral votes to tie, 26 to win. To get there he needs to start pulling ahead in states where Obama is currently ahead.
- Ohio (18 ev) – Obama leads by 0.4% – 5/5 polls after the debate
- Virginia (13 ev) – Obama leads by 1.0% – 4/5 polls after the debate
- Iowa (6 ev) – Obama leads by 3.2% – 1/5 polls after the debate
- Nevada (6 ev) – Obama leads by 4.1% – 1/5 polls after the debate
There are a number of combinations that will get Romney to 270, and any of those four close states could easily flip. They are all close enough that the lead can disappear overnight. With the current state of the polls though, the easiest way for Romney to win seems to be to flip Ohio and Virginia, both of which are now looking exceptionally close. Prior to the debate, Obama had a 7.8% lead in Ohio… now down to 0.4%. That is a massive move in such a short time. Prior to the debate, Obama had a 4.3% lead in Virginia, now down to 1.0%. That’s a smaller move, but not insubstantial. If Romney can move each of those just a LITTLE bit further, then it would put him ahead in my “current” electoral college model for the first time ever.
For almost all of the last year, while Romney’s best case was to win, I’ve been able to repeatedly say that hitting the best case was difficult. Romney would have to almost sweep the close states, and during most of that time, Romney was behind in most of those close states. It was a tall order.
Not so much any more. Romney is still behind. But both Ohio and Virginia are in easy spitting distance. A very slight move in those states, and he pulls ahead. Then if he manages to stay ahead, perhaps even consolidating those leads, then he wins on election day. For the first time since January, this looks like a close race.
The question of course is how long lasting this “debate bounce” is. Can Romney hold onto his gains… and extend them a little further to eke out a narrow win? Or do we start reverting back to where the race has been most of the year? Do we end up back at the “everybody wins the states they are ahead in” line being at Obama 332 to Romney 206 where it has been more often than anywhere else?
The “feel” of the race has certainly changed. Obama was knocked on his heels and is now on defense. At long last, Romney has repositioned himself toward the center, making a play for the voters he needs to win over to win. To win though, he needs to not just hold his gains so far, but pull things a bit further toward him.
If Obama on the other hand can just hold on and prevent any further losses, he wins. If Romney’s bounce recedes (as some say is already happening) then once again Obama wins.
It seems likely that we will indeed see some reversion to the mean, which would favor Obama. But if Obama has another bad debate, or in general if he can’t shift the narrative back in his favor in the next few weeks, he is in big trouble. Romney isn’t in the lead yet according to my classifications… but a few more good polls and he is there. He is close. Really close.
Note: Chart and map from the Abulsme.com 2012 Electoral College Prediction page. Both assume Obama vs Romney with no strong third party candidate and show polling as it currently exists. Things will change before election day. On the map red is Romney, blue is Obama, gold states are too close to call. Lines on the chart represent how many more electoral votes a candidate would have than is needed to tie under several different scenarios. Up is good for Obama, Down is good for Romney.


Chart and map from the Abulsme.com 2012 Electoral College Prediction page. Both assume Obama vs Romney with no strong third party candidate. Both show polling as it currently exists. Things will change before election day. On the map red is Romney, blue is Obama, gold states are too close to call. Lines on the chart represent how many more electoral votes a candidate would have than is needed to tie under several different scenarios. Up is good for Obama, Down is good for Romney.
One state changes status today, and it is once again a move in Romney’s direction:

Colorado has been polled less frequently than one would expect. Since April 11th I have classified it as a “Weak Obama” state as the 5 poll average has been over 5%. It now looks clear that this was mostly on the strength of one PPP poll in April showing an Obama 13 point lead which now very much looks like an outlier. With the most recent polls, Obama’s lead falls back under 5%, so I move it back to “Lean Obama” again and it is now once again considered to be a state that could go either way. This improves Romney’s “best case”.
|
Romney |
Obama |
| Romney Best Case |
278 |
260 |
| Current Status |
206 |
332 |
| Obama Best Case |
159 |
379 |
This move opens up some additional paths to victory for Romney. He can now afford to lose Iowa (6) if he wins the rest of the swing states. Or he can win Iowa (6) and lose Colorado (9) and still tie 269-269 and pull out a win in the House. But Florida (29), Ohio (18), North Carolina (15), Arizona (11), Tennessee (11), Missouri (10), and Wisconsin (10) are all still must win states. If Romney loses any one of them, he loses the election.
And now, as I continue to go through data provided by Darryl at HorsesAss I have another correction to the old historical time series. In this case I was missing an old North Carolina poll from last September. This changed North Carolina’s status at the very beginning of the year from very slightly leaning Obama to very slightly leaning Romney.
The old timeline had been:
- Jan 1 -> Jan 12: Lean Obama
- Jan 12 -> Apr 12: Lean Romney
- Apr 12 -> Apr 14: Lean Obama
- Apr 14 -> May 2: Lean Romney
- May 2 -> May 18: Lean Obama
- May 18 -> Present: Lean Romney
Now it is simply:
- Jan 1 -> Apr 12: Lean Romney
- Apr 12 -> Apr 14: Lean Obama
- Apr 14 -> May 2: Lean Romney
- May 2 -> May 18: Lean Obama
- May 18 -> Present: Lean Romney
This only changes what the status should have been at the very beginning of the year. Current status remains the same. The historical chart is corrected starting with today’s update. It is important to note that regardless of the flips back and forth from leaning one way to leaning the other way, North Carolina has been in the “swing state” status the whole time… it is just plain too close to call and has been the whole time.


Charts from the Abulsme.com 2012 Republican Delegate Count Graphs page. When a candidate gets down to 0%, they have clinched the nomination. If they get above 100%, they have been mathematically eliminated. The first chart is by date, the second is by “% of Delegates Already Allocated”. These numbers include estimates of the eventual results of multi-stage caucus processes which will be refined as the later stages occur.
This is what we have been waiting for seemingly forever. By the beginning of March it was clear that no other candidate than Romney had the ability to get to 1144 absent a miracle. By the beginning of April it was clear that the non-Romney’s also were not going to be able to collectively block Romney absent a miracle. But Romney still needed to actually get to 1144. Slowly but surely he did so through April and May. Today he finally goes over the top. (At least with the count I use, which uses the Green Papers soft count plus the DCW Superdelegate Count. Other counts may differ.)
Since this is “the end” lets include a couple of additional graphs with two other views of the race:


All of these charts show how Romney completely dominated this race from the very beginning. There was NEVER a point in the entire campaign where Romney was not ahead in delegates. It was only even close for a few days after Gingrich won South Carolina. The rest of the time, this whole campaign has just been a story of Romney slowly but surely pulling further and further ahead.
Now lets look specifically at today’s results from Texas.
Prior to today, none of Texas’s 155 delegates had been allocated. As of this update we have Romney 105, Paul 18, Santorum 13, Gingrich 7, Bachmann 2, TBD 10. Yes, that is right, at this late state, Michelle Bachmann mounts a comeback it seems. In any case, an overwhelming Romney win.
Romney also picked up two super delegates from Colorado today.
So net for the day: Romney +107, Paul +18, Santorum +13, Gingrich +7, Bachmann +2. Romney gets 72.8% of the delegates awarded today. This is way more than the 12.9% of the remaining delegates he needed to be on track to get to 1144 before “the end”. This was actually enough to push him over the edge.
My count now has the totals as: Romney 1159, Santorum 268, Gingrich 150, Paul 143, Bachmann 2
Now, by the Green Papers “hard count” that only counts delegates that are officially bound to Romney and theoretically have no discretion or ability to change their mind, we have Romney 1012, Santorum 245, Gingrich 143, Paul 93, Bachman 2, Huntsman 2… so by that count Romney still has a little bit further to go. The soft count also includes estimates for how delegates with discretion will vote and for how the remaining processes that are not yet final will play out. I also add in the super delegates who have publicly stated a preference. This is all reasonable. So I feel confident having using the count we have used all along, and considering Romney to have gotten to the 1144 magic number as of today.
Since we are hitting this major milestone today, I’ll take advantage of this time to highlight the comparisons with the 2008 races. More comparisons with 2008 can be found here.
First, to make comparisons easier, the 2012 race on a full 0%-100% scale:

Then what the equivalent graph looked like in 2008:

Looking at these two, in 2008 McCain had two non-trivial opponents compared to the 3 Romney had this time. In 2008, McCain pulled away from the other candidates starting around the 10% mark. In 2012 Romney was ahead from the very beginning. By the the 5% of delegates awarded mark (after Florida), Romney opened up the gap and none of the others ever came close again. Both Romney and McCain got to the “40% of remaining needed to win” mark at almost exactly the point where 50% of the delegates had been awarded. These two years look pretty similar.
Another view comparing Romney 2012 to McCain 2008 looks at % of total delegates earned by the eventual winner vs % of total delegates allocated. This was originally prompted by a post at Enik Rising. Looking at both candidates on the same chart we see this:

Despite all the talk at various points in time about Romney having problems closing the deal by comparison to 2008, this shows clearly that no such thing was happening. Any perception to that effect was due only to the fact that the calendar was more spread out this year than in 2008. Comparing the two curves, sometimes Romney was ahead, sometimes McCain was ahead, but for the most part these two lines tracked each other closely.
Finally, just for completeness, here is what an actually close race looks like on the “% of remaining delegates needed to win” chart… specifically, the Democrats in 2008:

With that, we wrap up the regular coverage of the Republican delegate race for 2012. There may be additional updates for specific milestones… if Paul manages to pass Gingrich in the delegate count… the final totals once all the state delegate selection processes are actually over… or the final roll call count at the convention… but as for regular updates this is it.
Thanks for everybody who has been reading and enjoying these updates over the last five months.
From here on out, it is all about the Electoral College…
Edit 2012 Jun 5 12:49 UTC: Fixed affect/effect typo.
|
|


