This is the website of Abulsme Noibatno Itramne (also known as Sam Minter).
Posts here are rare these days. For current stuff, follow me on Mastodon
|
Once again the headline out of a state is Trump winning. In Nevada the delegate count was:
14 Trump, 7 Rubio, 6 Cruz, 2 Carson, 1 Kasich
To be on the glide path for a 1st ballot victory though, Trump needed 15 of the 30 delegates. So he fell slightly short.
Now, don’t misunderstand. This is still an impressive victory, and looking at the upcoming states he has a clearer path to victory than anybody else. His margins were higher in Nevada than many people expected. But if today’s performance was replicated in all of the other states, Trump would come to the convention with more delegates than anybody else, but not the majority needed to win outright. Of course as we continue more people will drop out, and the amount with which states give bonuses to the winners increases, so that still seems like an unlikely final outcome.
Right now Trump continues to do everything he needs to do to win. Lets look at some of the graphs, then we’ll do a quick look at the March 1st “Super Tuesday” states.
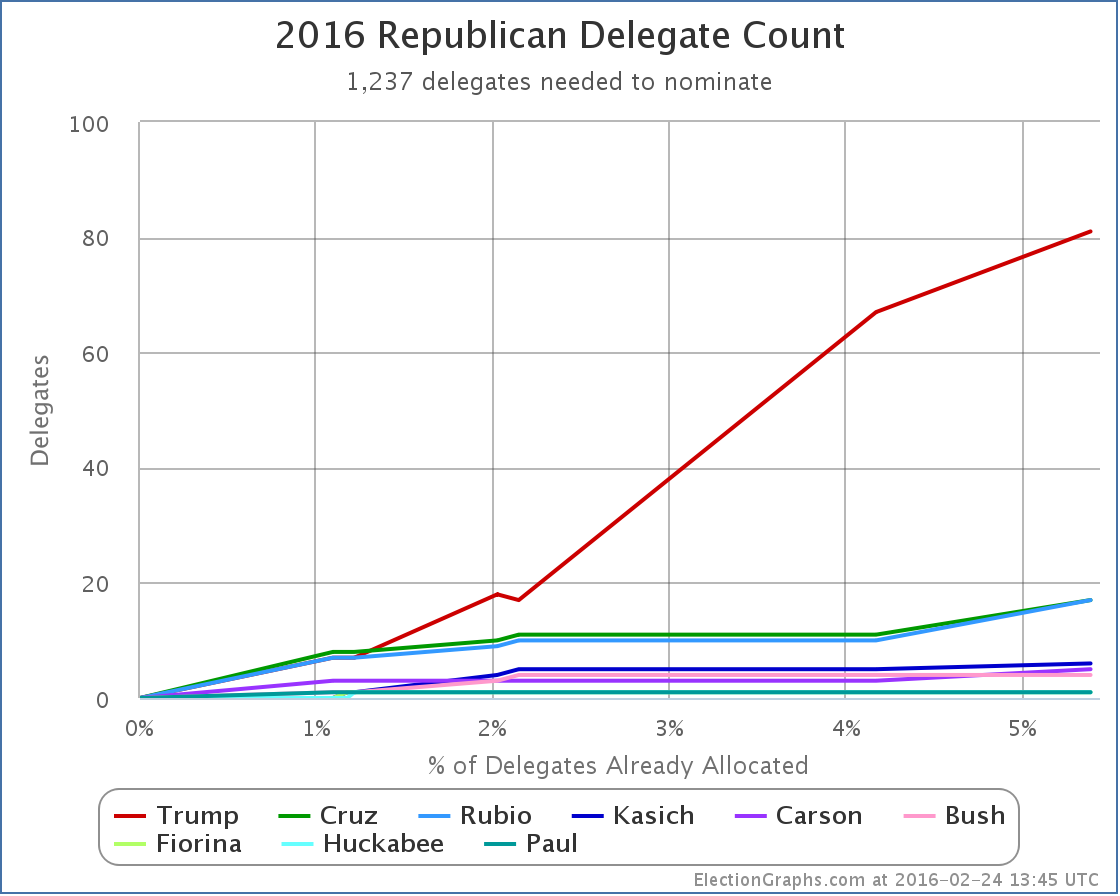
The overall delegate count is now:
81 Trump, 17 Cruz, 17 Rubio, 6 Kasich, 5 Carson, and 7 for people who have dropped out
Trump continues to dominate. Lets look at this as percentages:
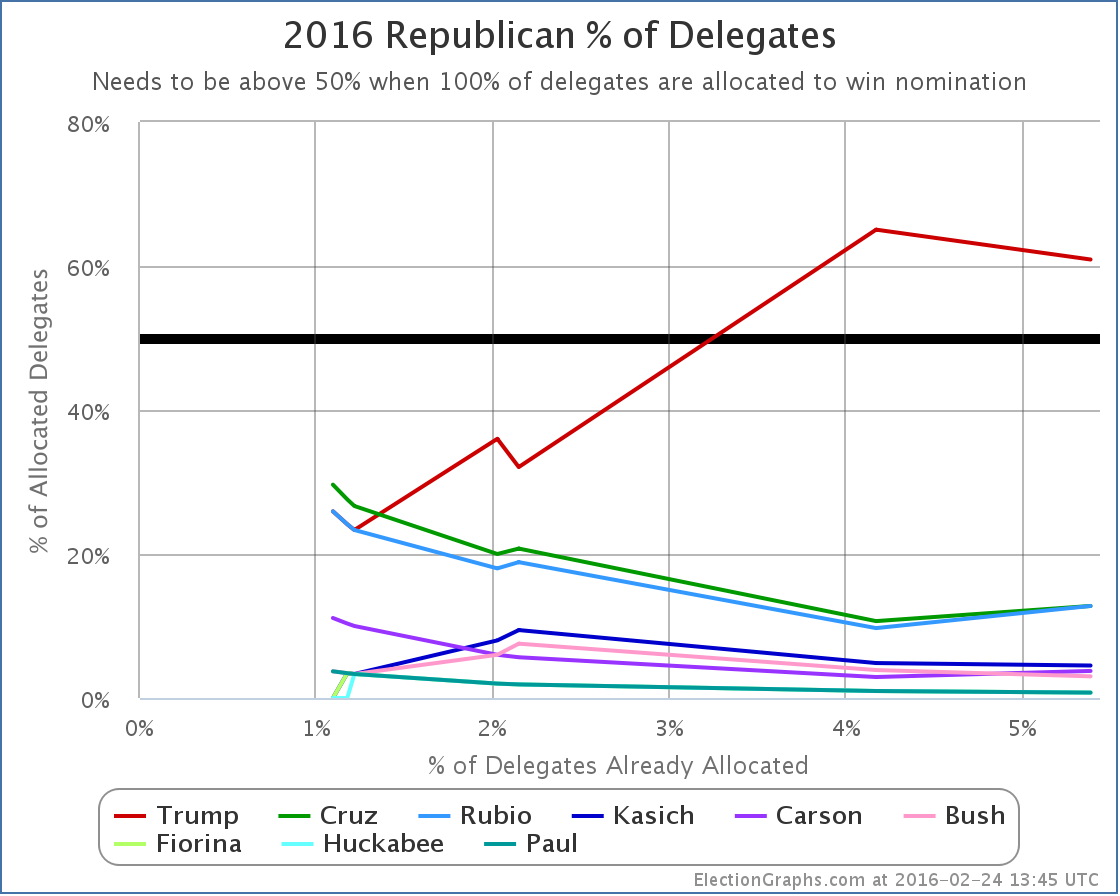
The “winners” here were actually Cruz, Rubio and Carson. Each of them improved their proportion of delegates with Nevada’s results. Trump actually went down. He doesn’t have to worry too much about that though. He still has a majority of the delegates allocated so far, and he is far far ahead of any of his opponents.
Finally, lets look at the “% of remaining delegates needed to win”, which I argue is the single most important thing to look at to understand where the race really is:
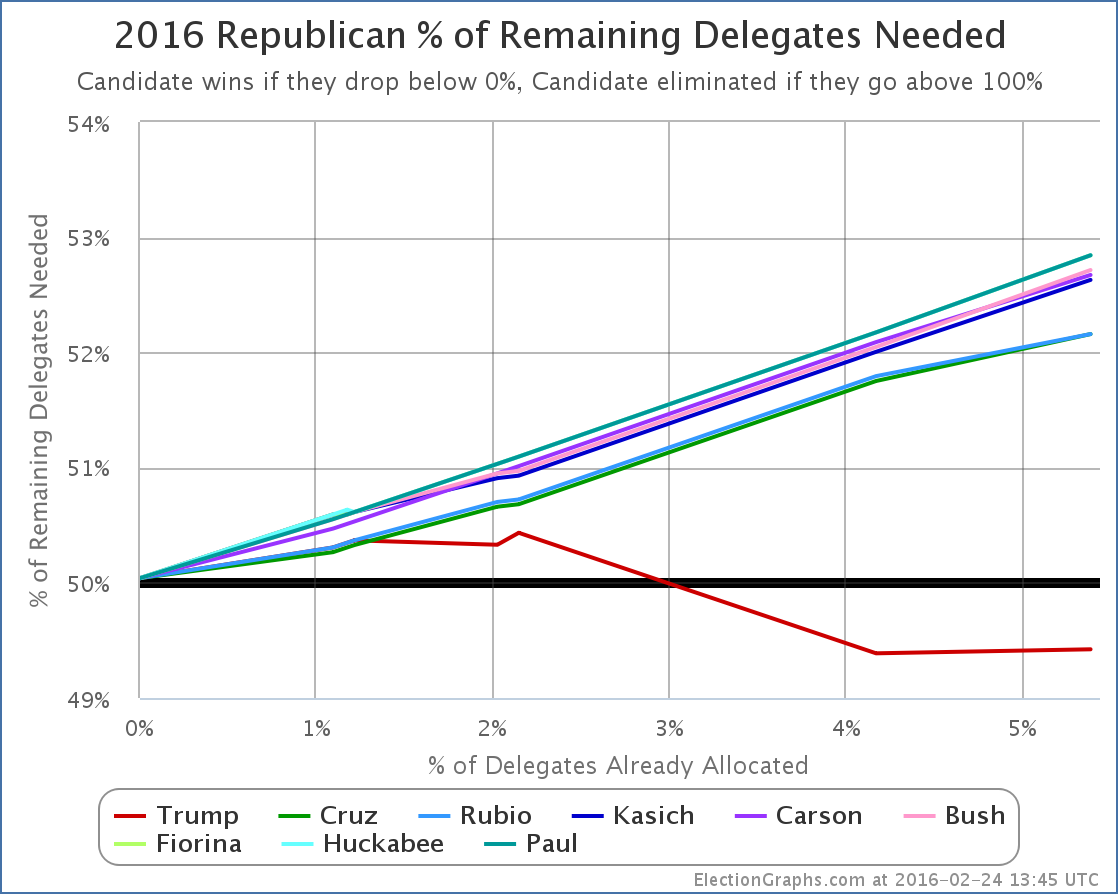
Because Trump got 14 delegates instead of 15 delegates, his line goes up a little bit. (Remember, on this chart down is good, up is bad.) The red line goes from needing 49.39% of the remaining delegates to needing 49.42%. This is a relatively trivial difference though. It is basically flat. Trump’s situation is very close to unchanged.
Meanwhile, the other lines keep going up at a decent pace. Kasich and Carson add about 0.6% to their numbers. Cruz and Rubio add about 0.4%.
This should be obvious, but the more they lose, the harder it is to catch up.
Many people are still talking about how as consolidation happens, the remaining non-Trumps will do better and the picture will change. Maybe, but nobody new announced they were dropping out after the Nevada results (yet anyway). So it looks like we may still go into March 1st with a five person race.
Lets run a hypothetical using current polling on the Super Tuesday states and see where we end up using RCP poll averages for the five remaining candidates. We’ll make delegate estimates based on the specific delegate allocation rules in each state.
Texas (155 delegates)
- Current poll averages: 37.3% Cruz, 28.0% Trump, 11.7% Rubio, 4.7% Carson, 3.0% Kasich
- Delegate estimates: 99 Cruz, 56 Trump
Georgia (76 delegates)
- Current poll averages: 35.0% Trump, 22.7% Cruz, 19.3% Rubio, 7.3% Carson, 6.3% Kasich
- Delegate estimates: 50 Trump, 26 Cruz
Tennessee (58 delegates)
- Last poll from November so using national average: 33.6% Trump, 20.4% Cruz, 16.4% Rubio, 9.8% Kasich, 7.4% Carson
- Delegate estimates: 37 Trump, 21 Cruz
Alabama (50 delegates)
- Last poll from December so using national average: 33.6% Trump, 20.4% Cruz, 16.4% Rubio, 9.8% Kasich, 7.4% Carson
- Delegate estimates: 32 Trump, 18 Cruz
Virginia (49 delegates)
- Using only February poll: 28% Trump, 22% Rubio, 19% Cruz, 7% Kasich, 7% Carson
- Delegate estimates: 17 Trump, 13 Rubio, 11 Cruz, 4 Kasich, 4 Carson
Oklahoma (43 delegates)
- Using only February poll: 32.5% Trump, 25.0% Cruz, 15.5% Rubio, 7.0% Carson, 0.0% Kasich
- Delegate estimates: 17 Trump, 15 Cruz, 11 Rubio
Massachusetts (42 delegates)
- Current poll averages: 41.0% Trump, 17.0% Rubio, 10.0% Cruz, 7.5% Kasich, 3.5% Carson
- Delegate estimates: 23 Trump, 9 Rubio, 6 Cruz, 4 Kasich
Arkansas (40 delegates)
- Using only February poll: 27% Cruz, 23% Trump, 23% Rubio, 11% Carson, 4% Kasich
- Delegate estimates: 18 Cruz, 13 Rubio, 9 Trump (giving Rubio the 2nd place finish breaking 23% tie by alphabetical order)
Minnesota (38 delegates)
- Last poll from January so using national average: 33.6% Trump, 20.4% Cruz, 16.4% Rubio, 9.8% Kasich, 7.4% Carson
- Delegate estimates: 18 Trump, 11 Cruz, 9 Rubio
Wyoming (29 delegates)
- No polls at all, using national average: 33.6% Trump, 20.4% Cruz, 16.4% Rubio, 9.8% Kasich, 7.4% Carson
- Delegate estimates: 12 Trump, 7 Cruz, 5 Rubio, 3 Kasich, 2 Carson
Alaska (28 delegates)
- Last poll from January so using national average: 33.6% Trump, 20.4% Cruz, 16.4% Rubio, 9.8% Kasich, 7.4% Carson
- Delegate estimates: 13 Trump, 8 Cruz, 7 Rubio
Vermont (16 delegates)
- No polls at all, using national average: 33.6% Trump, 20.4% Cruz, 16.4% Rubio, 9.8% Kasich, 7.4% Carson
- Delegate estimates: 10 Trump, 6 Cruz
OK, that’s it. Adding all that up…
Estimated Super Tuesday delegate totals: 294 Trump, 246 Cruz, 67 Rubio, 11 Kasich, 6 Carson
That gives Trump 47.1% of the super Tuesday delegates, Cruz 39.4%, and everyone else much less.
Trump needs 49.4% of the delegates to be on the path to an outright win though! So 47.1% would be in the realm where heading to a contested convention might be possible! Still unlikely, as the additional states in March will add up fast, and more candidates are likely to drop out. Still though, possible!
Adding in the existing delegates, we’d have a post-Super Tuesday race that looks like this:
375 Trump, 263 Cruz, 84 Rubio, 17 Kasich, 11 Carson, 7 for candidates who have already dropped out
Now, these are estimates based on current polling, and very few of these states were well polled as of this post, so much of the above is based on one or two polls, or using the national averages rather than state polls. And I had to make the assumption that all congressional districts would mirror state results (which is unlikely to be true). And Wyoming actually elects individual delegates rather than doing things based on candidate preference, so it may be an oddball in the end. And of course things are likely to change further before people actually vote next Tuesday. But… the general outlines of this aren’t likely to be too far off.
If this is even remotely close to where we are on March 2nd, we end up with Trump very close to the 50% of delegate mark. (The above has him EXACTLY at that mark.) He would need just a LITTLE bit more to actually push him over the edge to a clean win.
The flip side of that though is the combination of all the anti-Trumps would need just a LITTLE bit more in order to have this be on the path to a contested convention. I mentioned earlier that this is still an unlikely outcome. It is. After March 1st, the disproportionality of delegates given to the winner increases, and after March 15th we have pure winner take all states as well. If Trump remains in the overall lead, even with a plurality, then that is all it takes to push him over the edge.
If the anti-Trumps want to have any hope here at all, they need to be in a position by mid-March that they can win not just a few, but many states of the winner-take-most and winner-take-all variety. And frankly, the most likely scenario even then is just forcing a contested convention where Trump still has the most delegates, not someone else winning outright.
The anti-Trumps would have a hard road to get to an outright win. Cruz would need 56.8% of the remaining delegates to catch up and win after March 1st if things played out like my estimates above.
If you had to make a guess based on what we know now, a Trump nomination is far more likely than any other… and with an outright delegate majority on the first ballot, not after a contested convention.
6 days until Super Tuesday. We’ll see how close my estimates above turn out to be.
Update 2016-02-26 07:17 UTC – On February 22nd New Hampshire certified the results of their primary. In the final tally Trump had one more delegate than previous estimates, and Rubio one less. This did not seem worthy of a separate post, but a note here seemed appropriate. The totals on ElectionGraphs.com have been updates appropriately. This does not substantively change any of the analysis above.
Note: This post is an update based on the data on ElectionGraphs.com. Election Graphs tracks both a poll based estimate of the Electoral College and a numbers based look at the Delegate Races. All of the charts and graphs seen in this post are from that site. Additional graphs, charts and raw data can be found there. All charts above are clickable to go to the current version of the detail page the chart is from, which may contain more up to date information than the snapshots on this page, which were current as of the time of this post. Follow @ElectionGraphs on Twitter or like Election Graphs on Facebook to see announcements of updates or to join the conversation. For those interested in individual general election poll updates, follow @ElecCollPolls on Twitter for all the polls as they are added.
[Edit 16:28 UTC to correct math on % of remaining Cruz would need after Super Tuesday, I’d originally shown a higher number around 61%.]
[Edit 2016-02-27 17:06 UTC to fix place where Kasich had been autocorrected to Quash.]
[Edit 2016-02-28 22:03 UTC to add dropped out candidates to the after Super Tuesday estimate.]


|
Romney |
Obama |
| Romney Best Case |
310 |
228 |
| Current Status |
206 |
332 |
| Obama Best Case |
190 |
348 |
There were no states called between 00:45 UTC and 01:00 UTC so there was no 01:00 update.
But there were tons of states called between 01:00 and 01:15 though.
- Obama: CT, DE, DC, IL, MD, MA, ME-All, ME-1, RI
- Romney: OK, GA
I also corrected the light blue line in the chart, which I’d neglected to decrement when Romney won South Carolina. That line represents the states where Romney was ahead by more than 5%, but less than 10%.
The three scenarios remain the same though, as no close states have been called. In 2008, since McCain’s best case was still to lose, I also tracked a “McCain SuperBest” case on election night, the case where he would have won all the states he was behind by less than 10% in. That was to keep it interesting in a race that wasn’t close. No need for that this time.
This time we wait for the states that are actually close.

As election day approaches, the number of polls coming in each day has increased dramatically, and that means some states will be jiggling just from the higher volume of polling, although some of it may represent actual movement too.
Today according to the five poll average, five states change categories today, and they all move toward the center, toward being more competitive. But when we look at them, it turns out none of these (with one possible exception) look like they will be in a position to make any difference in this race. Let’s take a look at each of them anyway:

Missouri had been trending further toward Romney, but the last poll looks like Obama may be gaining a bit of support there. It doesn’t matter though, Romney is going to win Missouri.

Wisconsin had bounced up to over a 5% Obama lead. It now falls below that level to a 4.5% Obama lead. This is close enough that I once again classify Wisconsin as “Lean Obama” and therefore a state that Romney could win. But of all the close states, this is the one with the second largest Obama lead. There are many closer states that are better Romney targets as he tries to claw his way to 270.

Ever since Thursday I have been mentioning the big ugly outlier in Virginia. Well, today it finally rolls off the five poll average. With this the average drops to a 3.6% Obama lead. Virginia would never have left the “close state” category without the outlier, but even without the outlier, Obama has been making gains in Virginia. A week ago all the polling indicated a tied race in Virginia. No longer. It is still close, but now Obama has a clear lead.
Of the states changing status today, Virginia is currently the closest, and it is also the only one with a history of actually being very close. At the moment, Virginia isn’t close enough compared to the other close states to actually be part of Romney’s “easiest path to victory” which I’ll cover later in the post, but given the history of polling in the state, it could easily get closer again before we are done, so it still has a chance of making a difference in the race if Romney can win it.
This state is “getting closer” only because the outlier is rolling off the average though. Without the outlier, the trend is actually toward Obama in Virginia. Virginia seems to be slipping away from Romney.

I am showing a chart since August to show a bit more context for Georgia. The five poll average moved to a greater than 10% lead for Romney due to what is a clear outlier in September. Polling has been sparse in Georgia, because it hasn’t been in contention this cycle, so that outlier only rolled off the average today. I now have Romney with a 7.5% lead in Georgia.
So this “gain” for Obama doesn’t matter. Romney will be winning in Georgia.

Michigan has been hovering right around the 5% Obama lead mark for the last month or so. Usually Obama’s lead is slightly more, with today’s update it is slightly less… 4.7%. This is due to one recent poll that actually shows Romney ahead in Michigan! This is out of line with all other recent polling, but as usual, I do not manually remove outliers, I let the averages do their thing. (Although I keep thinking that maybe in 2016 I should use a median, which is less sensitive to these things.)
Anyway, at 4.7%, Michigan has the biggest Obama lead of any of the current crop of “close states”. Like Wisconsin, this means that there are a lot of other states that would be easier for Romney to take the lead in that Michigan. If Romney actually pulls ahead in Michigan, this means it is very likely that he has already pulled ahead in all of the other close states… at which point he would not only have won, but be heading for a pretty comfortable victory.
So while it might be a bit closer than it was (maybe), Michigan is still quite unlikely to end up flipping to Romney, or to be one of the critical states in the last days.
This brings us to the new map and summary:

|
Romney |
Obama |
| Romney Best Case |
338 |
200 |
| Current Status |
206 |
332 |
| Obama Best Case |
190 |
348 |
Romney’s best case now actually is the best it has been ALL YEAR LONG, exceeding his best case at the peak after the 1st presidential debate. In a sense, this does represent a Romney comeback in the last few days. He *is* making a bunch of states closer. He has taken a bunch of states where Obama had been ahead by more than 5%, and pulled them back so they are somewhat close. This may help him in the popular vote, but in the electoral college, it doesn’t look like he has moved any of these states ENOUGH. He may be making states closer, but he is NOT pulling them over the line to him.
Meanwhile, while Obama hasn’t been pulling ahead by more than 5% in more states, and he hasn’t managed to pull any more states to his side either, he actually has been increasing his lead in some of the most critical states.
Time to take a look in more detail by comparing the five poll average now to the five poll average 7 days ago:
- Nebraska 2nd (1): 3.8% Romney lead a week ago, 3.8% Romney lead now (no change)
- North Carolina (15): 2.4% Romney lead a week ago, 2.4% Romney lead now (no change)
- Colorado (9): 2.8% Obama lead a week ago, 0.4% Obama lead now (2.4% move toward Romney)
- Florida (29): 0.8% Romney lead a week ago, 1.1% Obama lead now (0.3% move toward Obama)
- New Hampshire (4): 1.0% Obama lead a week ago, 2.6% Obama lead now (1.6% move toward Obama)
- Ohio (18): 2.0% Obama lead a week ago, 3.4% Obama lead now (1.4% move toward Obama)
- Iowa (6): 1.2% Obama lead a week ago, 3.4% Obama lead now (1.2% move toward Obama)
- Virginia (13): 0.4% Obama lead a week ago, 3.6% Obama lead now (3.4% move toward Obama)
- Pennsylvania (20): 4.6% Obama lead a week ago, 3.8% Obama lead now (0.8% move toward Romney)
- Maine 2nd (1): 6.1% Obama lead a week ago, 4.2% Obama lead now (1.9% move toward Romney)
- Nevada (6): 2.8% Obama lead a week ago, 4.2% Obama lead now (1.4% move toward Obama)
- Wisconsin (10): 3.8% Obama lead a week ago, 4.5% Obama lead now (0.7% move toward Obama)
- Michigan (16): 6.5% Obama lead a week ago, 4.7% Obama lead now (1.8% move toward Romney)
That is a lot of close states! But what can be seen here? Out of 13 close areas, only FOUR moved toward Romney in the last week. Colorado, Pennsylvania, Maine’s 2nd congressional district, and Michigan. Of these only Colorado is in Romney’s easiest path to victory. I listed the states above in order by the level of Romney support from highest to lowest.
That means the states he NEEDS to be improving in the most in order to win are Colorado, Florida, New Hampshire, Ohio and Iowa. Looks like Colorado is almost tied now, so I guess whatever Romney is doing there is working and is time well spent. But the rest of these critical states are moving the wrong direction for Romney.
There has been speculation that Romney is trying to do a “hail mary” of some sort, trying to actually win Pennsylvania and Michigan as an alternate path to victory. The states he is ahead in, plus Florida, Colorado, Pennsylvania and then Michigan is certainly another path to victory. But given Obama’s current leads in those states, going through New Hampshire, Ohio and Iowa certainly seems like an easier path than Pennsylvania and Michigan. Perhaps Romney’s internal polling shows Obama’s support is “softer” in these states though.
For the most part though, this looks like effort put into the wrong places, while Obama consolidates his leads in the states more likely to be the tipping point. And that is the cue for today’s tipping point graph:

The Virginia outlier is gone, so now the chart can be interpreted directly. (I’ve removed the little x’s showing what things would have looked like if I had manually removed the outlier.) Iowa is now the tipping point state, and Obama is ahead by 3.4% in Iowa. There was a dip in the past few days (which was slightly more without the Virginia outlier) but Obama’s popped up again. If Romney manages to move the polls in all the close states by at least 3.4%, he can win. But that is a tall order at this point. A very tall order.
As I type there are 48 hours and a few minutes left until the first polls start closing on election night. 3.4% is a huge move in such a short time. Something incredibly dramatic would have to happen to move opinion that much in the final moments.
Romney’s only real hope at this point is that all the polls are wrong.
Absent that, Obama wins a second term.
Note: Chart and map from the Abulsme.com 2012 Electoral College Prediction page. Both assume Obama vs Romney with no strong third party candidate and show polling as it currently exists. Things will change before election day. On the map red is Romney, blue is Obama, gold states are too close to call. Lines on the chart represent how many more electoral votes a candidate would have than is needed to tie under several different scenarios. Up is good for Obama, Down is good for Romney.


Three states move between my categories today. One moves toward Romney, two move toward Obama. That sounds like a mixed day, but on balance the benefit goes to Obama. As usual, lets look at the states in order by electoral college weight, but now I’ll zoom in to only show 3 months of polls rather than a year since we are getting close to the end (under three weeks!) and polls are coming in so quickly…

First up, Colorado. According to the five poll average, the state went from an Obama lead of 4.9% on September 23rd, down to a Romney lead of 1.3% on October 8th. With today’s update, Obama takes a very slim 0.5% lead again. This is essentially a tie, but with this the state tips ever so slightly back onto the Obama side of the ledger.

Georgia is Romney’s one piece of good news for the day, but there are a bunch of caveats.
Romney’s lead in Georgia hits 10%, so we move it to the “Strong Romney” category. But this is largely due to one poll from September that looks like an outlier, so absent other movement backing up that poll, Georgia is likely to revert back to “Weak Romney” once that poll ages off. If we even have enough more polls in Georgia before the election to do that. It has been pretty sparsely polled.
More to the point though, it doesn’t really matter if Romney’s lead in Georgia is just under 10% or just over 10%. Either way, Georgia is a Romney state, and there is no realistic scenario where Obama wins Georgia. Georgia is safe for Romney. So while winning by a bit larger margin may be “nice” for Romney, it doesn’t actually help him at all in the contest with Obama.

Obama’s lead in Michigan topped out at 9.7% on September 20th. It declined to a 4.0% lead on October 8th. It has now popped back up to 6.1%. It seems that the post-debate movement toward Romney was relatively short lived. In the last three months the degree of Obama’s lead in Michigan has bounced around quite a bit. It has however always been a lead. A few isolated polls aside, Romney has never held the lead in the five poll average in Michigan. For awhile there it looked like Michigan was close. Not so much any more.
All of this leads us to the new summary:
|
Romney |
Obama |
| Romney Best Case |
301 |
237 |
| Current Status |
248 |
290 |
| Obama Best Case |
191 |
347 |
Since Georgia doesn’t affect any of these three situations, what we see here is basically just Obama strengthening again. Some of the gains Romney had made in the last couple of weeks are just slipping back away from him. Yesterday Obama’s lead in Pennsylvania once again became substantial enough to not call it a close state. Today the same happens to Michigan. And Obama retakes the lead in Colorado.
It certainly looks like Romney peaked between August 12th and August 15th and things are now heading back in Obama’s direction, without Romney ever actually taking the lead in the electoral college model. If initial reactions to the second debate are any indication, at the very least we should expect no further downward plummeting by Obama, and perhaps even more additional upside for Obama beyond that.
Caution needs to be urged in interpreting this though. Only a small number of states have moved so far, and just barely over the respective category lines. More polls could easily reverse the recent changes. If these initial trends continue over the next few days though, we’ll get a very solid picture.
None of the polls included so far include the time period after the second debate. That will of course be the next thing to watch for. Will there be big noticeable effects from the second debate as there were after the first one?
Of course to win, Romney needs to do more than just hold on to his previous gains. He actually needs to bring even more states over to his side in order to win. If he couldnt’ do it last week, then what exactly can he do now to make it happen?
At the moment Obama’s lead is still very narrow. Romney has many potential ways to win. It is still a close race. But the movement seems to be shifting toward Obama again.
Note: Chart and map from the Abulsme.com 2012 Electoral College Prediction page. Both assume Obama vs Romney with no strong third party candidate and show polling as it currently exists. Things will change before election day. On the map red is Romney, blue is Obama, gold states are too close to call. Lines on the chart represent how many more electoral votes a candidate would have than is needed to tie under several different scenarios. Up is good for Obama, Down is good for Romney.


Chart and map from the Abulsme.com 2012 Electoral College Prediction page. Both assume Obama vs Romney with no strong third party candidate and show polling as it currently exists. Things will change before election day. On the map red is Romney, blue is Obama, gold states are too close to call. Lines on the chart represent how many more electoral votes a candidate would have than is needed to tie under several different scenarios. Up is good for Obama, Down is good for Romney.
Four states change categories today. In all four cases, the races look a little closer than they did. The impact is different in these cases, so lets look at each one. In order from the smallest number of electoral votes to the greatest…

South Dakota (3 ev): South Dakota has been very sparsely polled. The poll added today is only the 3rd one in the last year and only the 4th since the 2008 election. With this update the 5 poll average (which includes the 2008 election to fill out the average) drops to a Romney lead of 9.9%. This is less than the 10% threshold I use, so I move the state from “Strong Romney” to “Weak Romney”. But obviously South Dakota is nowhere close to being a competitive state. It would take a move of epic proportions to actually make South Dakota a competitive state. But the three polls this year do seem to show that Romney’s lead is a bit less than it once was.

Virginia (13 ev): Obama’s lead in the five poll average had touched 5%, moving it out of the close state category, but it didn’t last. The latest poll added to the average brings Obama’s lead back down to 4.3%. This means Virginia is once again one of the states I consider close enough that it could easily go either way depending on the events of the campaign. This will improve Romney’s “Best Case” in my models. Virginia has been close for most of the last year so it is not surprising to see it here again.

Georgia (16 ev): With two new polls added today, Romney’s lead in Georgia drops to 9.5%. Since this is below 10%, we move the state to “Weak Romney”. As with South Dakota, this is still a pretty substantial lead, and absent a major Romney collapse, it is unlikely to see Georgia actually become a competitive close state. But it is once again in the category where perhaps Romney shouldn’t take it completely for granted. Well, OK, he mostly can. But his margins do look a little bit less than they did before.

Ohio (18 ev): Along with Virginia, this is the other one that “matters” to the model. In my August 1st update the 5 poll average in Ohio jumped to 5.5%, moving it out of my swing state category. In today’s update we add a new poll… actually one that ended back on July 24th, prior to the last poll included in my last update, but which I just found (via Darryl at HorsesAss) so it counts for today*… and that new poll pulls Obama’s lead back down to 4.1%. So after the brief interlude as a blue state, Ohio is once again where it has been most of the year… with an Obama advantage, but not a huge one. So it is easy to imagine scenarios where Romney pulls it back over onto his side of the fence.
When you add up the changes in these four states, what do you get?
Well, South Dakota and Georgia really don’t change anything. For those two states, it isn’t about who will win, it is just about how much Romney will win by… which really doesn’t matter.
Virginia and Ohio on the other hand… they matter, and they are pretty big states. With both of these states on the table again, Romney’s best case improves considerably:
|
Romney |
Obama |
| Romney Best Case |
291 |
247 |
| Current Status |
206 |
332 |
| Obama Best Case |
180 |
358 |
With this new configuration, Florida (29 ev) is a must win state. Romney can’t win without it. He could lose any one of Ohio (18 ev), North Carolina (15 ev), Virginia (13 ev) or Tennessee (11 ev), but only one of them. Colorado (9 ev), Iowa (6 ev), Nevada (6 ev) and New Hampshire are more flexible. There are a number of different “paths to victory” here now.
Now, most of these states (all but North Carolina and Tennessee) are ones where Obama has the lead at the moment, even if it is a small lead. To actually win, Romney has to actually start pulling ahead in some of these states rather than just reducing Obama’s lead.
That may be next. With a VP announcement “any time now” and the Republican Convention just around the corner, movement toward Romney should probably be expected. The questions will be: “How much movement?” and “Does it last?”.
(Spoilers: Convention bounces usually last about a week before things revert to where they were before, and VP choices only rarely end up making a difference.)
* If there is anybody who cares about the details and wonders why I didn’t do a retroactive adjustment of the historical graphs because I included an older poll that changed things, here is a long geeky explanation of my process: Basically, if you judge by the “end date” of the polls, polls come in out of order all the time. It takes pollsters a few days to compile and release their data, then sometimes it take a bit before it shows up on one of the three sources I use to collect poll data. If a new poll is within the “Last 5”, then I just treat it as current new data, regardless of the end date on the poll and if it is really the most recent to end. In this case, the poll wasn’t the newest, but it was the second newest. The last two polls had just gotten to me in reverse order, which happens pretty frequently. It is a little unusual that by the time I included it, the poll end date was about two weeks old, but it was still the second most recent poll. So it just got folded into the average normally. If I become aware of polls that are older than the Last 5, and those polls would have changed the category of any states, then I’ll fold a correction into my next update. Also while I’m giving esoteric details… The historical electoral college trend lines are based on the date new polls are included in my model (except when polls older than the most recent 5 are added), while the state polling trend chart uses the end date of the polls, which means they don’t always match exactly. So, for instance, the peak over 5% in Ohio has indeed disappeared with this new poll, instead now only peaking at 4.9%. The end dates of the polls are also used to determine just which polls are in the “Last 5” to begin with. In the case of multiple polls with the same end date, the tie breaker is the time they were added to my model.
Edit: 2012 Aug 8 08:15 to add that last parenthetical.
Edit: 2012 Aug 8 16:31 to add * note.
Edit: 2012 Aug 8 17:50 to correct one detail on the * note.


Chart and map from the Abulsme.com 2012 Electoral College Prediction page. Both assume Obama vs Romney with no strong third party candidate. Both show polling as it currently exists. Things will change before election day. On the map red is Romney, blue is Obama, gold states are too close to call. Lines on the chart represent how many more electoral votes a candidate would have than is needed to tie under several different scenarios. Up is good for Obama, Down is good for Romney.
Two states change status today. One moving toward Romney, one moving toward Obama:

First up, Georgia with its 16 electoral votes. Like Texas a couple days ago, Georgia is one of those states that nobody thinks will be a swing state, but some polling was showing it closer than one might expect, leading one to think that Romney might have wanted to spend at least a little time and money on shoring it up. The latest polls though have Romney’s lead there in my five poll average going over 10%. This moves it into the “Strong Romney” category which generally are quite safe for Romney and therefore can effectively be ignored in the campaign. These moves from Weak to Strong don’t change the range of outcomes in my model, but they do show Romney’s consolidation of his base states.

Second we have Arizona. This has been bouncing back and forth, over and under the Romney 5% lead line in the five poll average. With today’s update, the 5 poll average drops below 5% again, so we once again classify it as a Lean Romney Swing State. Now, the five poll average in Arizona has never shown Obama actually ahead in Arizona (although a couple individual polls in the last year have), so Arizona is not as swingy as, say, Florida or North Carolina, where the actual lead keeps changing hands. But it is close enough that the lead could be wiped out in a few days depending on the news cycle. So, for the moment, Arizona swings again.
In terms of our summary, since Georgia was never considered a real Obama possibility, only Arizona causes a change, improving Obama’s best case by 11 electoral votes:
|
Romney |
Obama |
| Romney Best Case |
282 |
256 |
| Current Status |
235 |
303 |
| Obama Best Case |
159 |
379 |
Note 2012 Jun 8 15:00 UTC: A correction noted June 8th moved a Tennessee change from “Weak Romney” to “Lean Romney” from March 2nd to May 24th, which would have been the day before this post. Updates between March 2nd and this post therefore incorrectly classified Tennessee.

Chart from the Abulsme.com 2012 Republican Delegate Count Graphs page. When a candidate gets down to 0%, they have cinched the nomination. If they get up past 100%, they have been mathematically eliminated. Note that these numbers include estimates of the eventual results of multi-stage caucus processes which will be refined as the later stages occur.
A minor update from Georgia today. My primary source, Green Papers, previously had the results from Georgia as Gingrich 54, Romney 19, Santorum 3. This has now been updated to Gingrich 52, Romney 21, Santorum 3.
So the net for the day is Romney +2, Gingrich -2.
So Romney’s “% of remaining needed to win” drops from 48.7% to 48.5%. (And Gingrich’s rises from 75.9% to 76.1%.)
This is a minor change that does not change the state of the race significantly. But since there is an update today, it gives me a chance to modify something I said in the last update based on new information. I had said:
Next up is Illinois. Romney is ahead in the polls in Illinois, but isn’t over 48.7% in those polls, and of course nobody else is close to the numbers above either. The contest there is a “Loophole Primary” which is a bit odd, but if the delegate results are even close to being proportional to the popular vote result, then we can expect Illinois to be another of the “everybody loses” states where nobody actually gets closer to the nomination in terms of being on pace to win.
Well. two things.
First, recent polls have been moving in Romney’s direction over the last week. The most recent poll as of this writing was a poll from PPP (pdf) that has Romney at 45%. Now, polls predict popular vote, not delegates, and the 48.5% Romney needs is a percentage of delegates, not a percentage of the popular vote. But assuming at least some correlation between popular vote and delegates, those numbers are getting pretty close to each other. Which brings us to…
Second, Santorum failed to properly file for delegate slates in some parts of the state. This means that Santorum’s delegate take will almost certainly underperform his performance in the popular vote. This implies that Romney’s delegate take may well overperform his popular vote number.
With these two factors together, Romney’s chances of getting to the 48.5% he needs to improve his “% of remaining” number and move closer to the nomination and further away from the scenarios where he doesn’t get to 1144 is much more likely than it looked previously.
By this time tomorrow, we should know how that turned out.

Chart from the Abulsme.com 2012 Republican Delegate Count Graphs page. When a candidate gets down to 0%, they have cinched the nomination. If they get up past 100%, they have been mathematically eliminated. Rather than the date on the x-axis, we show the “% of Delegates Already Allocated” as this better represents the progress through the race. Note that these numbers include estimates of the eventual results of multi-stage caucus processes which will be refined as the later stages occur.
So it appears that the last 34 delegates from Super Tuesday, a handful each from Georgia, Ohio and Tennessee, have been determined. 17 more to Romney, 8 more to Gingrich and 5 more to Santorum. But wait, that is only 30! Well, according to Green Papers, 4 of the 63 delegates that were up for grabs in Ohio end up officially “Uncommitted”, which (I think) means we won’t actually know which way they may go until we know which actual human beings end up being those delegates and those people say publicly who they plan on supporting (which they may or may not actually do before the convention).
All in all, today’s results are once again a win for Romney. He got 56.7% of today’s delegates, which was way more than the 48.5% he needed to continue to move closer to the nomination rather than further way. His “% of remaining needed to win” drops now to 48.4%. For the other candidates, the effect on the other side is more dramatic. Santorum is still in 2nd place, but his “% of remaining needed to win” moves up from 64.5% to 65.5%. Romney may not yet be rapidly moving toward cinching the nomination, but the non-Romneys are rapidly moving toward being mathematically eliminated.
Looking at the non-Romney’s for a minute, the next few states are expected to favor them. Perhaps Santorum will win some. Perhaps Gingrich will win some. But to actually be on a pace to win, Santorum has to not just win a state, but win by a huge margin, getting more than 65.5% of the delegates. For Gingrich it is even worse, he would need to win getting 67.8% of the delegates. (For completeness, Paul would need to get more than 71.7%.)
Even with Romney expected to not be strong in these states, with four candidates in the race, you don’t expect anybody to be able to pull that kind of level except in winner take all (or winner take almost-all) states. Of the next few coming up… in Kansas, Guam, Northern Marianas, Virgin Islands, Alabama, Mississippi, Hawaii and American Samoa there are as usual complicated delegate rules (and the territories might only select uncommitted delegates), but none of them are straight up winner takes all. (Some allow for certain situations that could lead there though.) Bottom line, 65.5% (or more) is a pretty big ask and seems unlikely.
Which means that even if Santorum or Gingrich win some states (as expected) in terms of delegates they will almost certainly still both be heading closer to mathematical elimination rather than closer to the nomination. The big thing to look at will once again be looking at how well the non-Romney’s collectively block Romney from getting the 48.4% of the delegates he needs to be closing in on the nomination himself. With strong performance by the non-Romney’s in the next few contests, they may well be able to achieve this, even if they don’t actually help themselves individually.

Chart from the Abulsme.com 2012 Republican Delegate Count Graphs page. When a candidate gets down to 0%, they have cinched the nomination. If they get up past 100%, they have been mathematically eliminated. Rather than the date on the x-axis, we show the “% of Delegates Already Allocated” as this better represents the progress through the race. Note that these numbers include estimates of the eventual results of multi-stage caucus processes which will be refined as the later stages occur.
So, Super Tuesday happened. As of this update, Green Papers has “called” 385 of the 419 delegates available from the Super Tuesday contests. There are 34 delegates that haven’t been determined yet that will result in updates later, but of the ones we do know, the estimates for Super Tuesday contests are: Romney 208, Santorum 84, Gingrich 72, Paul 21. Romney also picked up a Superdelegate, bringing the total for the day to Romney 209, Santorum 84, Gingrich 72, Paul 21.
Compared to the Sabato Crystal Ball projections which we used to game out Super Tuesday over the weekend, Romney performed better than expectations, as did Gingrich. Santorum and Paul underperformed compared to those predictions. In any case, where does this put us…
Bottom line, Romney is the big winner today, and this may be the start of him actually pulling away and heading toward the nomination, but he is still not out of the woods in terms of the danger of being blocked from 1144. Lets look at the details.
The situation for Santorum, Gingrich and Paul is essentially what I mapped out in the gaming Super Tuesday post. To paraphrase what I said there, it is now absolutely undeniably clear (although the trend was obvious even before today) that none of these three guys are on a path to the nomination. Of the three, Santorum is doing the best, but with today’s numbers, to be on a path to win, he would need to now get 64.5% of the remaining delegates, compared to the 21.1% he has gotten so far. For this to even come into the realm of possibility, Gingrich and Paul would both have to stop getting delegates, Santorum would have to pick up all of their support, AND something would need to happen to cause support for Romney to plummet. This is a very unlikely sequence of events. It isn’t going to happen.
Oh, I guess I should also note that Gingrich pulled back ahead of Paul for 3rd place.
The remaining question is: “Are the non-Romney’s collectively still in a position to potentially block Romney from getting to 1144?” If after today, Romney was under 50% of the total delegates, and his “% of remaining needed to win” was heading upward or flat, this is a possibility that would be looking like it was still very much in play. But Romney exceeded the 49.7% of delegates he needed in order to be on track toward 1144, and did it by a decent margin. Of the delegates in today’s total, he picked up 209 of 386, or 54.1%. This reduced his “% of remaining needed to win” from 49.7% to 48.5%. That means to block, the non-Romney’s collectively need to be getting 51.5% of the delegates, compared to the 46.9% they have managed so far. So they have to do better than they have been so far, and by a non-trivial margin. And they have do do this even though it is obvious none of them can win outright. It has to be about stopping Romney.
Now, the rest of March has a bunch of states that are supposed to be relatively good for the non-Romneys. So the non-Romney’s managing to get 51.5% in the next few state is very much within the realm of possibility. After that we hit more Romney friendly states in April. The thing to watch for in the upcoming states is not who wins the popular vote, or even the delegate count. The question will be: “Is Romney continuing to get enough delegates to avoid being blocked?” Right now, that magic number is 48.2%. As long as he is getting 48.2% of the delegates (or more) then he is marching his way toward the nomination. If he gets less than that, then blocking will remain possible a little bit longer. If the rest of March really is friendly to the non-Romneys, we may see that Romney’s “% needed to win” starts heading back up a bit before Romney hits friendly states again and starts fully pulling away. As long as we see that happening, blocking Romney is still a possibility. And indeed, if Romney is damaged by the contests in March and his April states start looking not so good after all, then blocking starts looking more real again.
But Romney’s “% of remaining needed to win” is the smallest it has been so far, and none of the other candidates have realistic shots at winning, only a shot at blocking that relies on them continuing to win delegates even though it is obvious they can’t win, so Romney is in a pretty good position right now. Watch that line though. Until it starts heading downward decisively, Romney hasn’t got it wrapped up just yet.
So what is next? Well, first, the last 34 delegates from Super Tuesday (they are from Georgia, Ohio and Tennessee). Then on Sunday we have Kansas (40), Guam (9), Northern Marianas (9), Virgin Islands (9). Then Tuesday we have Alabama (50), Mississippi (40), Hawaii (20), American Samoa (9). And then it goes on and on…
|
|


